
A new risk warning signal - and what it means for stock market investors

Key points:
- The TCTM Risk Warning Model has triggered a new warning signal
- Historically, this has suggested the potential for new or continued trouble for stocks in the short term
- Below we detail the history of previous signals and one systematic approach to using the model
The TCTM Risk Warning Model triggers a warning sign
The chart below highlights with a red dot all dates since 1978 when the TCTM Risk Warning Model was at a reading of 1. The most recent signal occurred on September 28th.
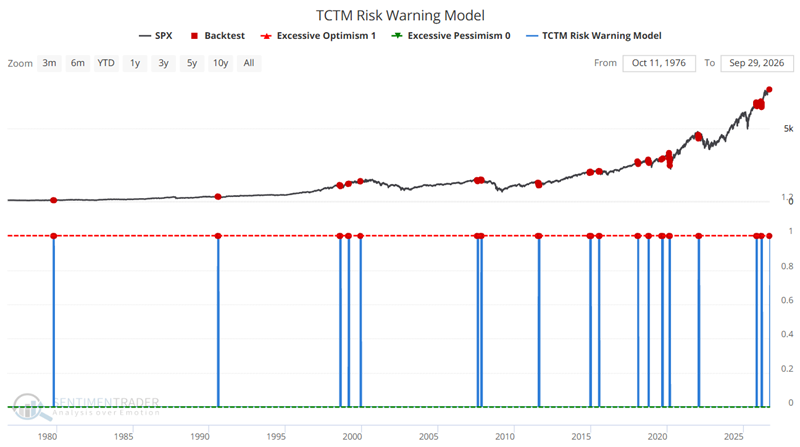
The table below summarizes subsequent S&P 500 performance. The key thing to note is negative median returns through one month after a signal, and the extremely subpar - and below 50% - win rates.