
A new IBD power trend signal for the Nasdaq Composite

Key points:
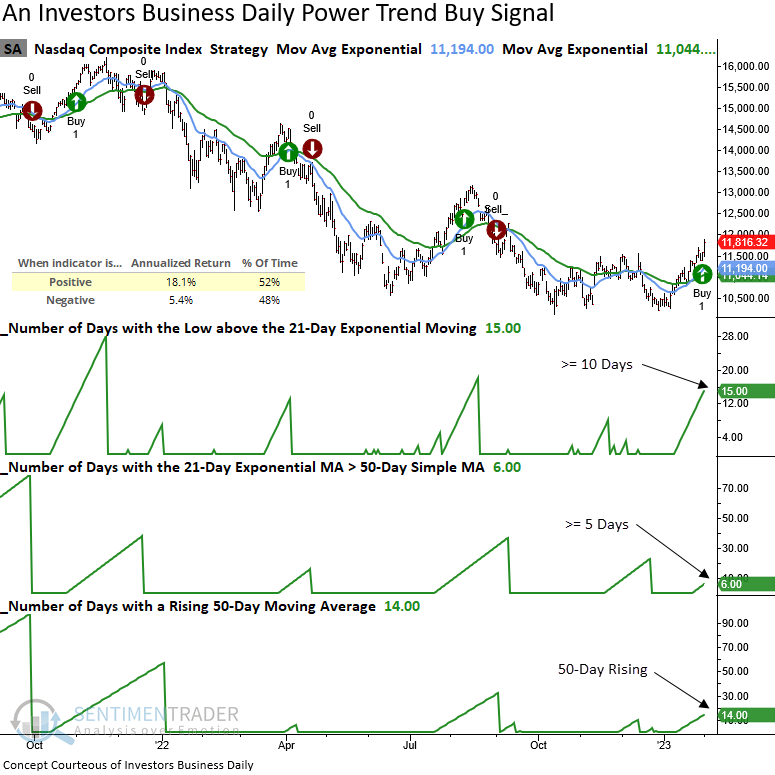
- The Investors Business Daily Power Trend strategy triggered a new buy signal for the Nasdaq Composite
- After similar trend changes, the Nasdaq Composite showed an annualized return of 18.1%
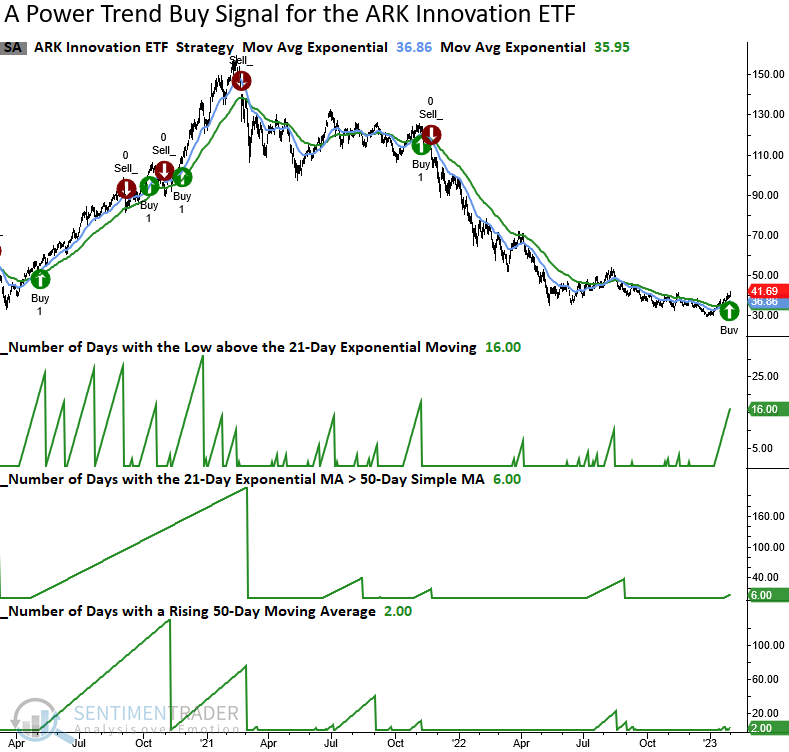
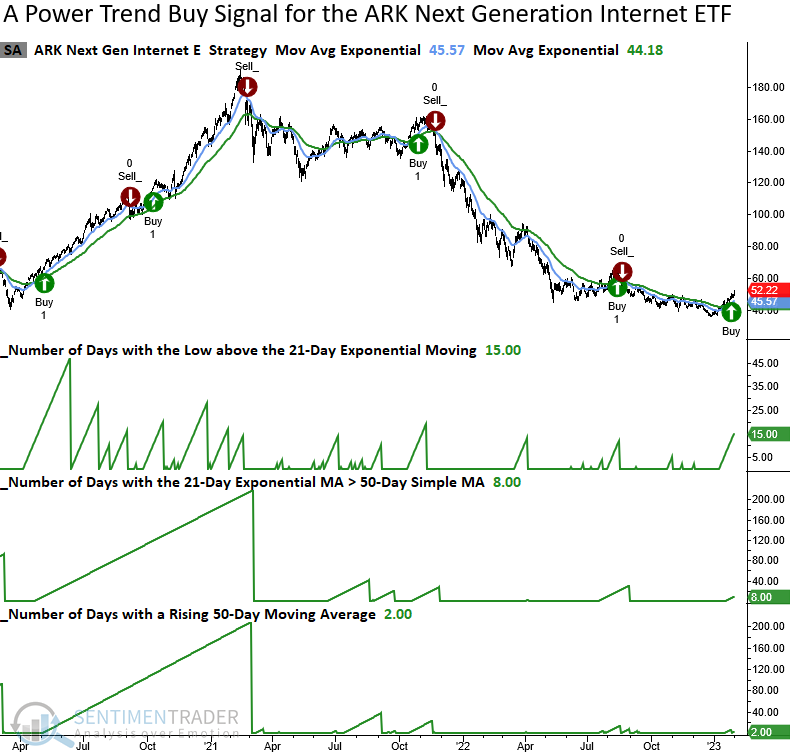
- The Power Trend system registered bullish alerts for several hyper-growth ETFs
A trend following strategy for hyper-growth stocks
William J. ONeil, the founder of Investors Business Daily and the creator of the CAN SLIM strategy, is an investing legend. Like the team at SentimenTrader, ONeil studied history to identify repeatable patterns to gain a market edge.
One of the IBD concepts for trend following, the Power Trend, triggered a new buy signal for the Nasdaq Composite. Remember, the Nasdaq Composite is where most hyper-growth stocks are listed, and trend-following strategies like this one thrive on trending markets.
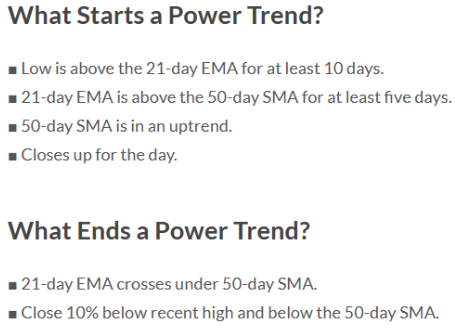
The Power Trend rules according to IBD
Based on the indicator duration lengths in the table below, I would classify the IBD system as an intermediate-term trend-following model. The key to trend-following or any other trading strategy is discipline. One must abide by the rules, or the probabilities of success diminish.
Remember, the goal with trend following is to maximize gains and cut losses short.
Hyper-growth stocks dominate the Nasdaq Composite
The Nasdaq Composite triggered its third buy signal since the S&P 500 peak in January 2022. While the two previous alerts turned out to be whipsaw signals, the composite annualizes at 18.1% when on a buy signal versus only 5.4% when a sell signal occurs.
Some other recent Power Trend signals
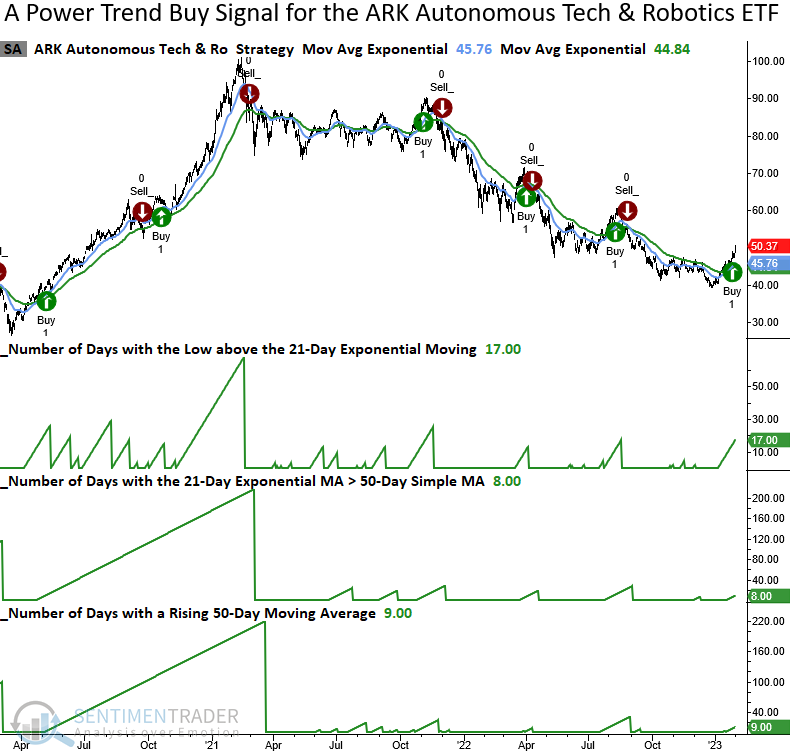
The ARK ETFs offer a reliable vehicle for the Power Trend signals as they tend to trend up or down versus moving sideways, which is an unfavorable condition for trend following.
"The trend is your friend until the end when it bends." - Ed Seykota
"A trend is a journey, not a destination." - Unknown"
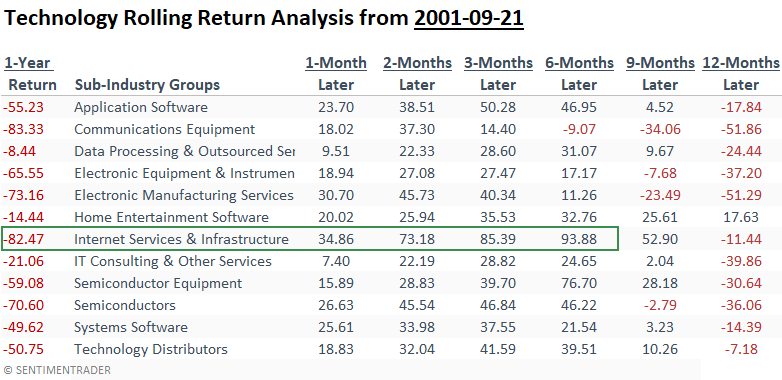
The 2021-22 Tech wreak versus the 2000-02 Dotcom bust
The 1-year rolling return for the ARK Innovation ETF declined to -72% in November 2022, similar to some of the worst 1-year rolling returns for Technology groups in the Dotcom bust. When stocks get as depressed as they are now, the potential for mean reversion is enormous.
What the research tells us...
The Nasdaq Composite and several hyper-growth stock ETFs triggered new bullish IBD Power Trend signals. With growth stocks severely depressed after peaking almost two years ago, the potential for a mean reversion trade looks favorable. Remember, the key to a trend-following system like the IBD one is to remain disciplined and adhere to the rules.