
A new economic indicator to keep an eye on

Key Points
- Employment is critical for the health of the economy; The more people that are earning an income to spend on goods and services, the better - and vice versa
- The Employment-Population Ratio provides a broad measure of economic health
- This piece details a newly constructed model that may help to highlight economic recessions early on
Never stop finding new ideas (because you're never too old to learn)
Last week, I had the pleasure of speaking at The NAAIM Outlook 2024 conference. One of the speakers was Larry Williams, one of my earliest and most significant influences as a trader. During his presentation, he discussed an economic indicator known as the Employment-Population Ratio. As the name implies, it divides the number of people employed by the total population to reach a ratio. This number is updated once a month.
While I follow several employment indicators, in all candor, I had never heard of this one. In crunching some numbers, I have concluded that it may be tremendously helpful in identifying the potential for economic recessions.
Please note that the indicator I detail below is something I just came up with in the last several days, so no real-world testing is involved. If someone wanted to argue that it merely curve fits the past, there is likely some truth to it. That said, the parameters and application are pretty straightforward and not very complicated. The sum total of the Model involves the 12-month rate-of-change in the Employment-Population Ratio and the one-month change in the Coincident Economic Indicators index (CEI).
The test period was 1957-12-31 through 2023-10-31. Starting at the end, the bottom line is this:
- The Model was favorable during 706 months; 666 months (94.3%) saw the Coincident Economic Indicators index rise, and only 40 months (5.7%) saw it decline
- The Model was unfavorable during 69 months; 18 months (26.1%) saw the Coincident Economic Indicators index rise, while 51 (73.9%) saw it decline
I found this disparity compelling and will track this indicator in the future. But again, only time will tell if it will be helpful in real time.
The Model Components
The only two inputs are the Employment-Population Ratio and the Coincident Economic Indicators index. The latest readings for both indicators are only evaluated once a month, after the close of trading on the last day of the month. The variables and calculations are listed below:
A = Employment-Population Ratio (evaluated only at the end of the month)
B = Coincident Economic Indicators (evaluated only at the end of the month)
C = 12-month % change in Employment-Population Ratio or ((A / A(12 mos. ago))-1) *100
D = One month % change in Coincident Economic Indicators or ((B / B(1 mo. ago)) -1)*100
E = If C >= 0, then +2 else 0 (if the 12-month change in EPR >= 0, then +2)
F = If D >= 0, then +1 else 0 (if the 1-month change in CEI >=0, then +1
The EPR Model monthly reading = E + F
The EPR Model monthly reading can range from 0 to +3
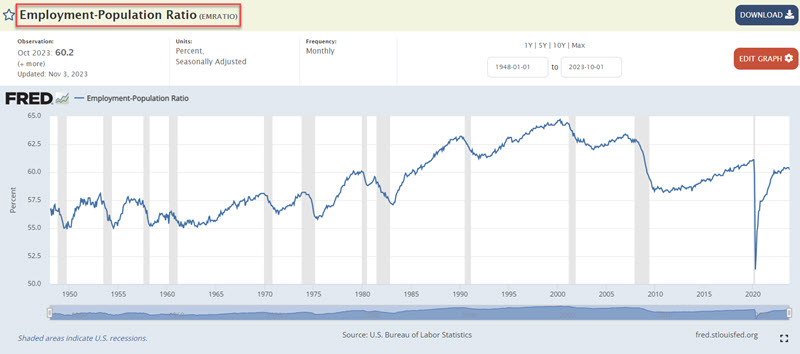
The chart below displays the raw Employment-Population Ratio from FRED
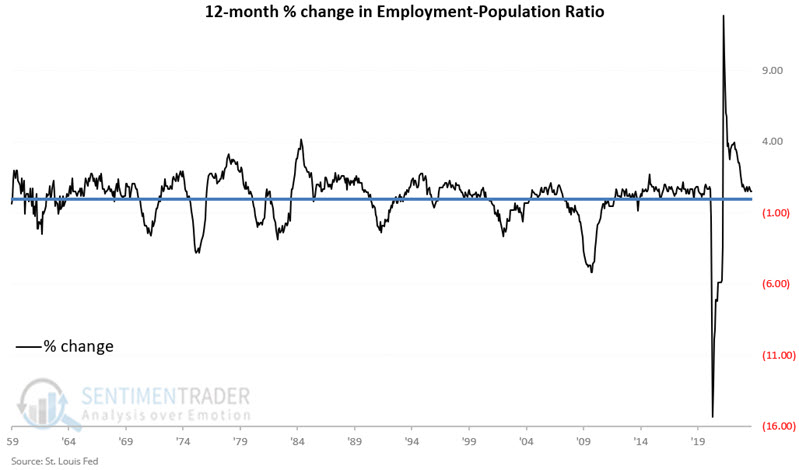
The chart below displays the 12-month ROC for the Employment-Population Ratio. In a nutshell, readings above 0 are good (as this shows relative employment growth) and vice versa.
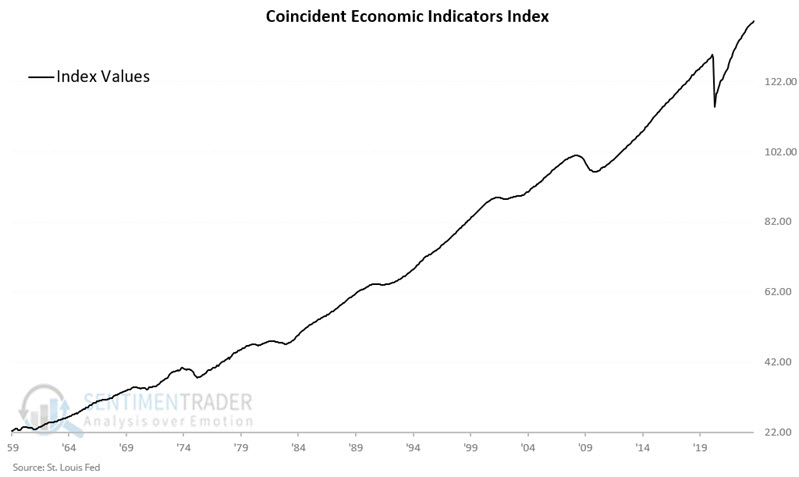
The chart below displays the Coincident Economic Indicators index.
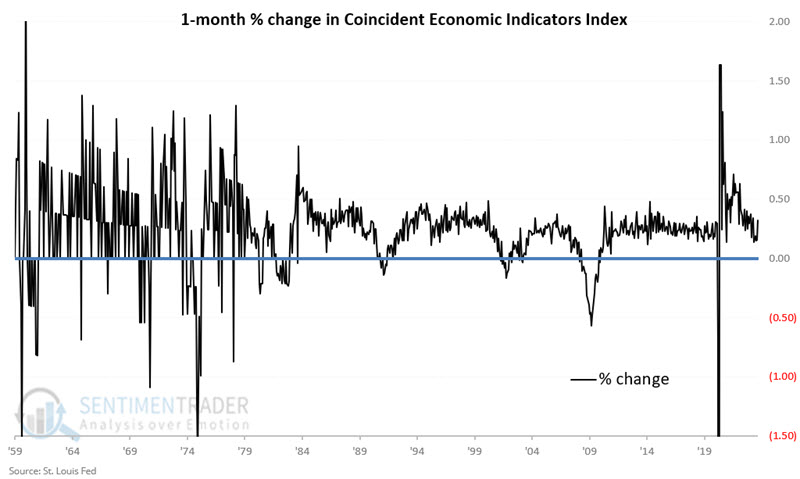
The chart below displays the 1-month ROC for the Coincident Economic Indicator Index. Readings of 0 or more are good (as this shows no economic contraction in the latest month).
Building the EPR Model
The EPR Model adds Variables E and F above together. The chart below displays the monthly readings for the EPR Model. Readings of 0 suggest a high potential for economic contraction.
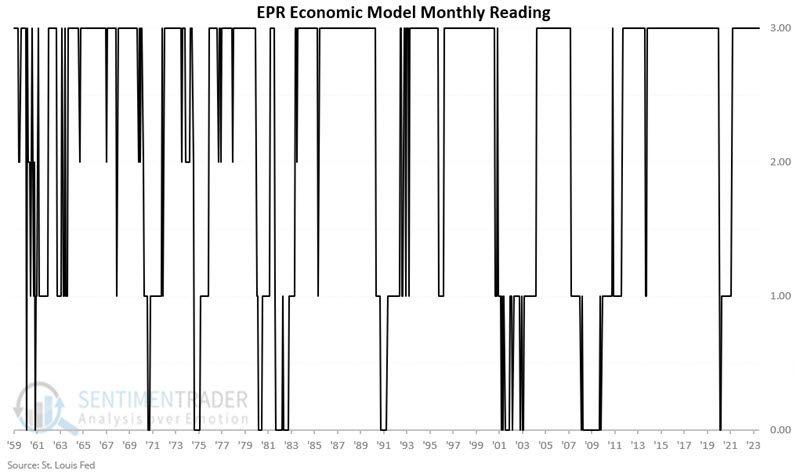
Readings above 0 are considered favorable for the economy (as measured using monthly changes in the Coincident Economic Indicators index). Readings of 0 are considered unfavorable.
Comparing the EPR Model signal to economic performance
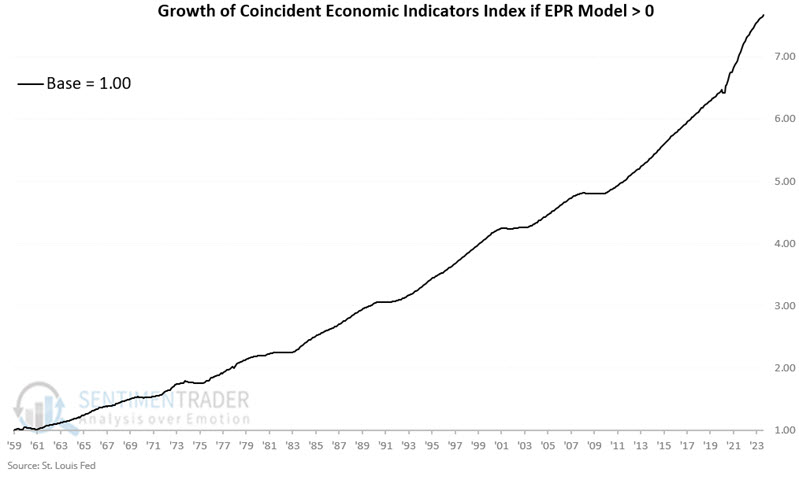
The chart below displays the Coincident Economic Indicators index growth only for those months when the EPR Model is greater than 0 at the end of the previous month. While imperfect, the long-term "lower left to upper right" trend is unmistakable.
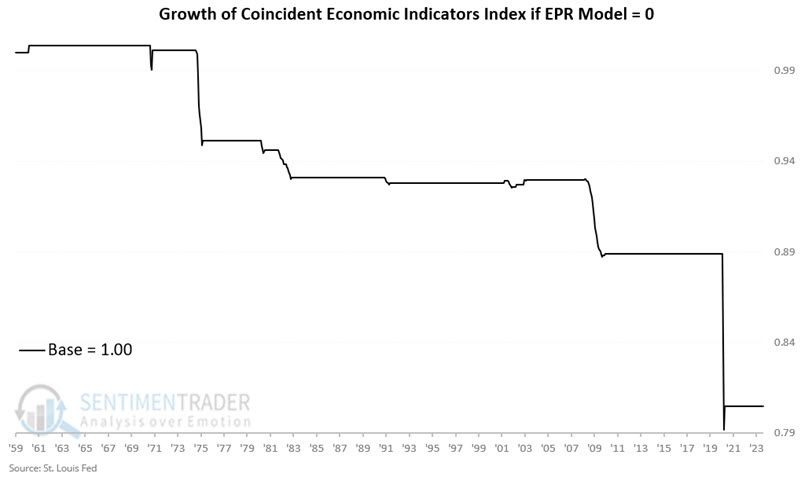
The chart below displays the Coincident Economic Indicators index growth only for those months when the EPR Model is equal to 0 at the end of the previous month.
The table below summarizes the Coincident Economic Indicators index's performance depending on the EPR Model's status.
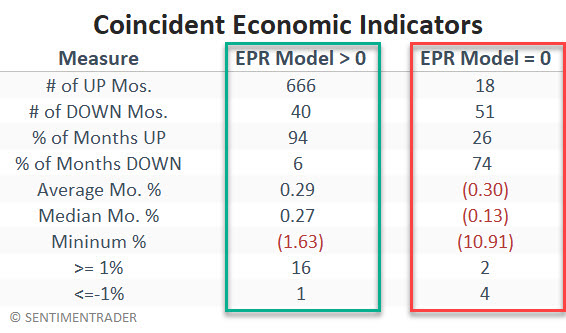
The bottom line: The risk of an economic recession appears to be significantly higher when the EPR Model = 0. On the other hand, the risk of recession seems to be relatively low when the EPR Model is above 0.
The current EPR Model status
At the end of October, the variables for the EPR Model were as follows:
A (Employment-Population Ratio at the end of the month) = 60.4
A 12 months ago = 60.1
B (Coincident Economic Indicators index at the end of the month) = 139.21
B 1 month ago = 138.76
C (((A / A(12))-1) *100) = ((60.40 / 60.10) -1) * 100) = 0.50
D (B - B(1)) = (((139.21 / 138.76) - 1) * 100) = 0.32
E = +2 (because Variable C > 0)
F = +1 (because Variable D > 0)
At the end of October 2023, the EPR Model = +3
Based on these calculations, the EPR Model is deemed "favorable" for the economy during November, implying that the Coincident Economic Indicators index should likely not decline during November 2023.
What the research tells us...
For the record, I still rely most heavily on the Sentimentrader Macro Index Model to discern and define the trend of the overall economy. The Model highlighted above is brand new and contains zero out-of-sample data. Nevertheless, given the consistent tendency for weakness shown by the Coincident Economic Indicators index during those months when the EPR Model equaled 0, I will be keeping a close eye on this in the future for economic clues.