Data &
Technology
Research
Reports
Report Solutions
Reports Library
Actionable
Strategies
Free
Resources
Simple Backtest Calculator
Simple Seasonality Calculator
The Kelly Criterion Calculator
Sentiment Geo Map
Public Research Reports
Free Webinar
Pricing
Company
About
Meet Our Team
In the News
Testimonials
Client Success Stories
Contact
Log inLoginSign up
< BACK TO ALL REPORTS

A New Buy Signal in Housing

Dean Christians
2021-01-25
A new housing model signal occurred on 1/22/21. What's the message for homebuilders and the broad market?

Some years ago, I created several housing market models. I love that housing has numerous macro data inputs that I can utilize in conjunction with my micro bottom-up factor, relative strength.  Full disclosure, I had another reason for creating my housing models. My wife's family operates a fairly sizable homebuilding operation in the southeast.

In today's' note, I want to share one of the housing models as it triggered a new signal on 1/22/21.

Remember, Sentimentrader is not in the business of making specific recommendations. Our objective is to provide you with data and studies to help you with your research process.

Housing Market Model

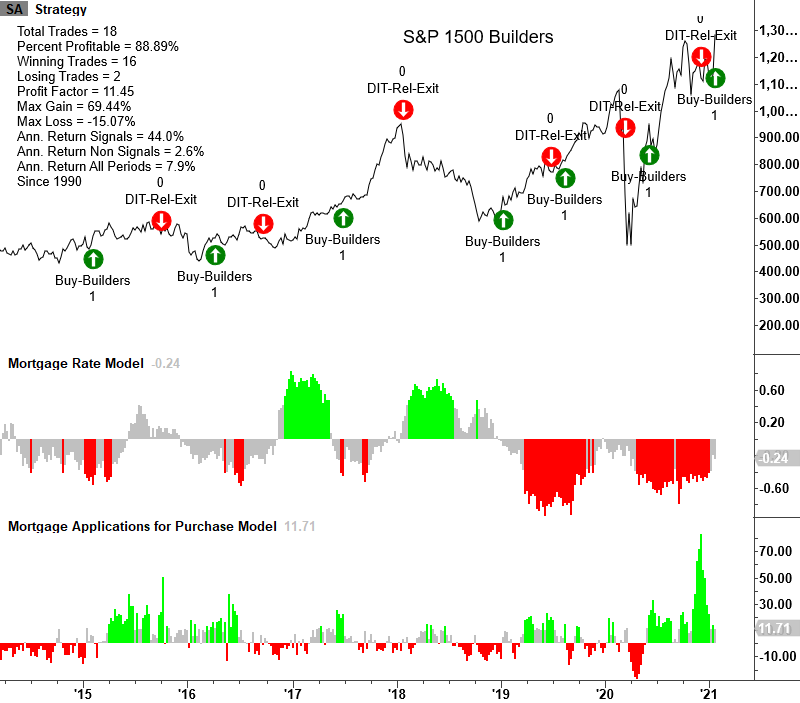
The housing market model is straightforward. It looks for favorable housing conditions as measured by mortgage rates and applications for purchase for single-family homes. i.e., rates are down, and applications are up. Once the housing data turns favorable, the model buys builders on a new relative high vs. the S&P 500. The model exits the trade when relative strength for the builders turns unfavorable.

Chart and Signal Example

Please note, it's not uncommon for the model to exit a trade and immediately reinitiate a buy signal like the most recent one.
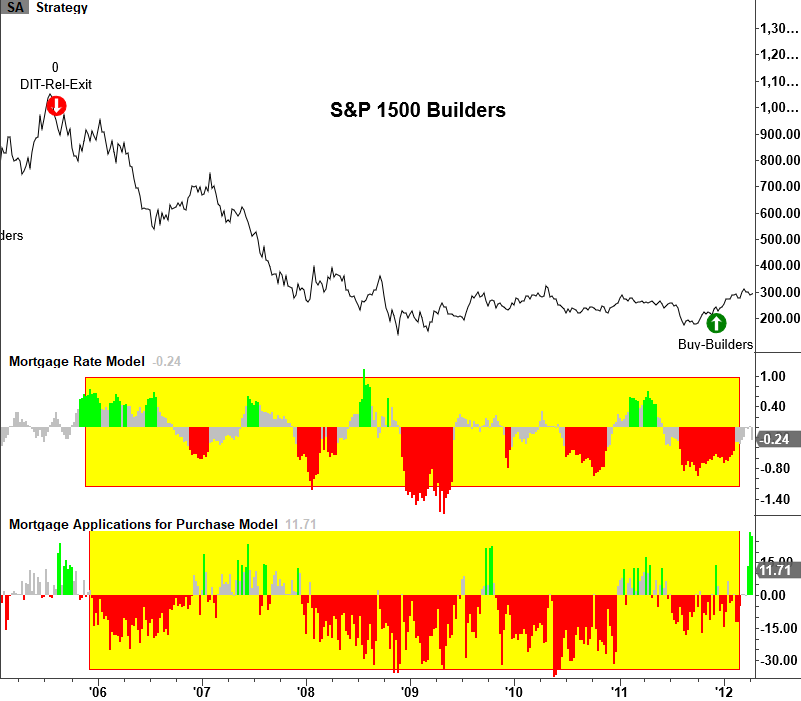
 

2005-2011 Example

I think it's important to share a chart of the model during the 2005-2011 period. As one can see in the highlighted area, the model had some favorable conditions when rates were down and applications up. However, the relative strength component did not trigger.


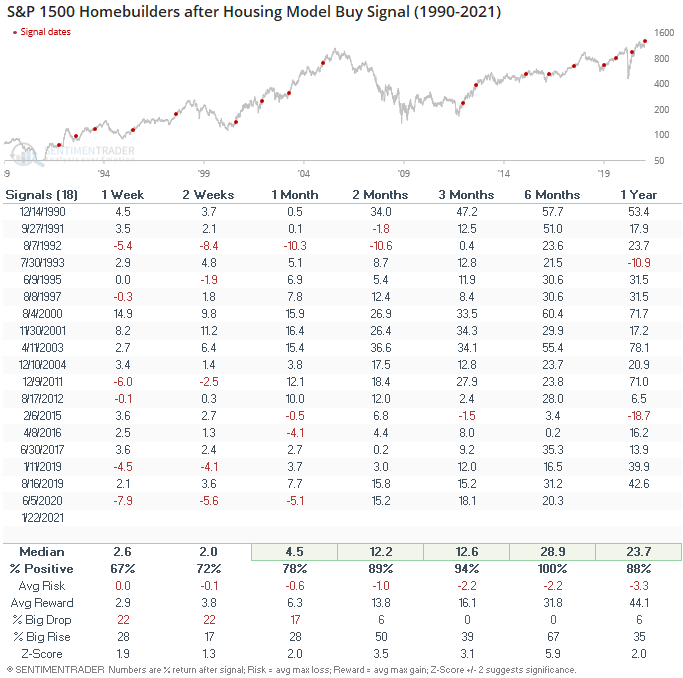
Housing Signal Performance

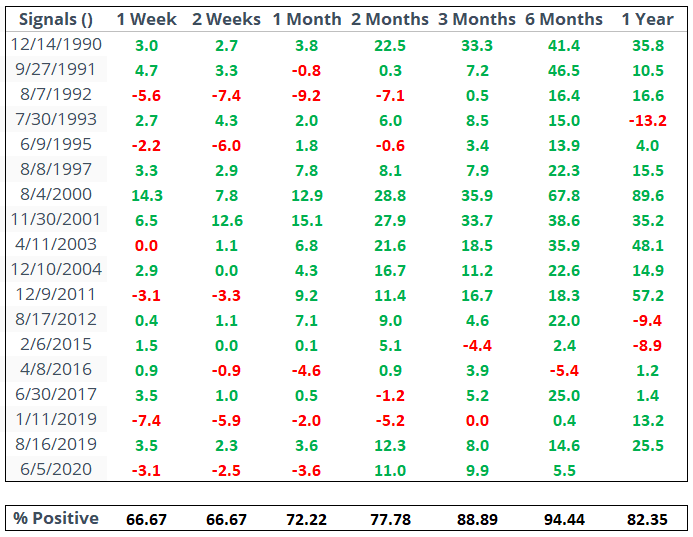
As the table below shows, the absolute performance for homebuilders is robust on all timeframes. Especially in the 2-12 period. It even performed well during the 2000-2002 recession/bear period. 
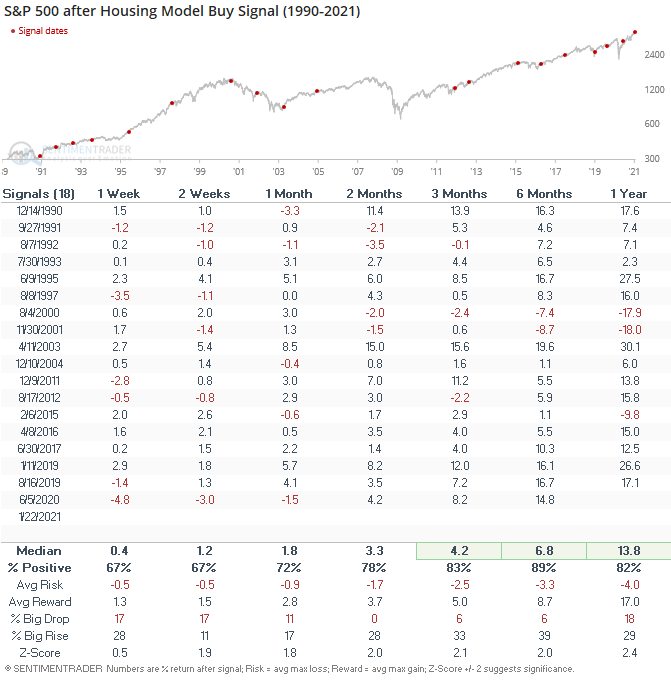
S&P 500 Performance

Given the homebuilders' strong performance, let's see how the S&P 500 performs when a housing model signal is triggered. Outside of the 2000 and 2001 recession/bear market signals, the numbers look good.

S&P 1500 Homebuilders Relative Performance vs. S&P 500

Of course, I always want to check relative performance when I'm examining a specific group. As one can see, relative performance versus the S&P 500 is robust.  


Conclusion: A new buy signal in my housing market provides a favorable backdrop for builders and the broad market.

Sorry, you don't have access to this report

Upgrade your subscription plan to get access
Go to Dasboard
DATA &
TECHnologies
IndicatorEdge
‍
BackTestEdge
‍
Other Tools
‍
DataEdge API
RESEARCH
reports
Research Solution
‍
Reports Library
‍
actionable
Strategies
Trading Strategies
‍
Smart Stock Scanner
‍
FREE
RESOUrCES
Simple Backtest
Calculator
Simple Seasonality
Calculator
The Kelly Criterion
Calculator
Sentiment Geo Map
‍
Public Research Reports
‍
Free Webinar
COMPANY
‍
About
‍
Meet our Team
‍
In the News
‍
Testimonials
‍
Client Success Stories
Pricing
Bundle pricing
‍
Announcements
‍
FAQ
© 2024 Sundial Capital Research Inc. All rights reserved.
Setsail Marketing
TermsPrivacyAffiliate Program
Risk Disclosure: Futures and forex trading contains substantial risk and is not for every investor. An investor could potentially lose all or more than the initial investment. Risk capital is money that can be lost without jeopardizing ones’ financial security or life style. Only risk capital should be used for trading and only those with sufficient risk capital should consider trading. Past performance is not necessarily indicative of future results.

Hypothetical Performance Disclosure: Hypothetical performance results have many inherent limitations, some of which are described below. No representation is being made that any account will or is likely to achieve profits or losses similar to those shown; in fact, there are frequently sharp differences between hypothetical performance results and the actual results subsequently achieved by any particular trading program. One of the limitations of hypothetical performance results is that they are generally prepared with the benefit of hindsight. In addition, hypothetical trading does not involve financial risk, and no hypothetical trading record can completely account for the impact of financial risk of actual trading. for example, the ability to withstand losses or to adhere to a particular trading program in spite of trading losses are material points which can also adversely affect actual trading results. There are numerous other factors related to the markets in general or to the implementation of any specific trading program which cannot be fully accounted for in the preparation of hypothetical performance results and all which can adversely affect trading results.

Testimonial Disclosure: Testimonials appearing on this website may not be representative of other clients or customers and is not a guarantee of future performance or success.