
A new breadth thrust buy signal for the energy sector

Key points:
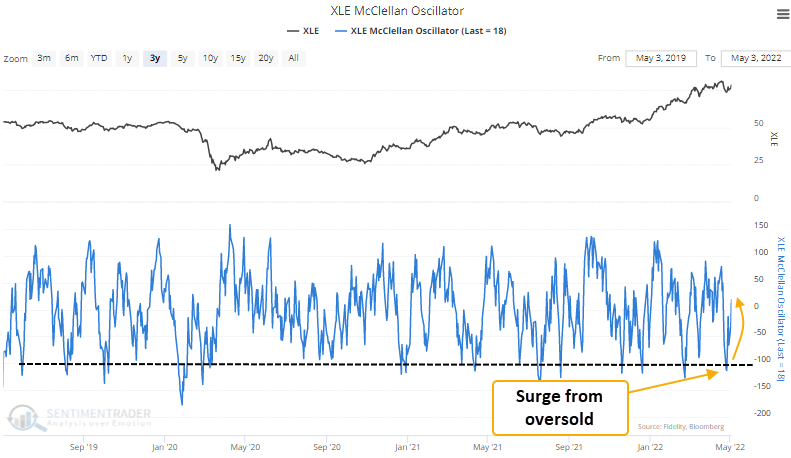
- The McClellan Oscillator for the energy sector surged from an oversold condition
- The oversold condition occurred within the context of solid sector participation trends
- After other signals, the industry has rallied 70% of the time over the subsequent 1 & 2 month periods
Measuring the breadth of participation with the McClellan Oscillator
The McClellan Oscillator is a market breadth indicator that measures the momentum of the underlying members of an index. Momentum is positive when it is above zero; below zero, it is negative. It also works as an overbought/oversold indicator when it pushes above +100 or below -100, respectively. If you're interested in learning more about the McClellan Oscillator, click here.
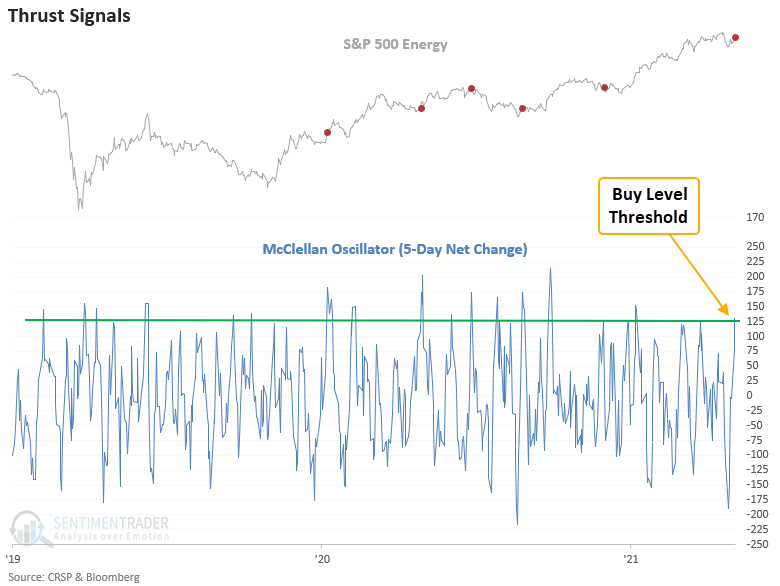
A trading model for the McClellan Oscillator
The model applies a 5-day net change to the McClellan Oscillator. An oversold reset condition is confirmed when the McClellan Oscillator falls below -110. Once the oversold reset occurs, the buy signal triggers when the McClellan Oscillator 5-day net change crosses above 125. At the same time, the 5-day rate of change for the energy sector must be positive. The final model condition requires 90% or more of the energy sector members to have an upward sloping 200-day moving average. i.e., significant long-term trend participation.
So, the model identifies a breadth thrust from an oversold condition within the context of bullish long-term participation trends.
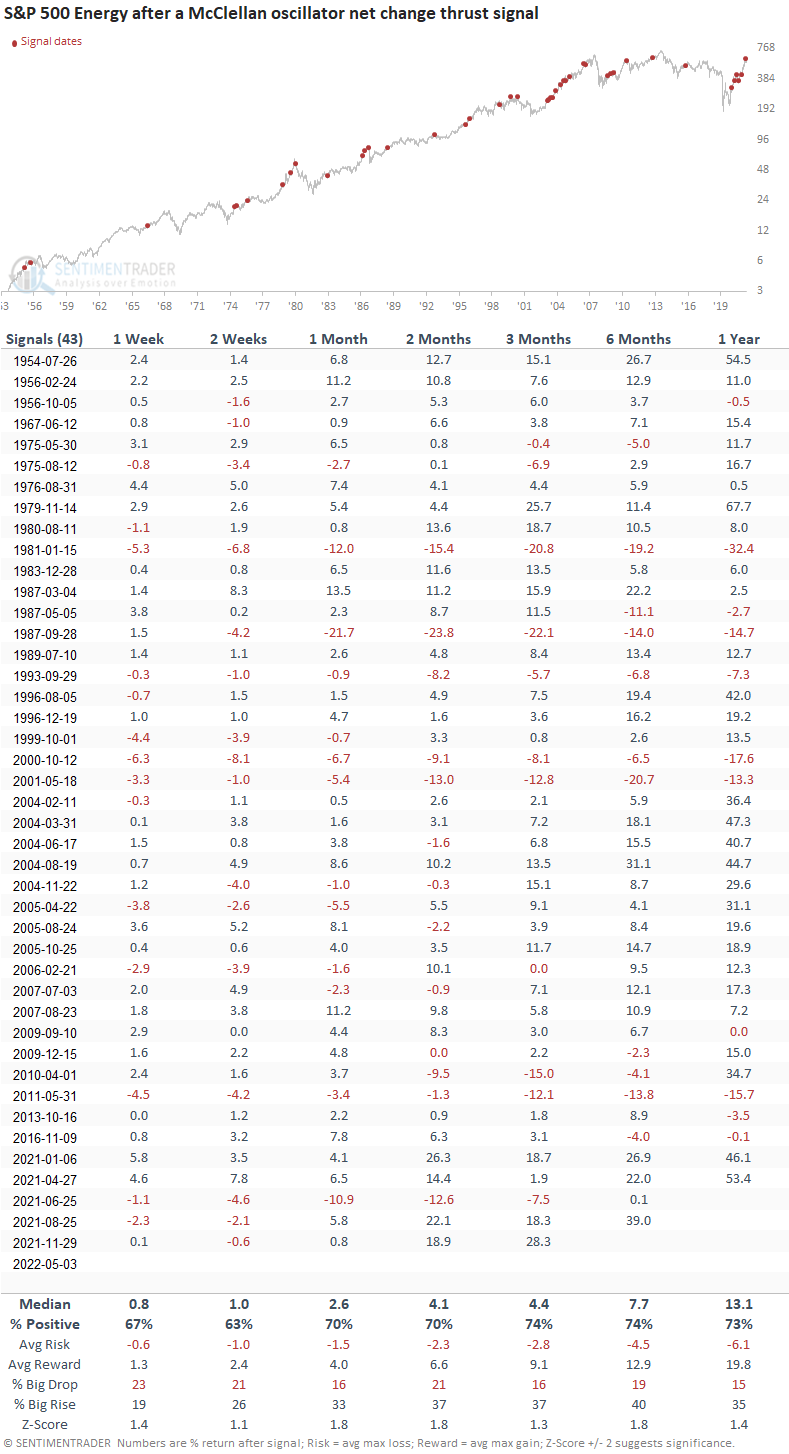
Energy stocks rallied 70% of the time after other signals
This model generated a signal 43 other times over the past 68 years. After the others, energy sector future returns, win rates, and risk/reward profiles were solid across all time frames. While non of the signals showed a z-score with significance, several time frames got close. The current alert represents the 6th instance in the current energy bull market, which suggests this environment looks more and more like 2003-08.
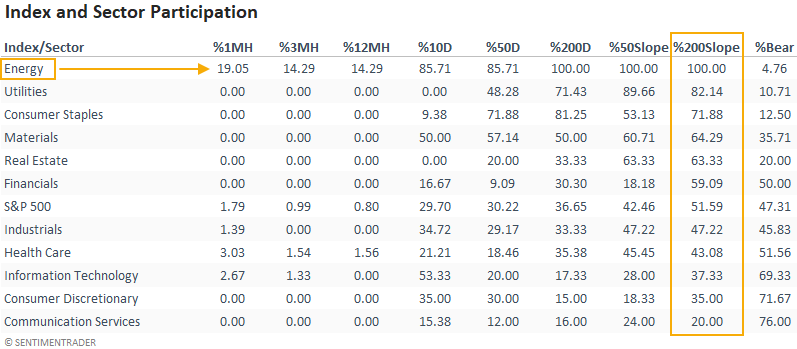
Internal trend participation amongst energy stocks looks excellent
Energy sector participation looks solid across short, medium, and long-term indicators. I would also note that new highs are starting to expand again.
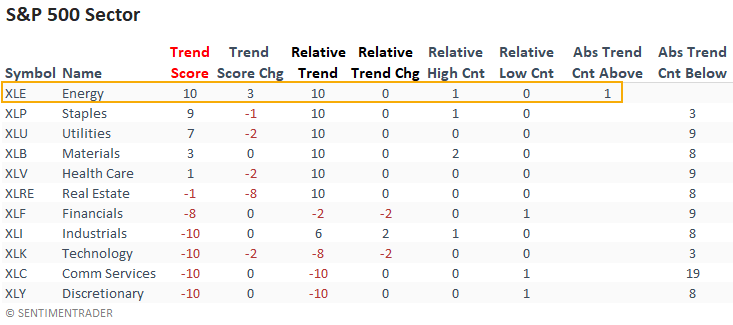
External price trends look solid on an absolute and relative basis
If we look at external trends for the energy sector, we see a similar positive backdrop. Energy is the only sector with an absolute and relative trend score of 10, the highest possible score.
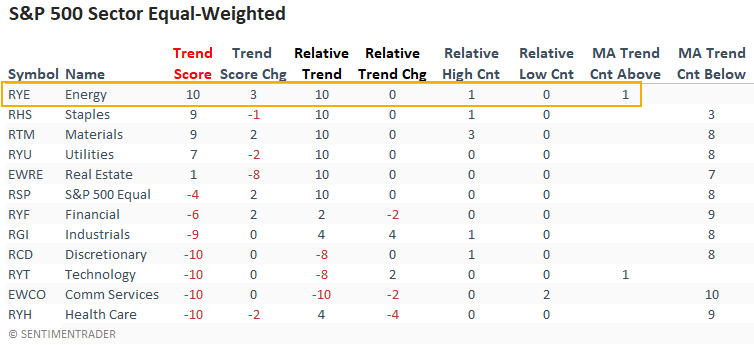
The equal-weighted sector data confirms the cap-weighted data, with perfect absolute and relative trend scores.
What the research tells us...
When the energy sector's 5-day net change for the McClellan Oscillator surges from an oversold condition within a bullish long-term trend backdrop, the momentum begets more momentum. Similar setups to what we're seeing now have preceded rising energy stock prices, especially across medium-term time frames.
I highlighted several bullish energy sector signals in January. Please click here, here, and here. So, if you have a position in the sector, I would add this signal to the bullish ledger for the group. However, we need to remember that the overall market backdrop is unhealthy, and the dollar is no longer our friend, especially when it comes to commodities.