Products
SentimenTrader Trading Tools
‍
Backtest Engine
My Trading Toolkit
Correlation Analysis
Seasonality
Indicators & Data API
‍
Proprietary Indicators & Charts
Market Data API
Strategies & Scanner
‍
50+ Trading Strategies
Smart Stock Scanner
Research Reports
‍
Research Solutions
Reports Library
Free Resources
Simple Backtest Calculator
Simple Seasonality Calculator
The Kelly Criterion Calculator
Sentiment Geo Map
Public Research Reports
Education
Sentiment Indicators
Technical Indicators
Pricing
Company
About
In the News
Testimonials
Client Success Stories
Contact
Log inLoginSign up
< BACK TO ALL REPORTS

A negative shift in relative trends across Europe

Dean Christians
2023-09-05
The percentage of European country ETFs with a relative trend score of -10 cycled from less than 25% to greater than 66%, triggering a bearish signal for the MSCI Europe Index. After similar alerts, the index was lower 68% of the time over the subsequent two months.

Key points:

  • The percentage of European country ETFs with the worst possible relative trend score surged higher
  • Similar trend score conditions led to unfavorable returns for the MSCI Europe Index over the next few months

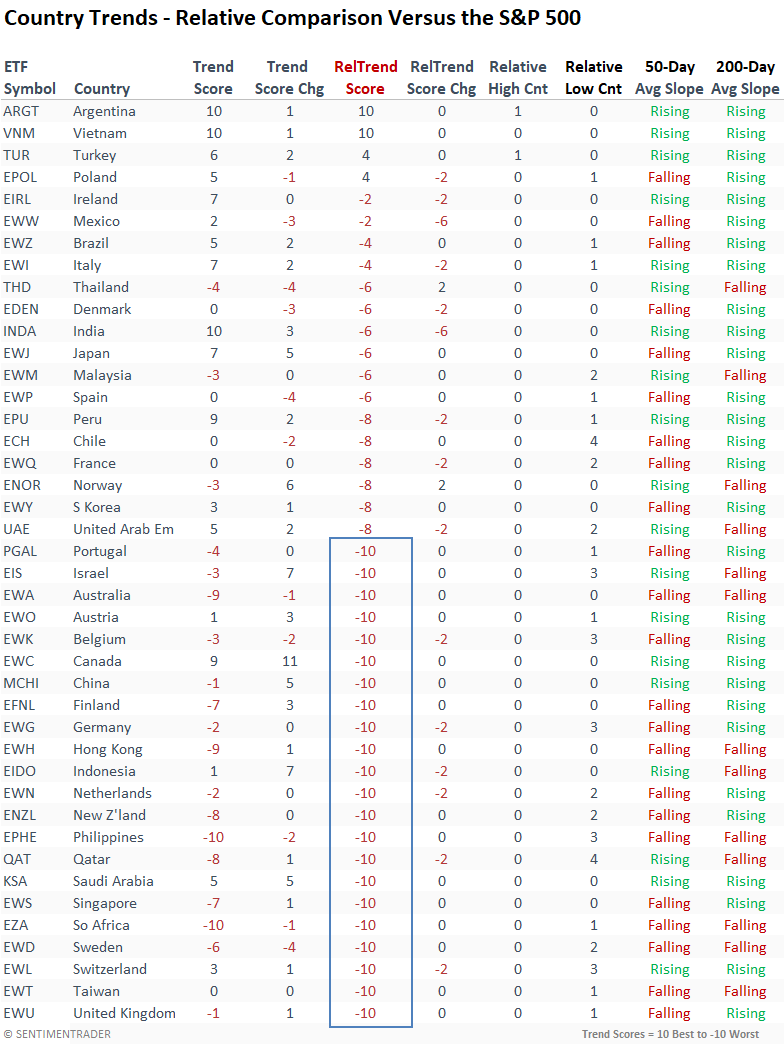
Trend scores for European country ETFs are losing ground relative to the S&P 500

Despite the persistent talk of a looming rotation from growth to value, my evidence-based market research approach doesn't lend strong support to this narrative, even as the value-oriented energy sector shows bullish internal dynamics.

Nowhere do we see a more unambiguous indication of the case against an impending shift than in global indexes, which are tilted more toward value-oriented stocks. Among the 42 country ETFs I track, only four maintain a positive relative trend score when compared to the S&P 500.

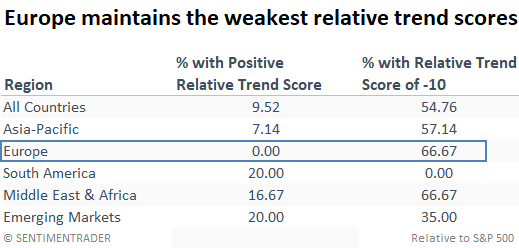
Regarding regions around the globe, Europe is a glaring weak spot. Astonishingly, no European country maintains a positive relative trend score versus the S&P 500. Even more concerning is the recent surge in countries achieving the lowest possible score, with a whopping two-thirds of European nations now residing at a dismal -10.

When aggregating the relative trend scores for regions globally, it's notable that no European country maintains a positive score compared to the S&P 500, and the percentage with the worst possible score, -10, has now increased to 66%.

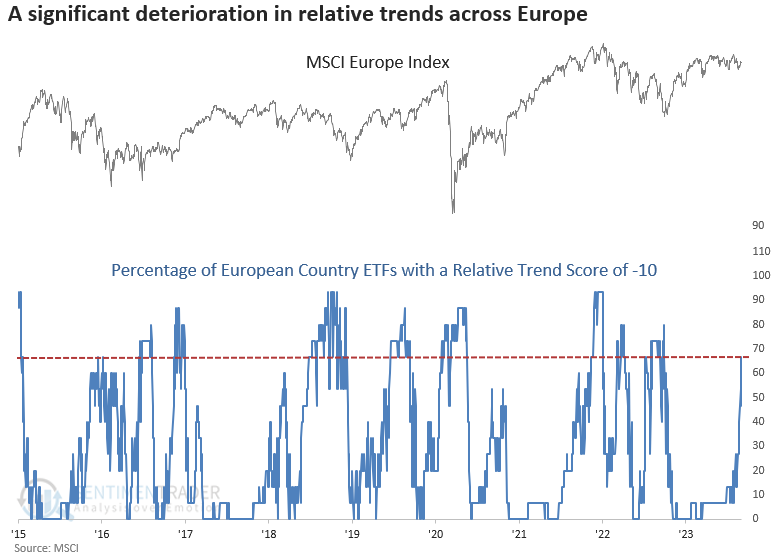
The percentage of European country ETFs with a relative trend score of -10 increased to the highest level since September 2022.

Similar relative trend score conditions suggest Europe could struggle

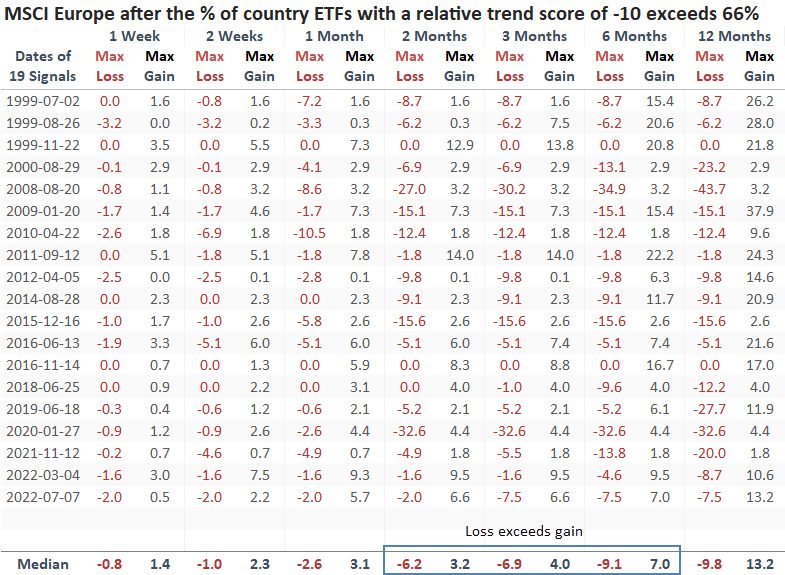
When the percentage of European country ETFs with a relative trend score of -10 cycles from less than 25% to greater than 66%, the MSCI Europe Index tends to bounce in the near term. However, after the relief rally, the index showed negative returns over the subsequent one and two-month periods.

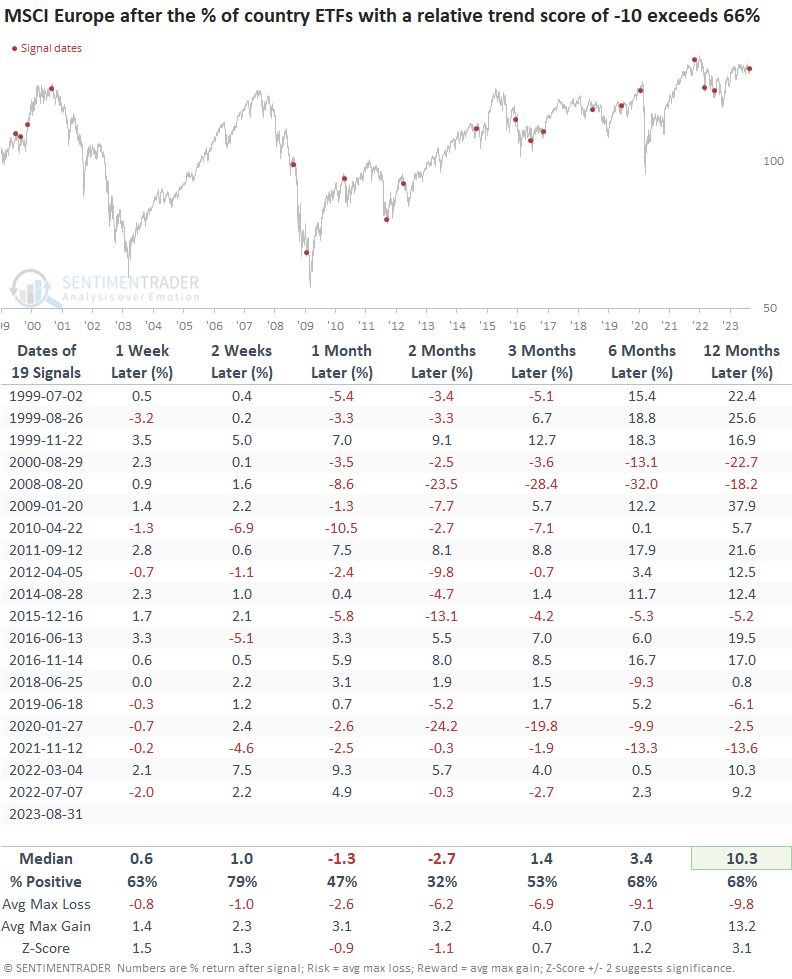
The median max loss exceeds the max gain from two to six months later.

What the research tells us...

Except for just a handful of nations, global relative trend scores exhibit weak conditions compared to the S&P 500. This discrepancy is glaring in Europe, where an astonishing two-thirds of countries presently hold the lowest attainable scores. Unfavorable relative trend score conditions, like now, tend to foreshadow poor absolute returns for the MSCI Europe Index over the subsequent one and two-month periods.

Sorry, you don't have access to this report

Upgrade your subscription plan to get access
Go to Dasboard
PRODUCTS
SentimenTrader
Trading Tools
Indicators & Data API
‍
Strategies & Scanner
‍
Research Reports
FREE
RESOUrCES
Simple Backtest
Calculator
Simple Seasonality
Calculator
The Kelly Criterion
Calculator
Sentiment Geo Map
‍
Public Research Reports
‍
Education
Sentiment Indicators
‍
Technical Indicators
‍
Pricing
Bundle pricing
‍
FAQ
‍
Announcements
‍
COMPANY
‍
About
‍
In the News
‍
Testimonials
‍
Client Success Stories
CONTACT
‍
General Inquiries
‍
Media Inquiries
‍
Financial Professionals Inquiries
‍
© 2026 Sundial Capital Research Inc. All rights reserved.
Setsail Marketing
TermsPrivacyAffiliate Program
Risk Disclosure: Futures and forex trading contains substantial risk and is not for every investor. An investor could potentially lose all or more than the initial investment. Risk capital is money that can be lost without jeopardizing ones’ financial security or life style. Only risk capital should be used for trading and only those with sufficient risk capital should consider trading. Past performance is not necessarily indicative of future results.

Hypothetical Performance Disclosure: Hypothetical performance results have many inherent limitations, some of which are described below. No representation is being made that any account will or is likely to achieve profits or losses similar to those shown; in fact, there are frequently sharp differences between hypothetical performance results and the actual results subsequently achieved by any particular trading program. One of the limitations of hypothetical performance results is that they are generally prepared with the benefit of hindsight. In addition, hypothetical trading does not involve financial risk, and no hypothetical trading record can completely account for the impact of financial risk of actual trading. for example, the ability to withstand losses or to adhere to a particular trading program in spite of trading losses are material points which can also adversely affect actual trading results. There are numerous other factors related to the markets in general or to the implementation of any specific trading program which cannot be fully accounted for in the preparation of hypothetical performance results and all which can adversely affect trading results.

Testimonial Disclosure: Testimonials appearing on this website may not be representative of other clients or customers and is not a guarantee of future performance or success.