
A negative momentum shift, breakdown, and extreme fear in the world's most risky asset

Key points:
- The RSI for Bitcoin shifted to an unfavorable position, triggering a sell signal for the cryptocurrency
- When the RSI maintains a bear regime status, returns for Bitcoin significantly underperform bull regime periods
- Bitcoin triggered a base breakdown pattern, suggesting the downside momentum persists
- Sentiment toward cryptocurrencies reaches extreme fear, indicating reluctance to buy-the-dip
Price momentum in Bitcoin turns unfavorable
In an October 2024 research report, I shared a trading system for Bitcoin that had triggered a buy signal for the cryptocurrency. Over the subsequent three months, Bitcoin gained 44%.
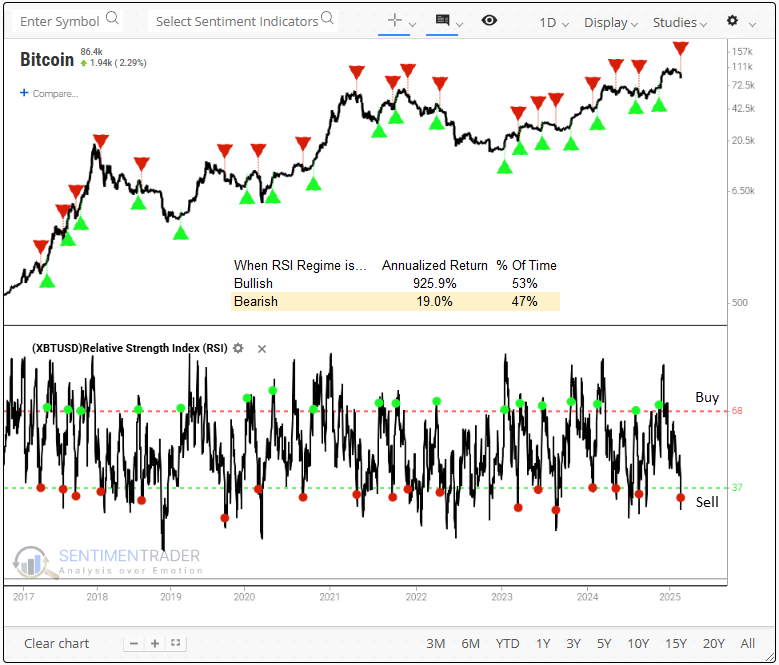
The system utilizes the Relative Strength Index (RSI) to identify bullish or bearish momentum regimes. A buy signal occurs when the RSI increases above 68. This bullish status will persist until the RSI dips below 37, at which point the model shifts to a bear regime.
On Tuesday, the model shifted to a bear regime. Although annualized returns remain positive in bear regimes, they lag significantly behind those of bull regimes, as depicted in the chart below.
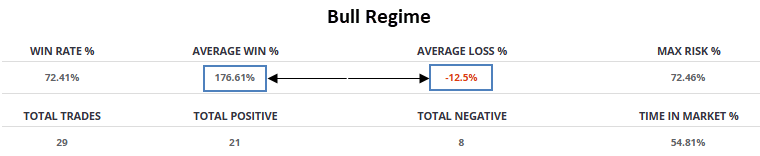
Bull versus Bear Regime
The RSI system has generated 29 bull regime signals with a 72% success rate, achieving an average gain of 176% per win, while losses averaged -12.5%. However, when the signal parameters are reversed to reflect a bear regime, the system produced a 62% win rate. Furthermore, the average gains and losses were nearly identical, suggesting that buying oversold RSI conditions lacked a favorable risk/reward profile.
Backtest Engine
Click here to add the RSI system for Bitcoin to your favorites folder in the Backtest Engine 2.0.
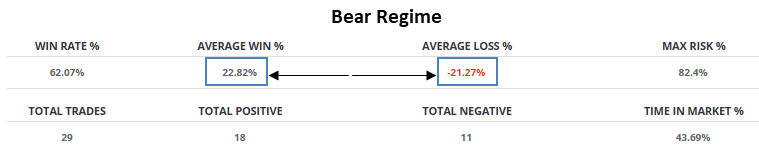
An unfavorable price pattern
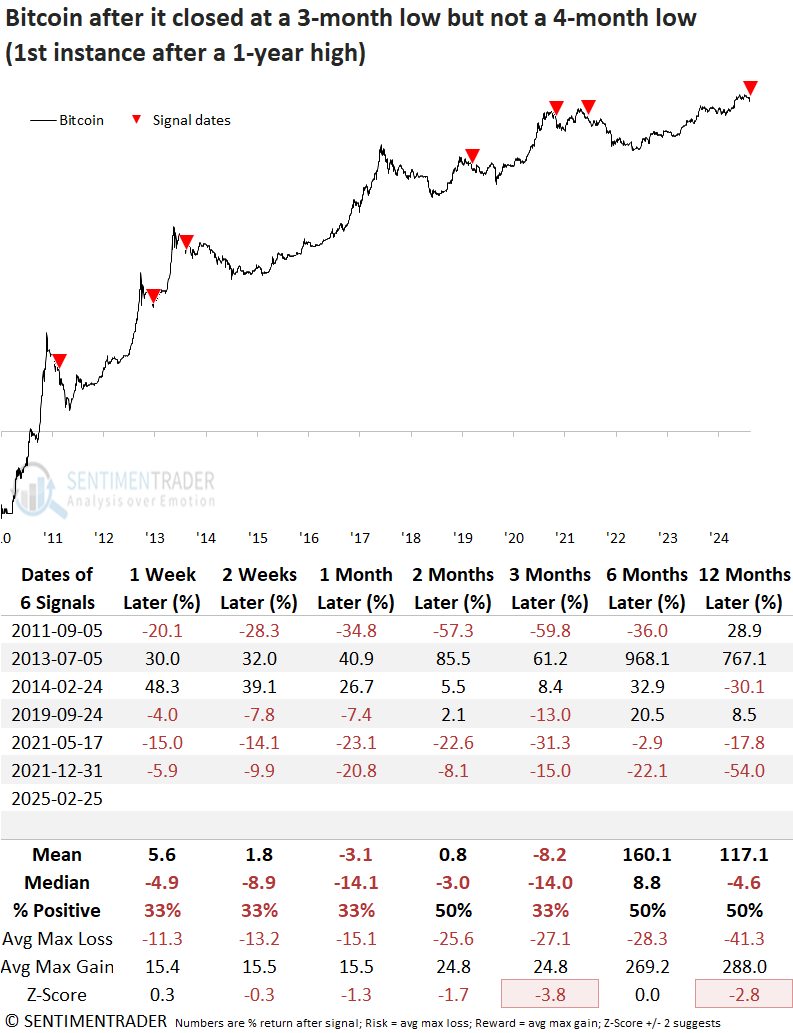
Bitcoin reversed from a 1-year high, undercutting a 3-month low but not achieving a 4-month low, a price pattern known as a base or consolidation breakdown.
Bitcoin has historically struggled in the three months following similar top formations. While the six- and twelve-month win rates resembled a coin toss, Bitcoin displayed negative returns at some point within the next year in all but one instance, 2013.
Investor sentiment toward cryptocurrencies has turned pessimistic
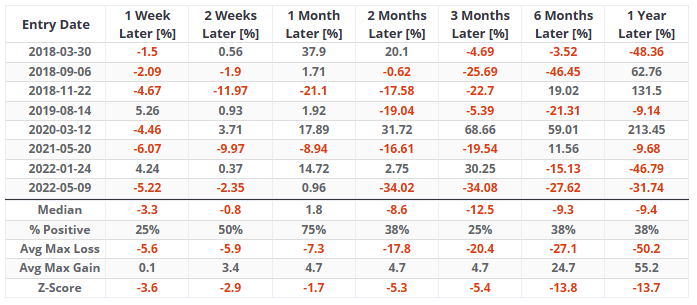
The Crypto Fear and Greed Index from Alternative.me indicates extreme fear, reaching its lowest reading since 2022. While fear often presents a buying opportunity, this sentiment gauge doesn't align with that strategy.
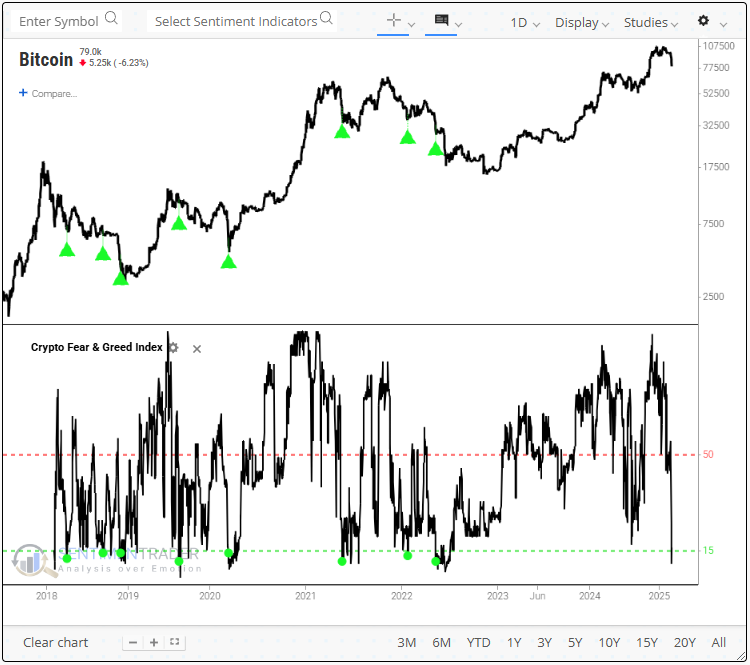
Whenever the Crypto Fear and Greed Index cycled from above 50% to below 15%, the outlook for Bitcoin was negative across all time frames except the one-month horizon.
Trading success often depends on having the confidence to take decisive action. When sentiment turns pessimistic in this asset class, hesitation keeps traders on the sidelines, most likely due to the extreme volatility.
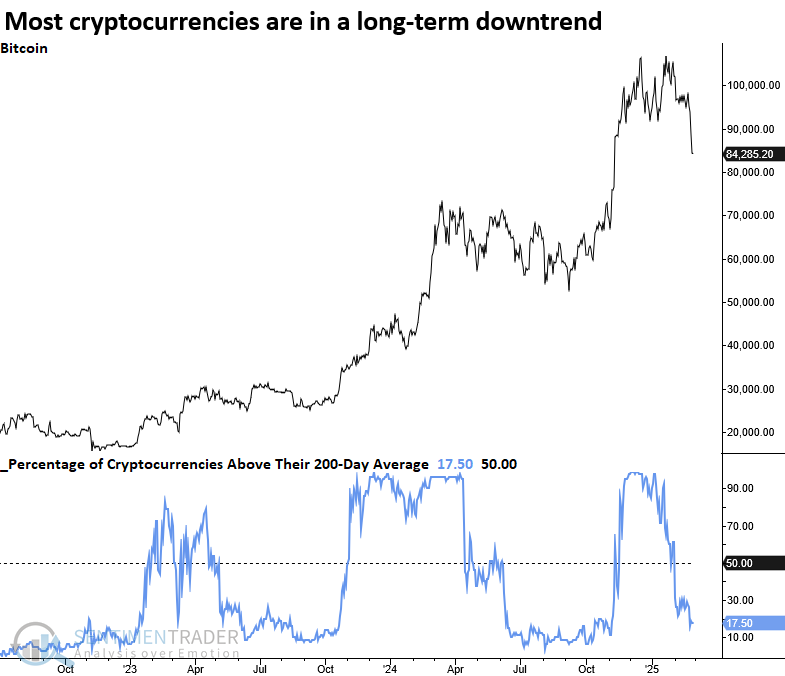
A broad tailwind fades
The programming team has been diligently developing market breadth indicators for the cryptocurrency market. These will soon be added to the website, complementing the trend score indicators as another powerful tool for digital currency analysis.
I plan to review the indicators in the March client webinar.
What the research tells us...
Bitcoin's downside momentum activated a sell signal for a trading system that leverages the Relative Strength Index (RSI) to define bullish and bearish momentum regimes. The decline breached key support, confirming a consolidation breakdown. Consequently, the adverse price action has triggered extreme fear among cryptocurrency traders. Similar precedents suggest that Bitcoin could struggle over a medium-term horizon.
From a big-picture perspective, riskier assets such as digital currencies, small-caps, and technology stocks have been under pressure, indicating that traders are uneasy and hesitant to hold volatile positions.