
A near-record whiplash in new highs

Key points:
- There has been a historically rapid switch in the percentage of securities hitting one-year highs minus lows
- This behavior is evident across major indices and the broader NYSE
- Precedents showed mixed returns over shorter time frames and mostly positive returns over longer ones
A quick switch in one-year extremes
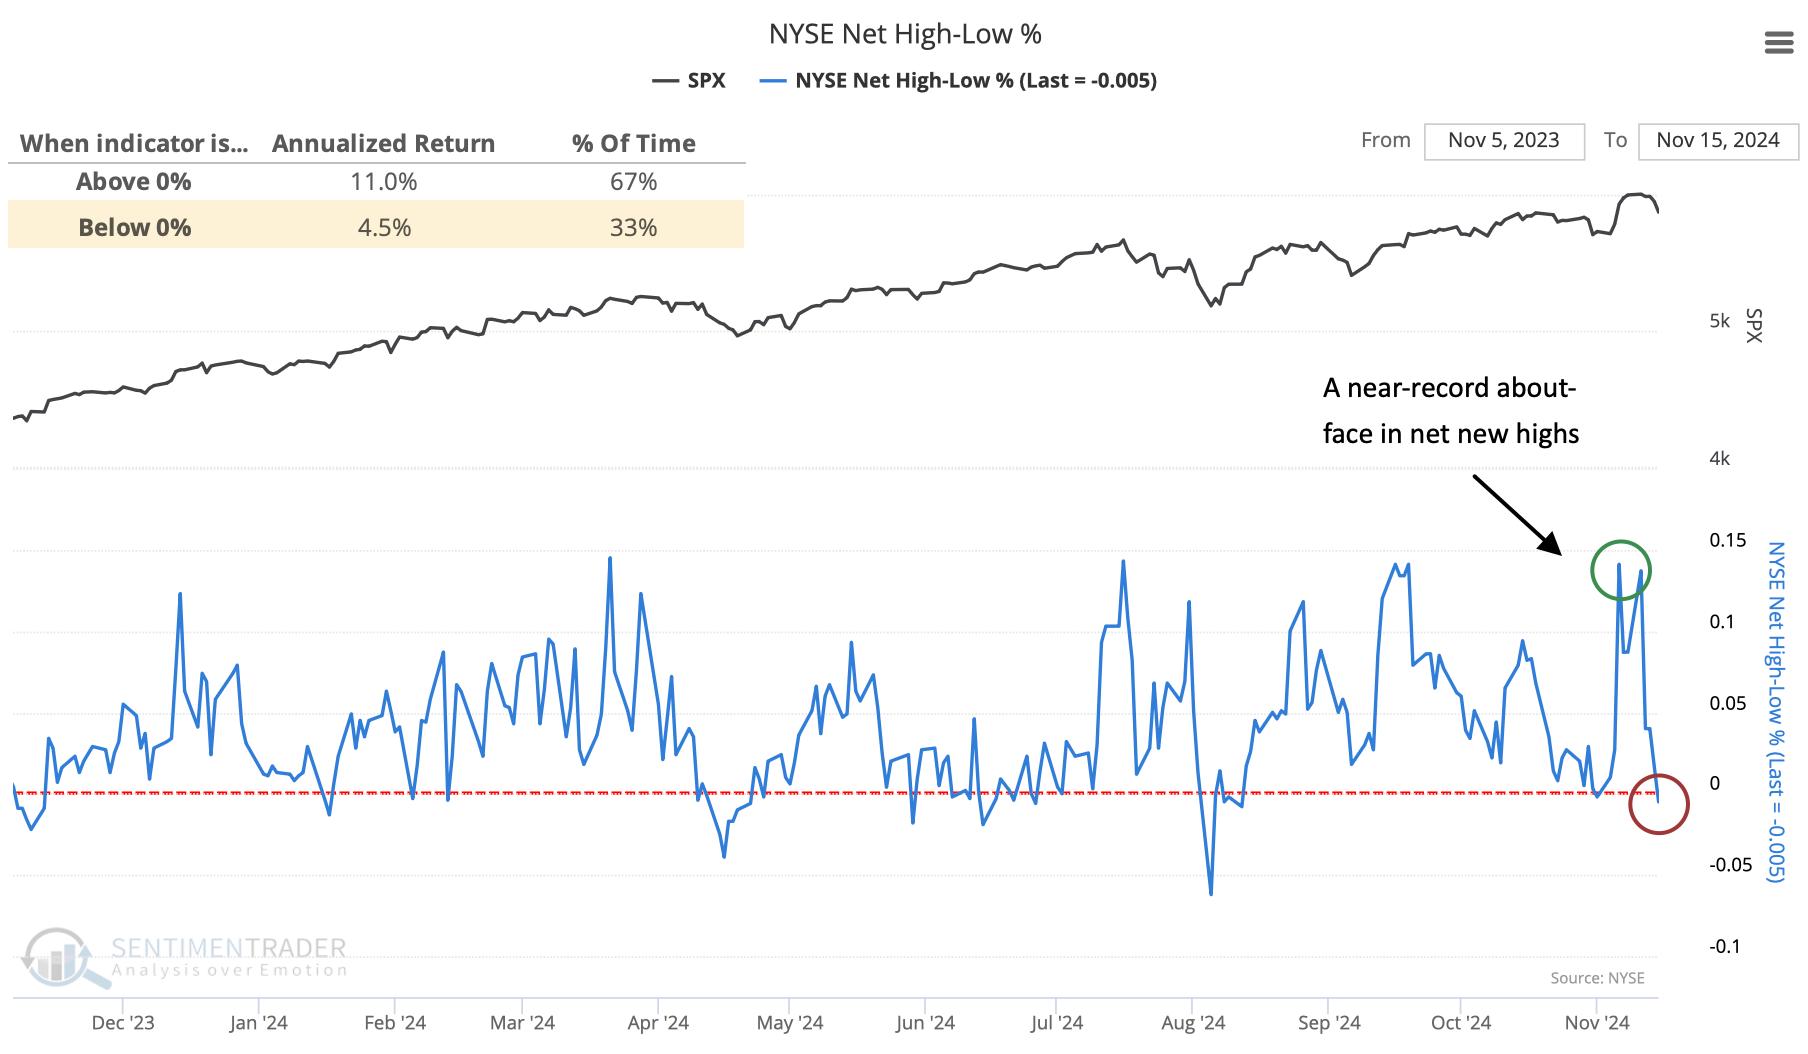
Quite a bit of "stuff" trades on the NYSE, not just common stocks but securities like preferred shares and other lesser-known instruments. The other stuff tends to be more geared toward interest rates, making it useful to watch breadth measures for the whole NYSE universe.
And what an exercise it's been over the past week. In the initial jump after the election results, more than 10% of NYSE issues reached a new 52-week high. That's a healthy number. But markets reversed hard most of the past week, and already more issues are trading at 52-week lows than 52-week highs. That's not a healthy number. The S&P 500 has compounded at a much higher rate when the NYSE net high-low percentage is positive.
Since the pandemic, we've witnessed a few quick reversals in this indicator, each preceded by impressive gains in the months ahead. But those were more the exception than the rule.
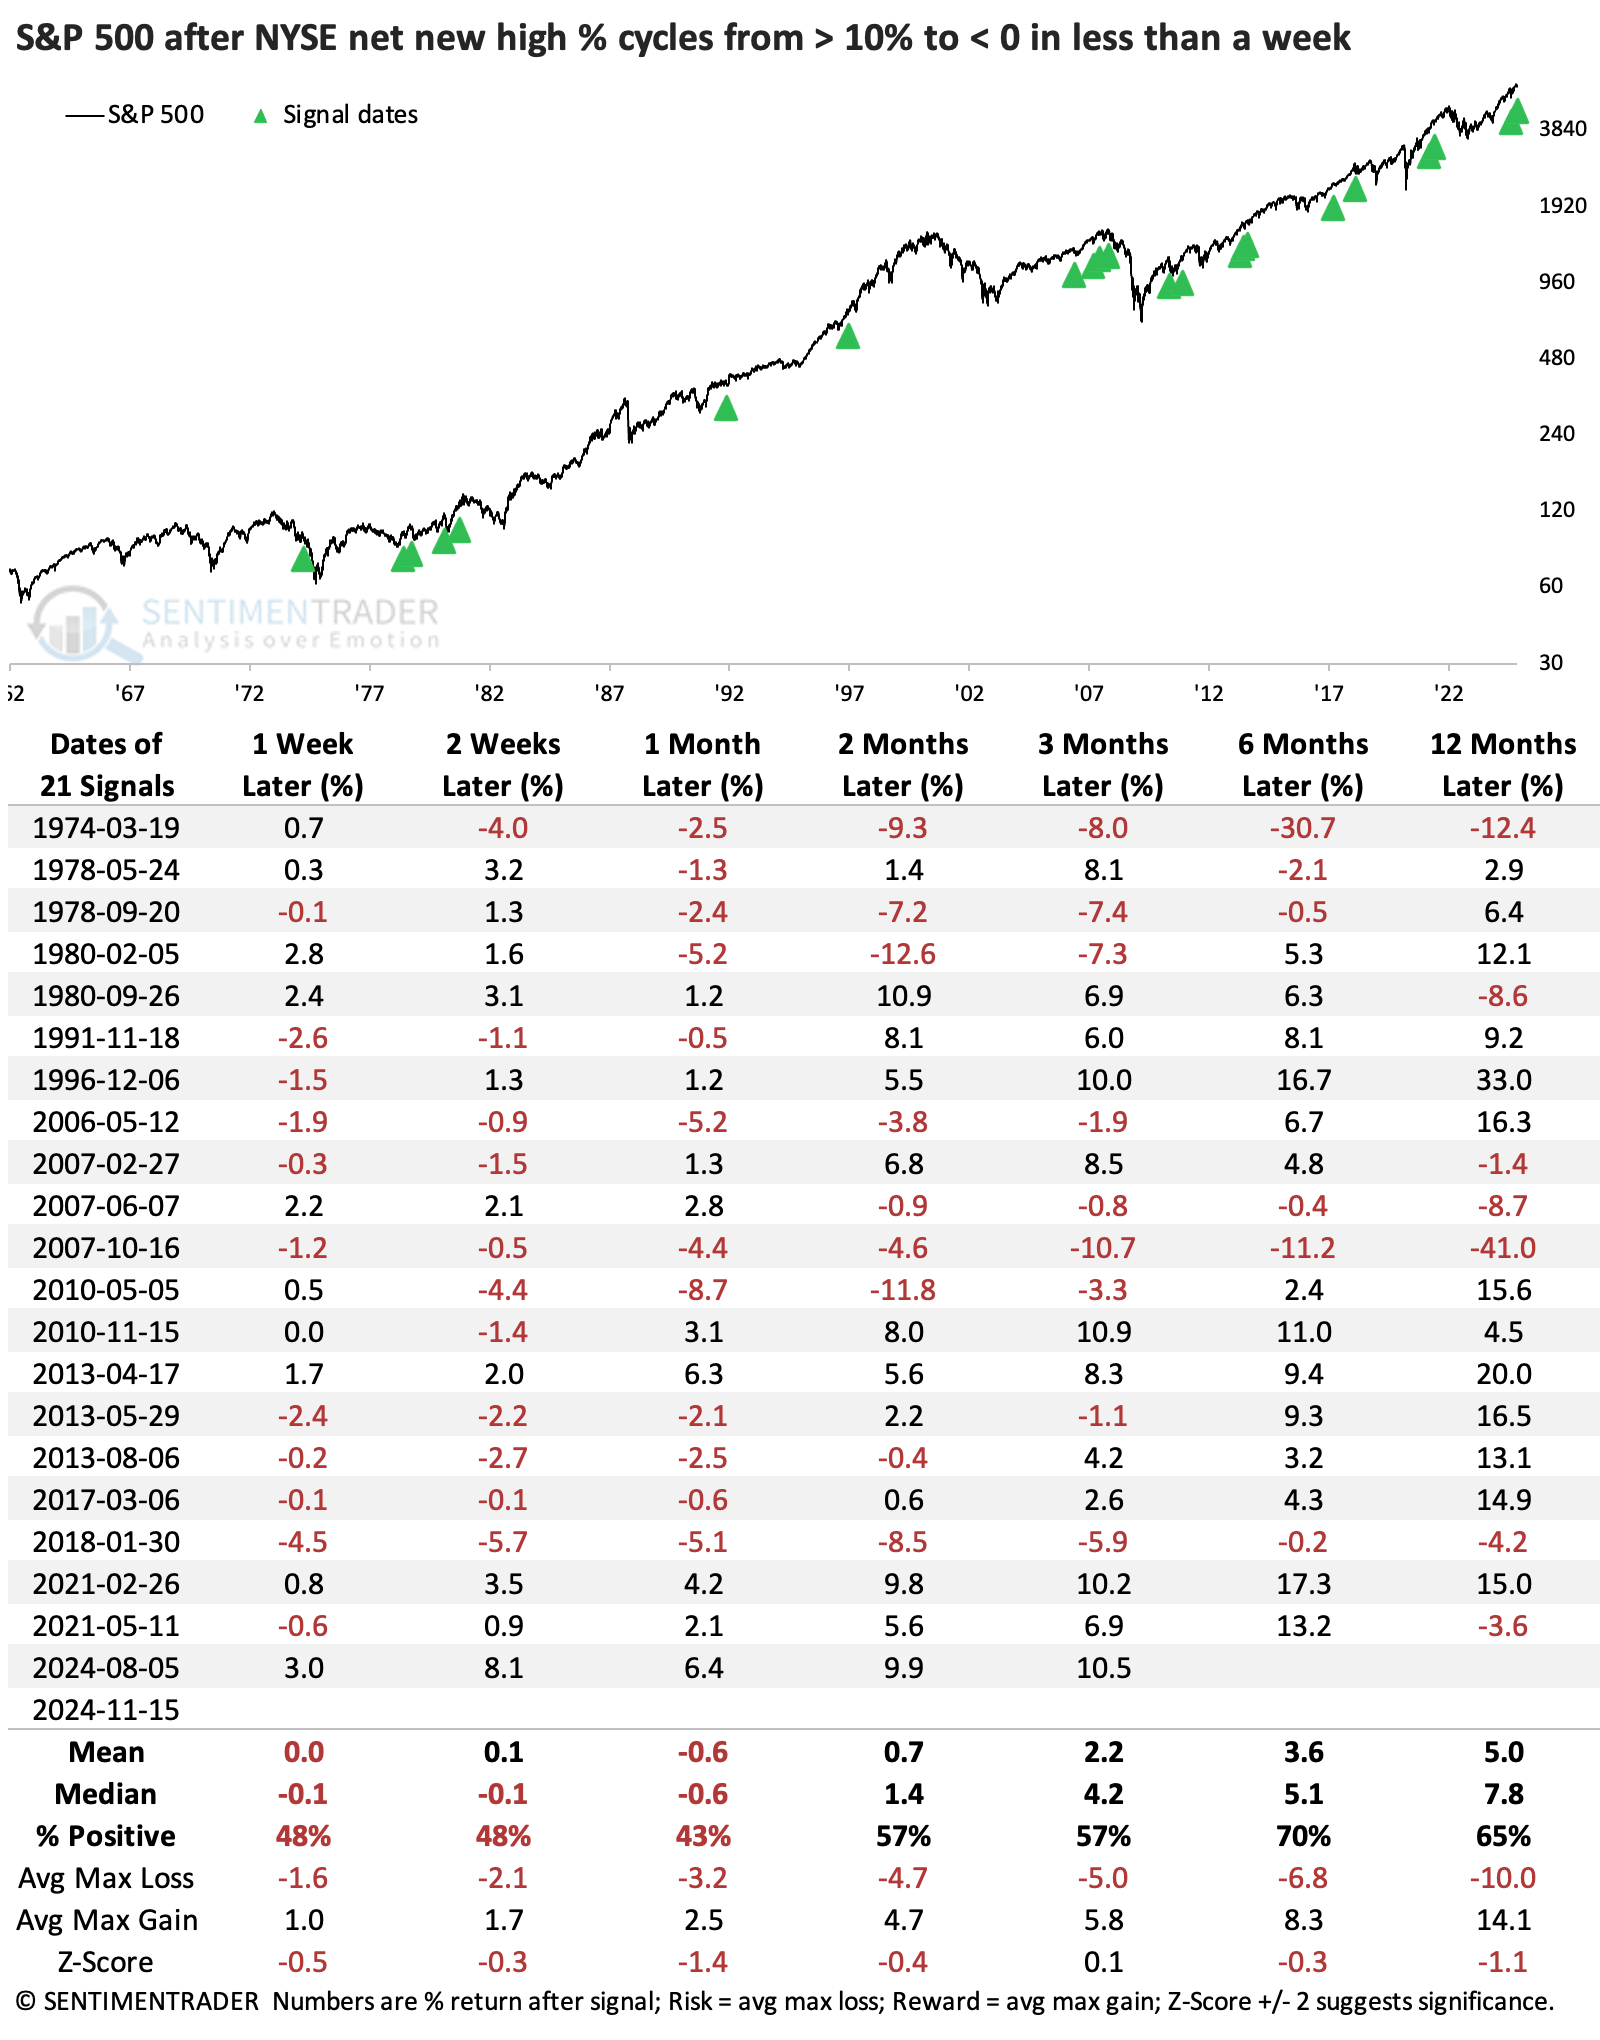
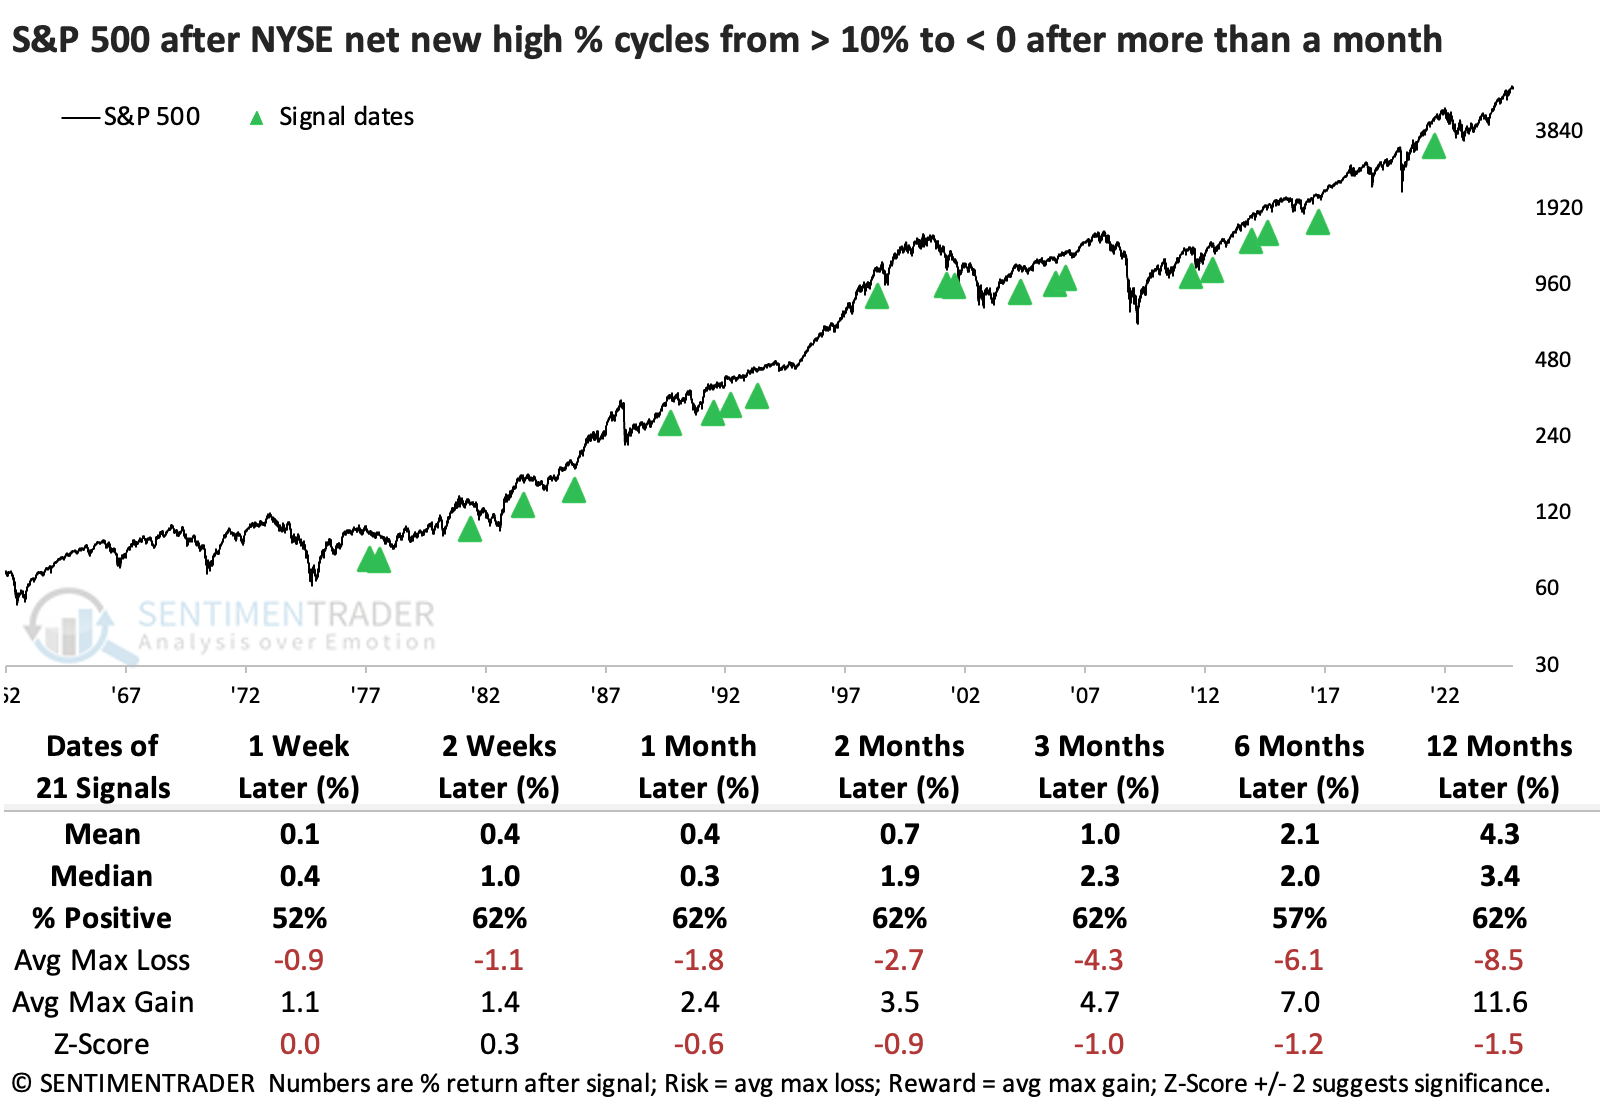
The summary table below shows that the S&P performed better over shorter time frames when investors took longer to push more issues to new lows.
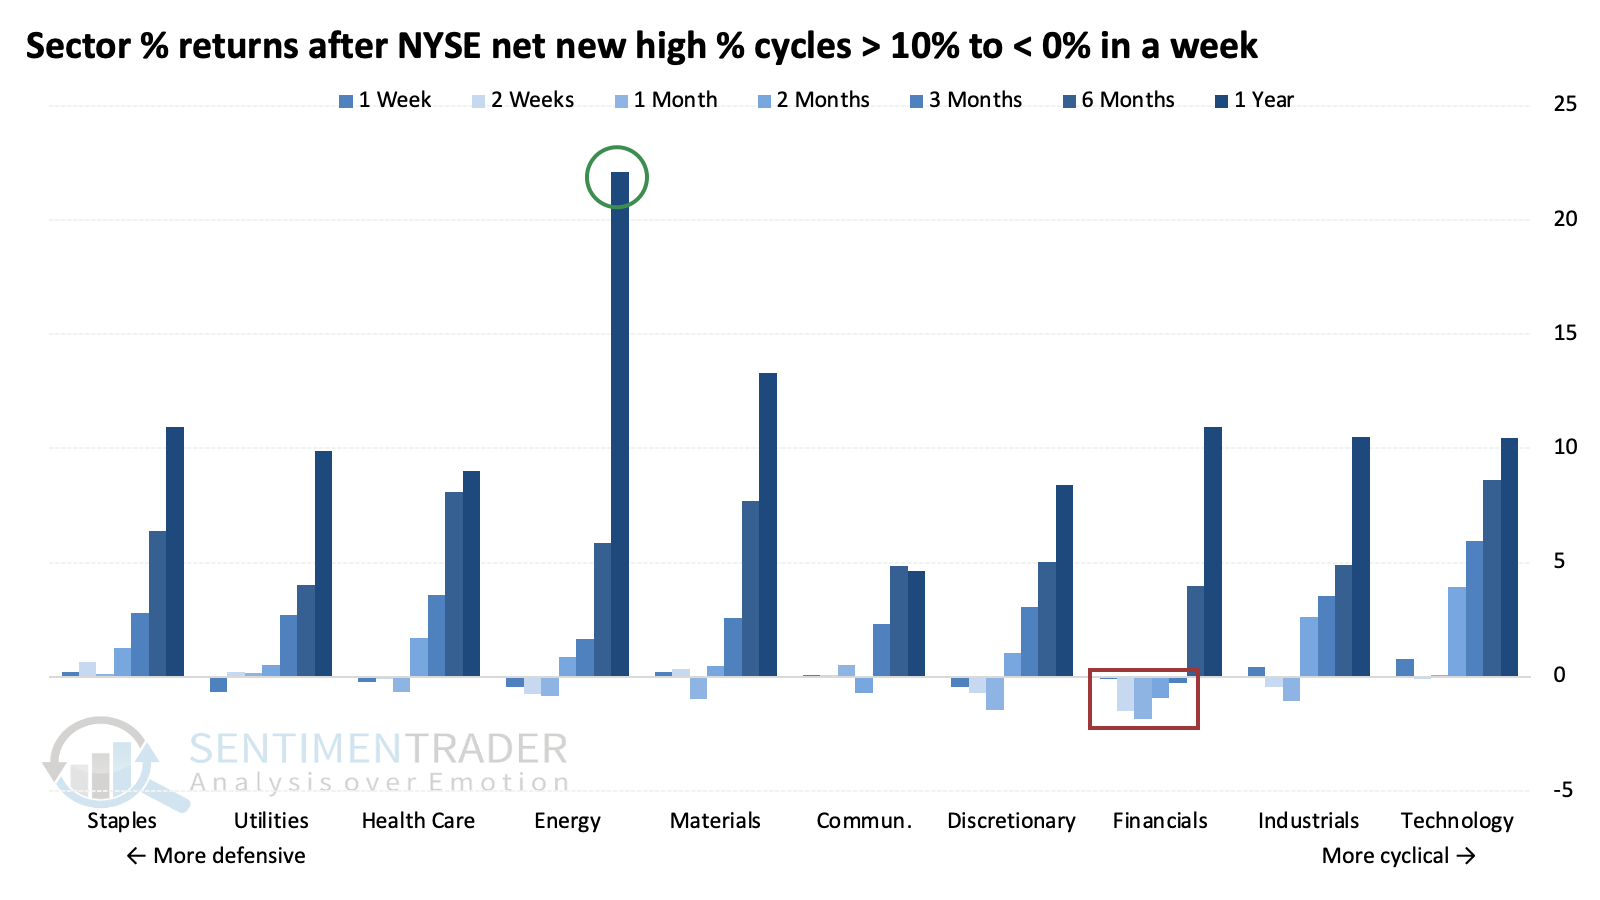
After these signals, there was a modest bias toward more defensive sectors, though it was not a compelling edge either way. Energy stocks showed the best long-term returns, while financials struggled the most over short- to medium-term time frames.
Lest we think that the only reason we've seen such a quick about-face in net new highs is because of some of the weird stuff that's trading on the NYSE, we can look at common stocks only. And when we do that, we see the same phenomenon within the S&P 500, Nasdaq 100, and Russell 2000.
Breadth whiplash across indices
Across all three indices, more than 20% of the stocks had been at 52-week highs within the past week, and now there are more stocks at new lows than new highs. This is a near-record whiplash across all three, dating back to at least 1998.
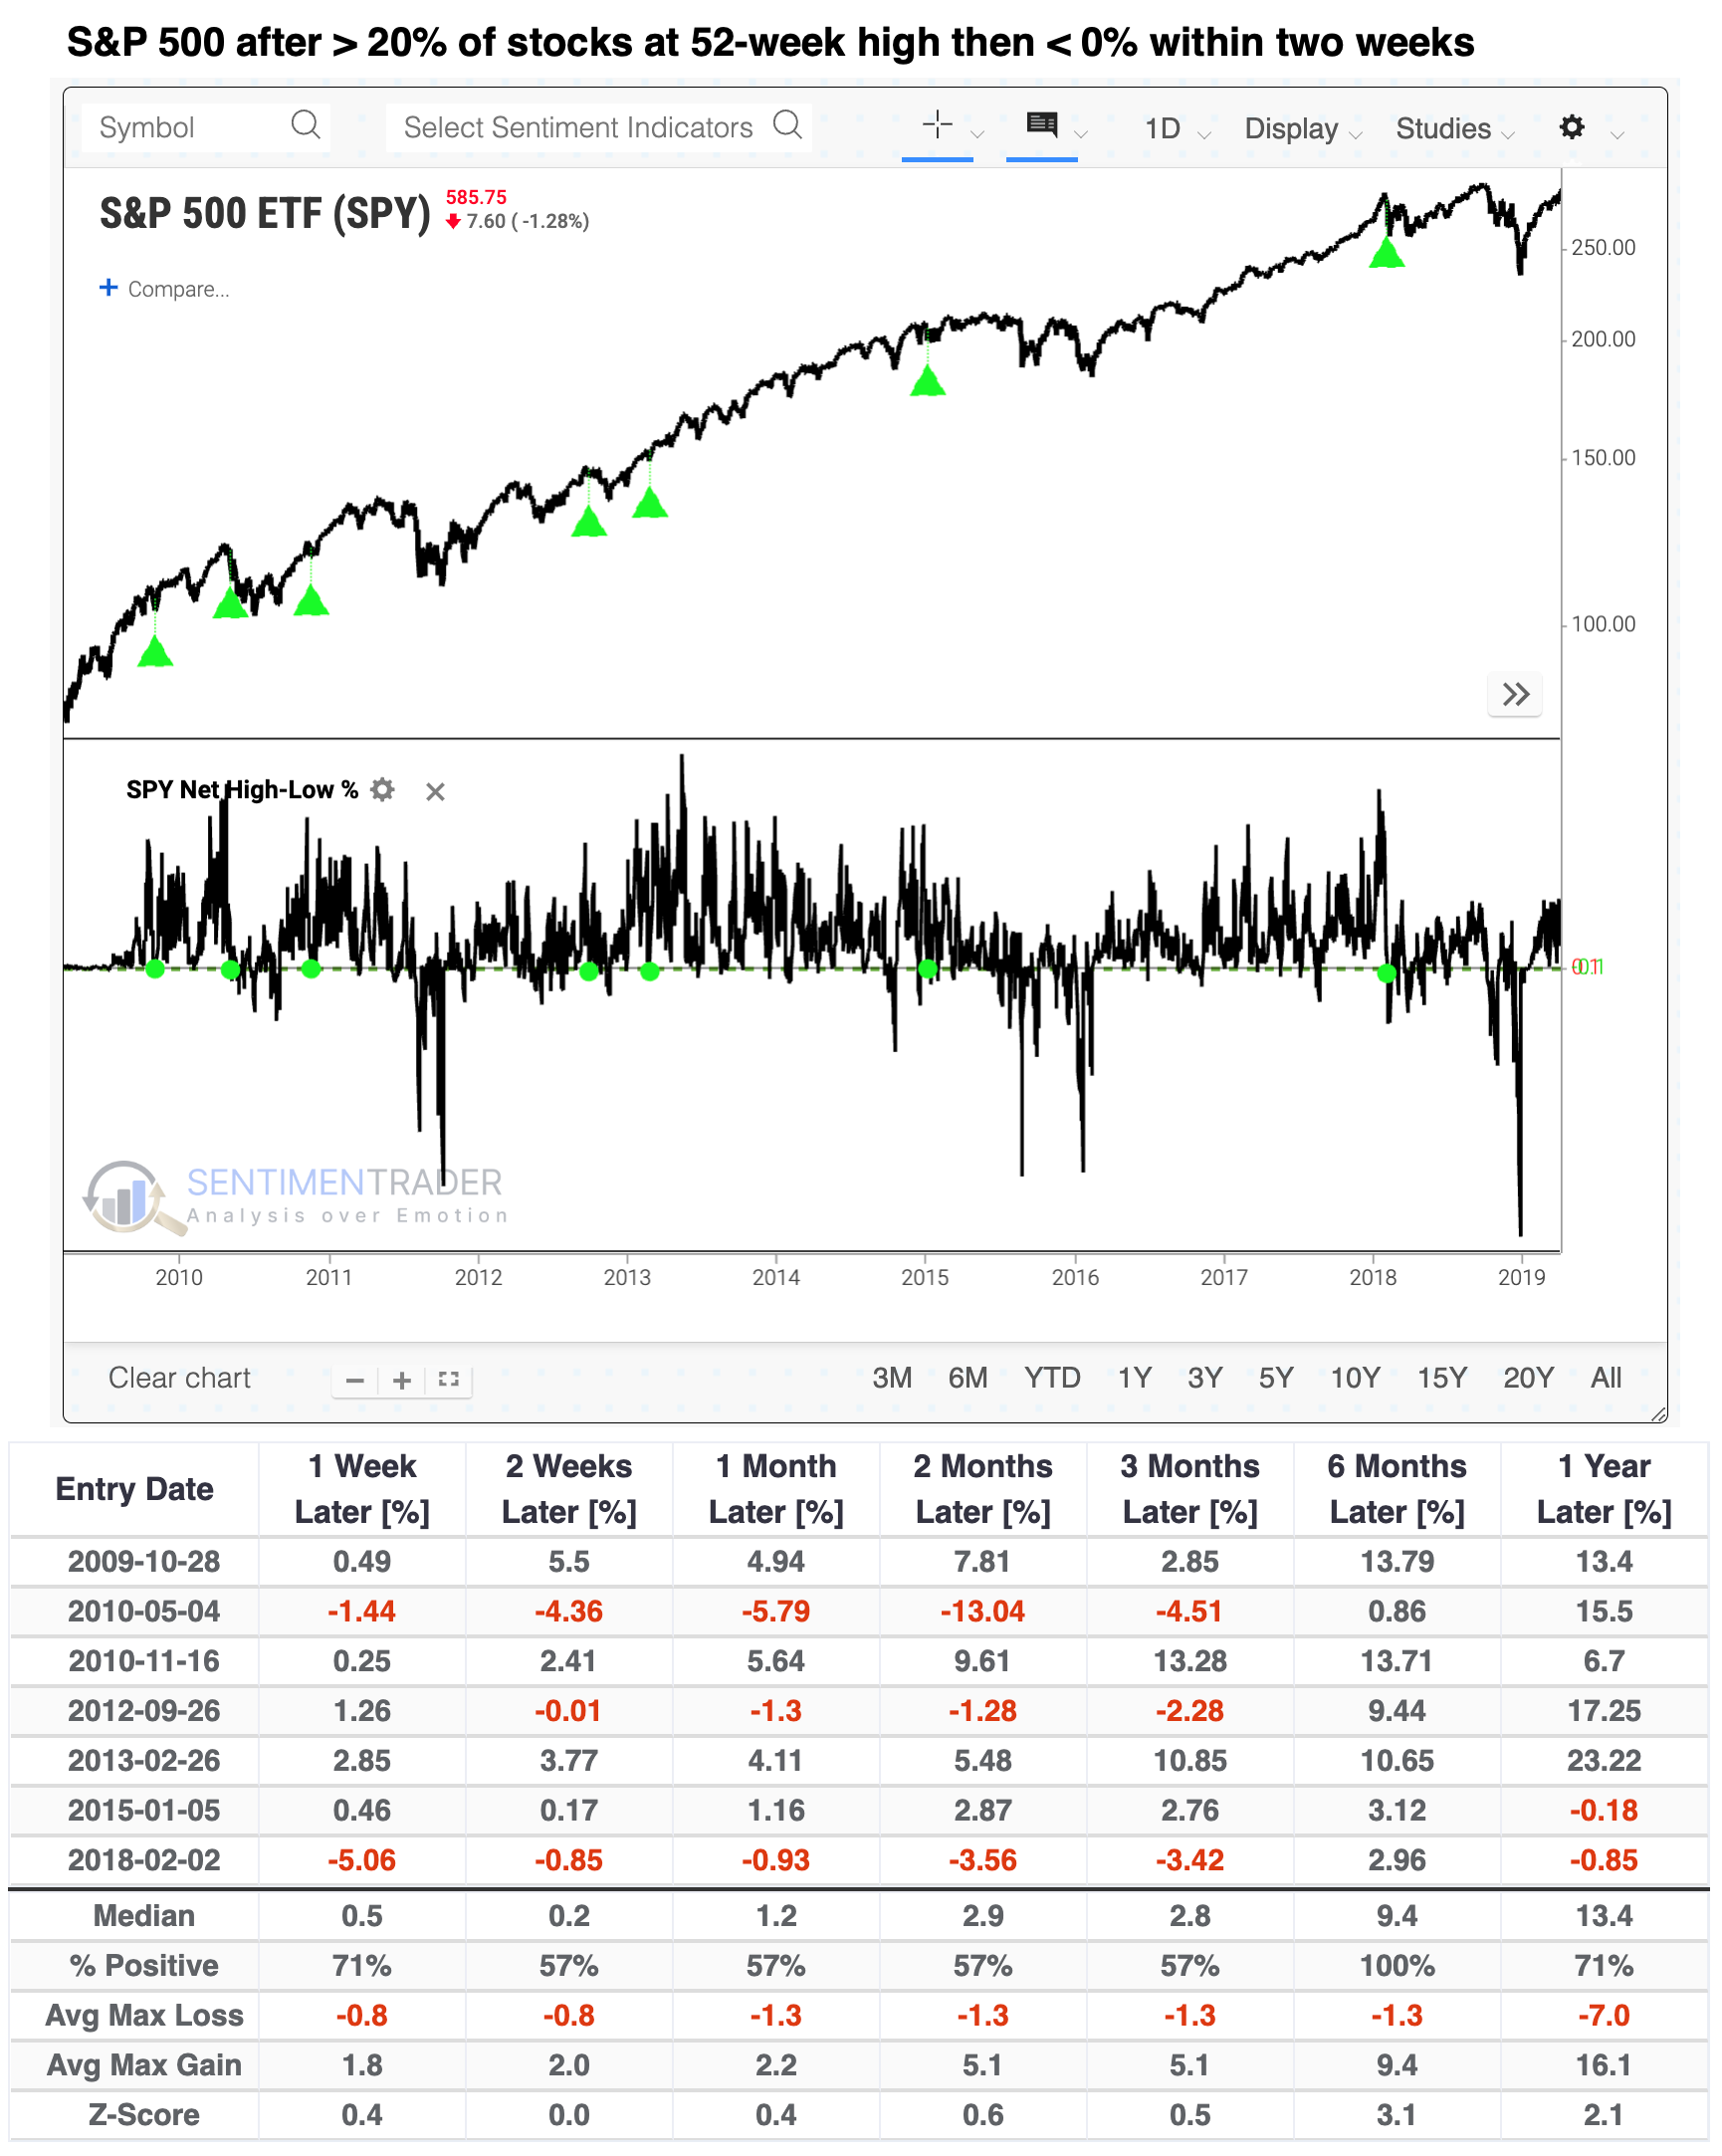
If we focus on the S&P 500 and look for other times when more than 20% of the stocks had been at a new high within the past two weeks (not just the past week), and now there are more new lows than new highs, there were about a half dozen precedents, all during the bull market from 2009 - 2019.
Because these were triggered during that market environment, losses were rare. Two months later, there was one double-digit loss, but all showed gains six months later.
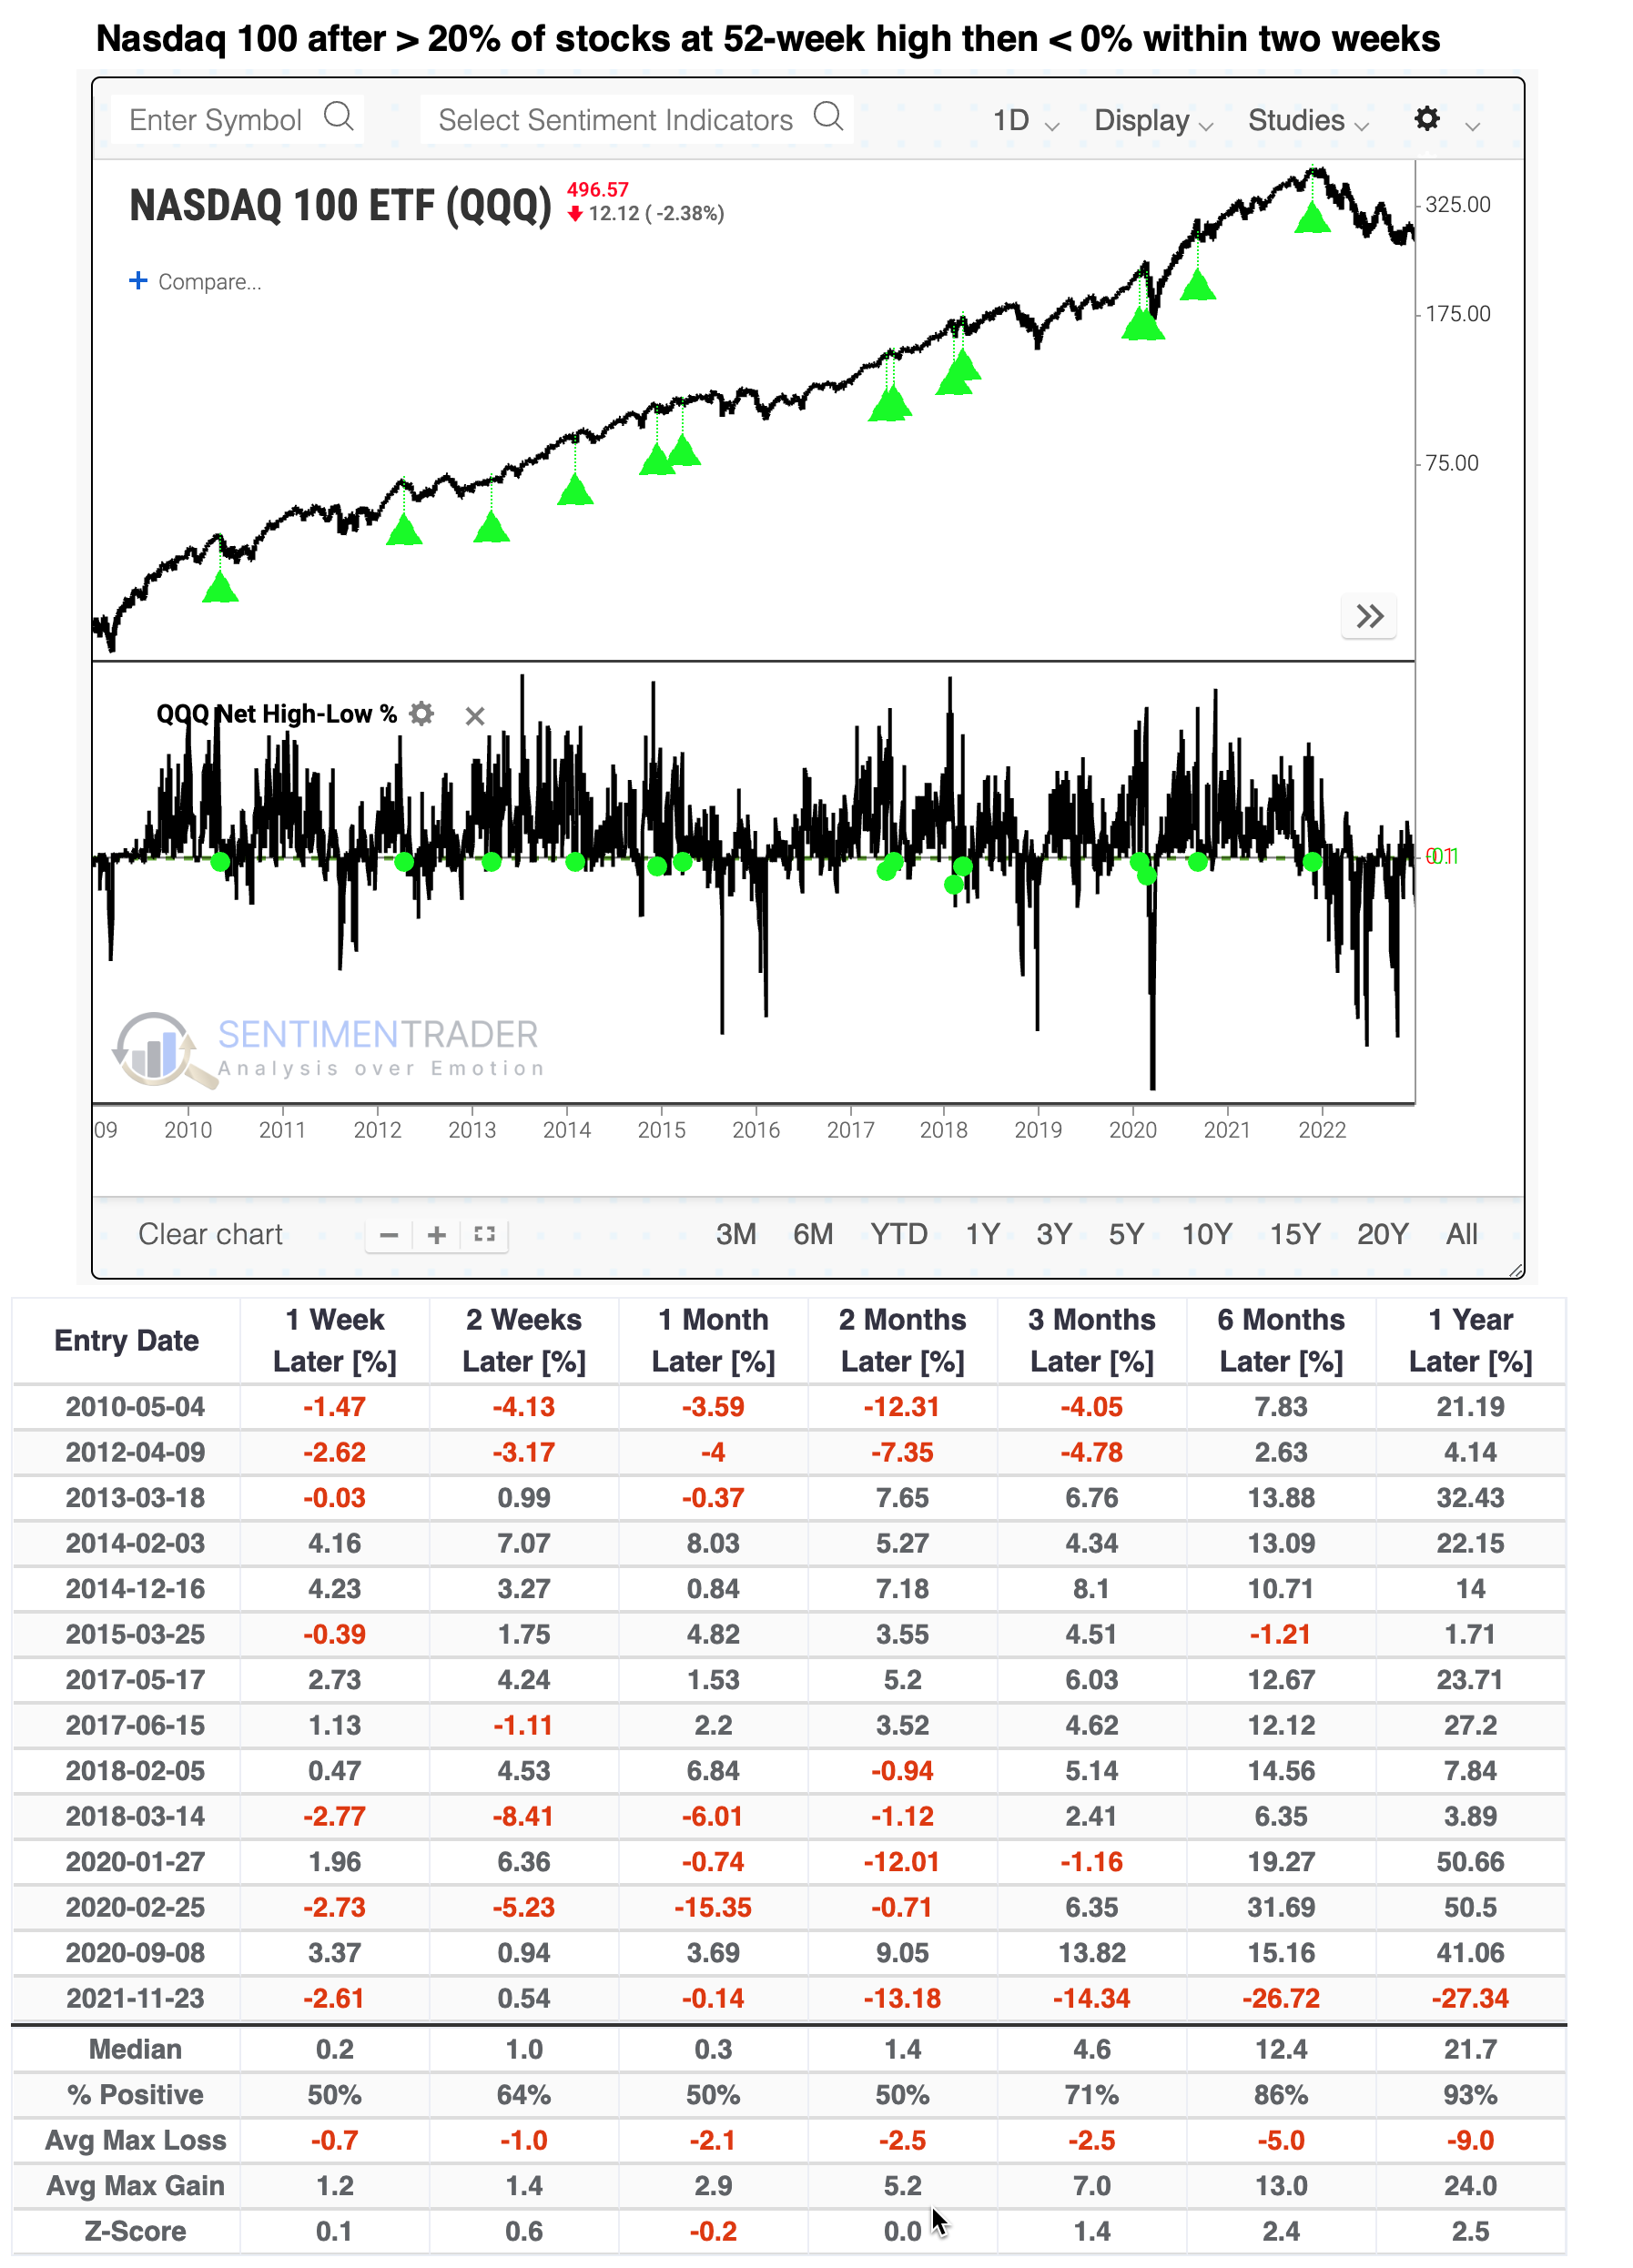
The tech-heavy Nasdaq 100 is more volatile, so there were more signals. Medium-term returns were mixed, but again, they were only triggered during a secular bull market, so longer-term returns were excellent...except for the last signal.
This has been an exceptionally rare occurrence among small-cap stocks. On the Russell 2000, there were only two precedents. The first saw ugly losses over the short term, and the second saw ugly losses long-term.
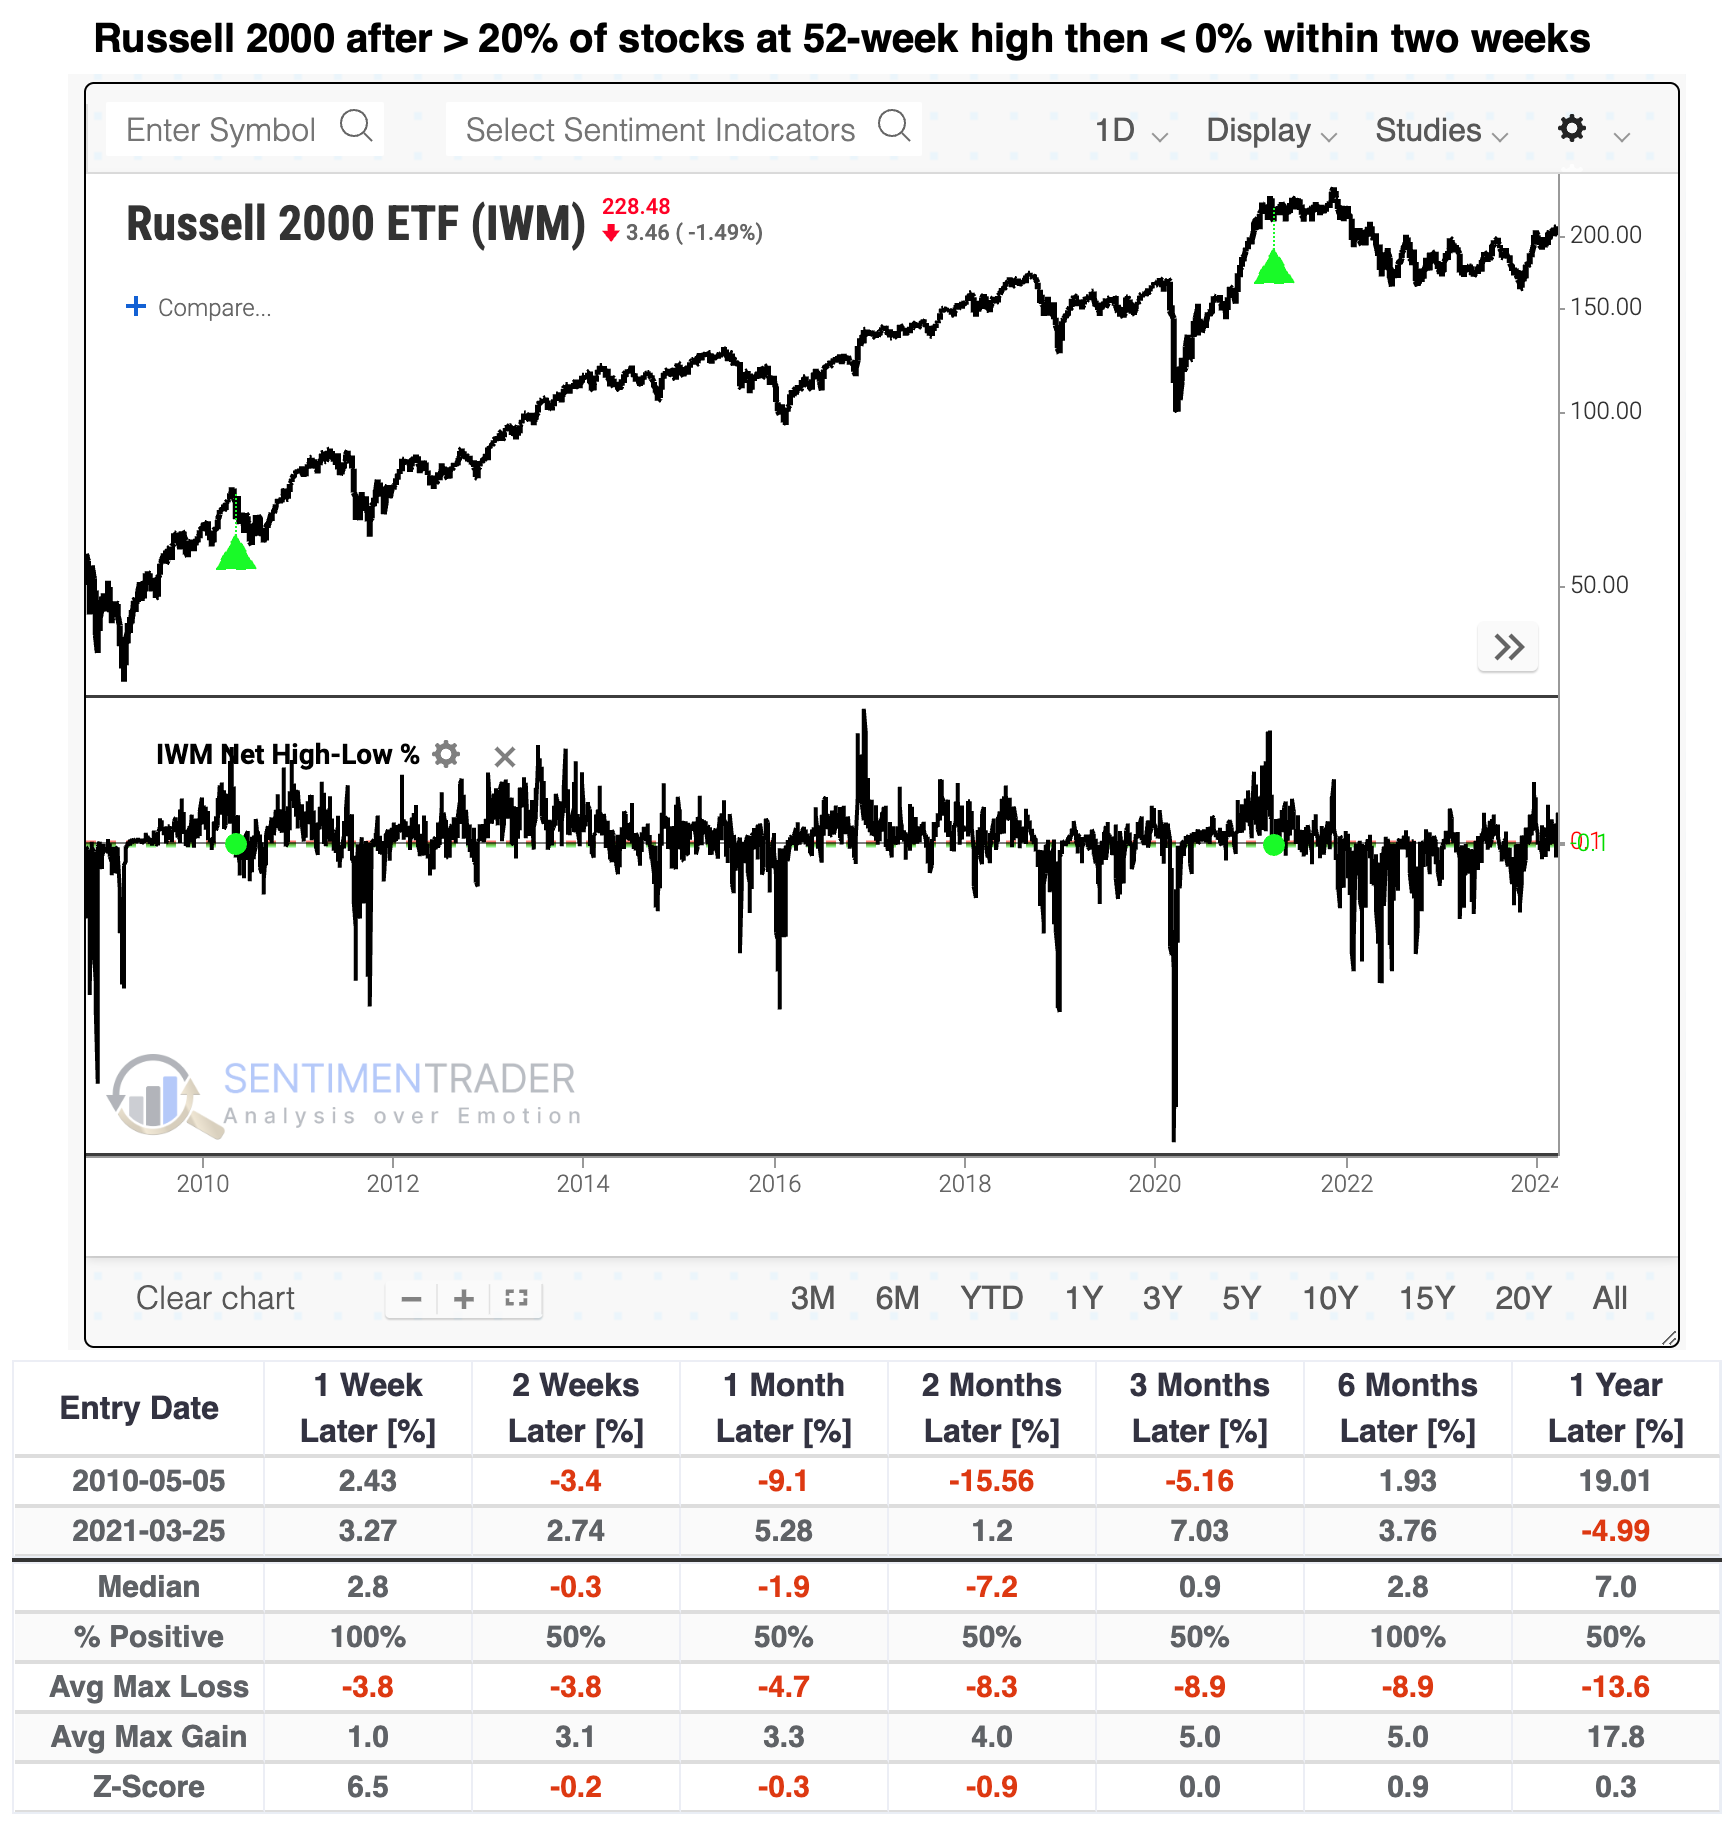
The only time when all three indices saw this kind of new-high-to-new-low whiplash was in early May 2010, which was not a pleasant time to bet on a rebound because all three saw heavy losses through July. But that's a sample size of one, so it's hard to put much weight on it.
What the research tells us...
The fact that more stocks and other securities are falling to 52-week lows than reaching 52-week highs is a bad sign. There is no other way to spin it unless we were at a point where the difference was so overwhelming that we could make a case that the selling pressure is overdone, and we're far from that point.
Context matters and one piece of context now is that the new lows are occurring exceptionally soon after many other stocks have been at new highs. This is highly unusual behavior, and it's spread across the equity universe. The only precedent is May 2010, which ushered in months of further selling pressure. On an index-by-index level, though, the precedents were less problematic, and because they only occurred during a secular bull market, any further selling pressure was a good opportunity to add exposure at more attractive prices.