
A monthly sentiment gauge crossed an important threshold

Key points
- Consumer Confidence regarding investor expectations for stocks in the year ahead just crossed a significant threshold
- This signal - though infrequent - has tended to portend favorable stock market action
- Tangentially, results have not been good for t-bonds
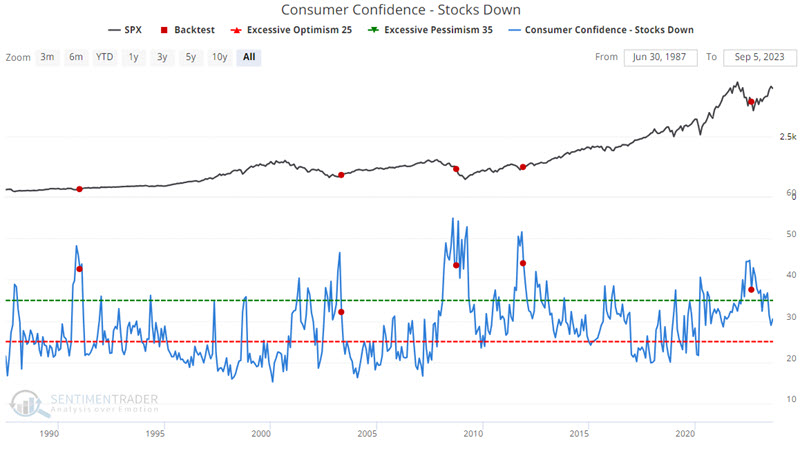
A closer look at the Consumer Confidence Stocks - Down indicator
The Consumer Confidence Stocks - Down indicator is a monthly indicator that shows the net percentage of consumers expecting stocks to decrease, according to a monthly survey from the Conference Board. Like many sentiment indicators, it is ostensibly a contrarian indicator. High readings as the masses become overly bearish - and reversals from high readings - tend to be bullish for stocks.
The chart below displays those times when this monthly index crossed below 44% for the first time in 12 months.
The tables below display subsequent S&P 500 performance.
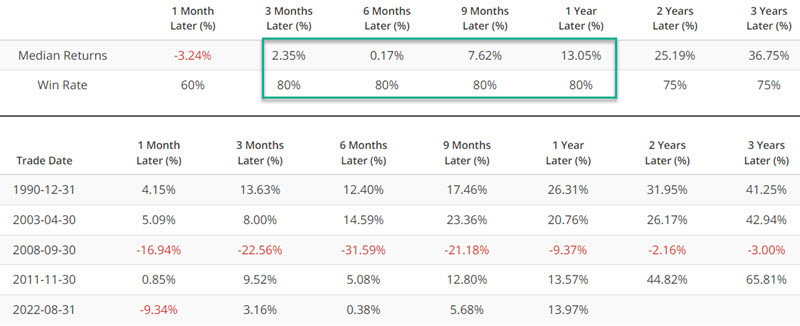
The last signal occurred at the end of August 2022. In the subsequent 12 months, the S&P 500 has gained almost 14%. Not many people were expecting double-digit returns in the year ahead back in August 2022. One concern is the small sample size. However, in this case, that is just the nature of monthly surveys that only matter when they reach an extreme - and/or when they reverse from an extreme. It is simply a rare occurrence.
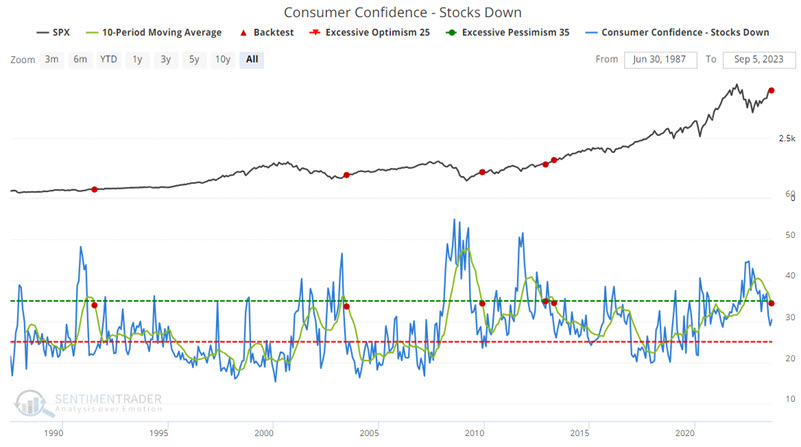
The Consumer Confidence Stocks - Down indicator crosses another notable threshold
Most market participants are familiar with the tendency for extremes in investor sentiment to mark important turning points in the stock market. Many people miss the fact that many of these indicators can also be used as a trend-following or confirmation tool.
Typically, when the stock market reaches a bearish extreme, so too does investor sentiment. Many investors remain wary as the market forms a bottom and rallies initially. Eventually, the market looks good enough that a large segment of that formerly bearish investor contingent changes their tune. As they start moving back into the market en masse, they can provide a steady source of buying power to propel a continued bull market. The Consumer Confidence Stocks - Down indicator falls into this category.
The chart below displays those times when the 10-month moving average of this indicator (the green line in the chart below) crossed below 35%. The most recent signal occurred on 2023-08-31.
The table below displays subsequent S&P 500 performance.
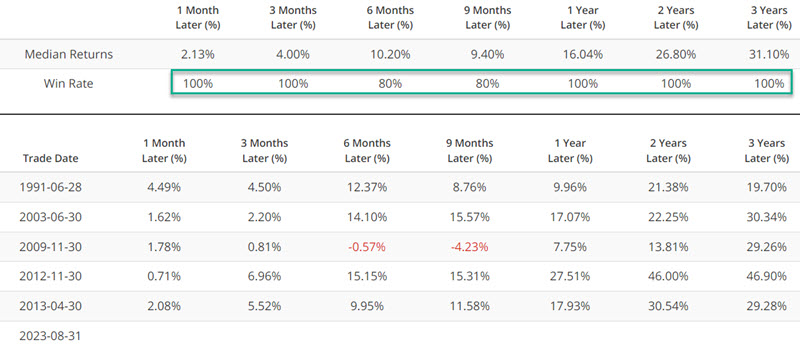
As always, it is essential to note that past results do not guarantee future results. No investor should look at the results above and assume it is smooth sailing for the next three years. Nevertheless, the recent signal does fall on the favorable side of the weight of the evidence ledger.
A side note regarding treasury bonds
This may not be a direct result of cause and effect, but it is worth noting that treasury bond performance has been notably unfavorable following the signal for stocks shown above.
The chart below displays those times when the 10-month moving average of the Consumer Confidence Stocks - Down indicator crossed below 35% versus thirty-year treasuries.
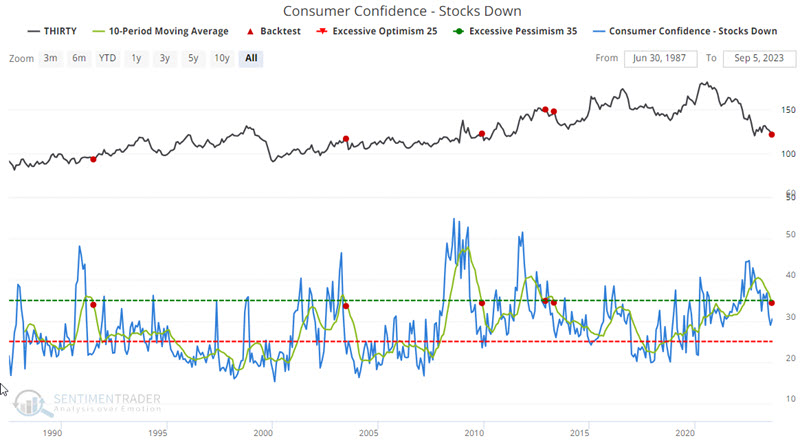
The tables below display subsequent thirty-year treasury bond performance.
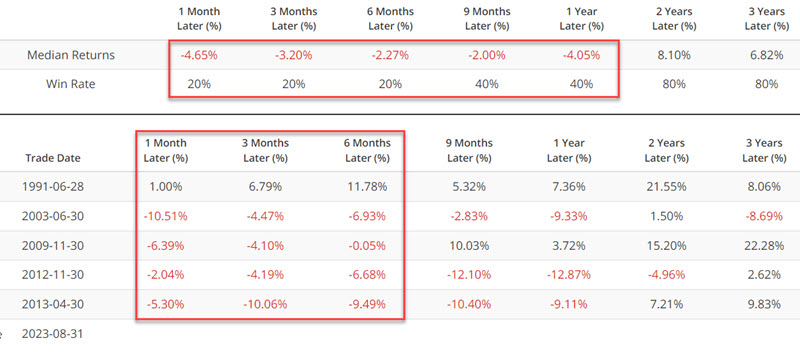
Once again, we are discussing a tiny sample size for an indicator based on an entirely different market. When combined with the fact that t-bonds have already endured a 3+ year bear market - and are now threatening to form a double bottom if recent lows can hold - it is perfectly acceptable for an individual to reject that the results above are meaningful for t-bonds in the here and now.
But the historical results are what they are and generally fall on the negative side of the ledger for t-bonds over one year.
What the research tells us…
Many pundits are presently lamenting that sentiment appears to be swinging to the bullish side. What they may be missing is that more bulls are necessary to sustain a bull market.