Products
SentimenTrader Trading Tools
‍
Backtest Engine
My Trading Toolkit
Correlation Analysis
Seasonality
Indicators & Data API
‍
Proprietary Indicators & Charts
Market Data API
Strategies & Scanner
‍
50+ Trading Strategies
Smart Stock Scanner
Research Reports
‍
Research Solutions
Reports Library
Free Resources
Simple Backtest Calculator
Simple Seasonality Calculator
The Kelly Criterion Calculator
Sentiment Geo Map
Public Research Reports
Education
Sentiment Indicators
Technical Indicators
Pricing
Company
About
In the News
Testimonials
Client Success Stories
Contact
Log inLoginSign up
< BACK TO ALL REPORTS

A massive surge in the Macro Index Model

Dean Christians
2023-03-03
The Macro Index Model surged by one of the most significant amounts in history on a month-over-month basis. After similar increases, stocks and a commodity index benefited from a jump in economic activity, while gold faltered.

Key points:

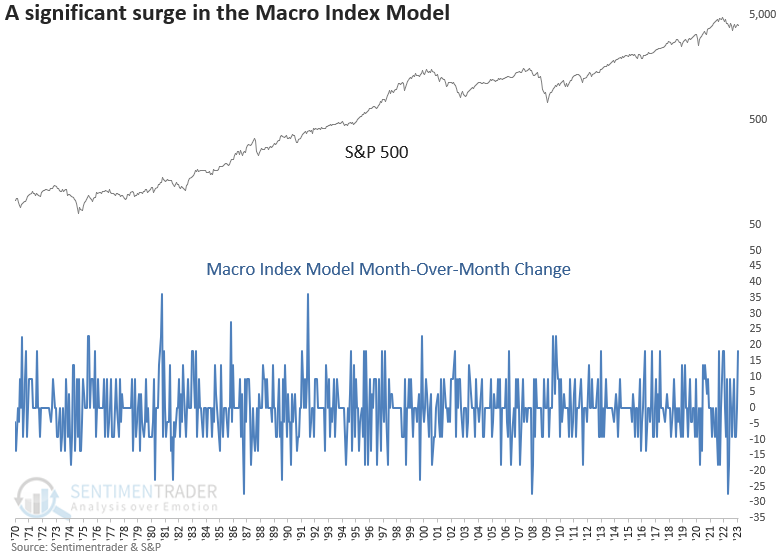
  • The Macro Index Model increased by over 18% on a month-over-month basis
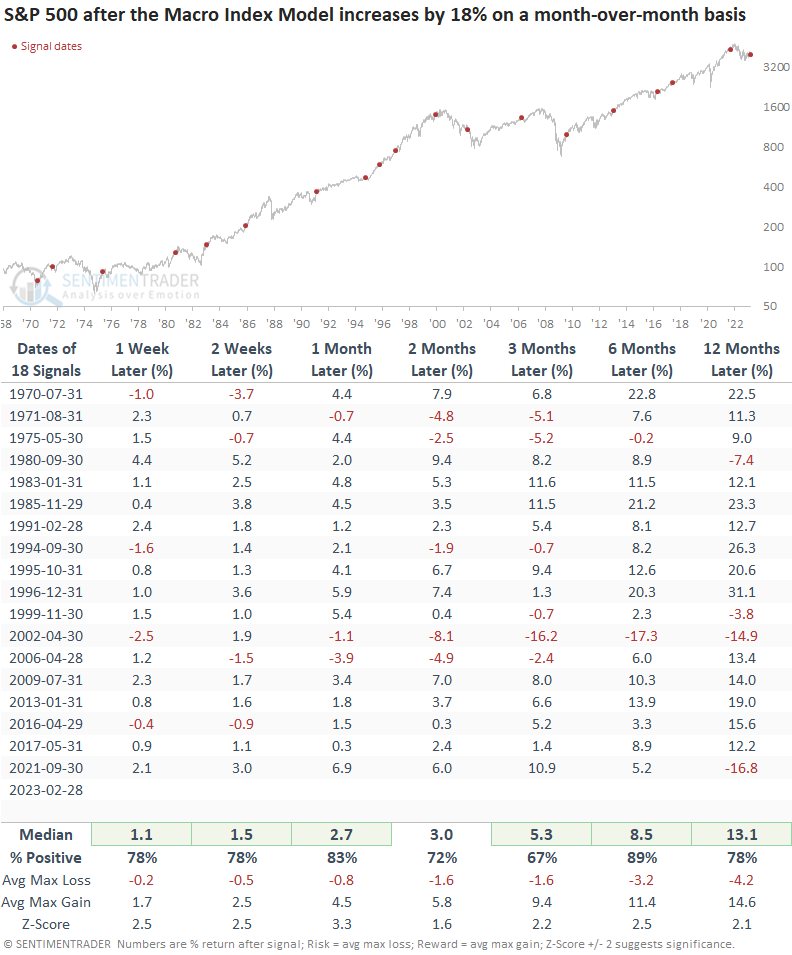
  • After similar surges, stocks showed a consistent upward bias
  • A commodity index tends to rally, gold falters, and the 10-year yield is mixed

A diverse macroeconomic composite jumps by a significant amount

After falling to the lowest level in over a decade, the Macro Index Model, a composite consisting of 11 diverse economic indicators to determine the state of the U.S. economy, surged by more than 18% month-over-month. 

While the MIM remains well below the favorable threshold of 70%, significant month-over-month surges like now tend to ignite a turning point for economic conditions that benefit stocks. 

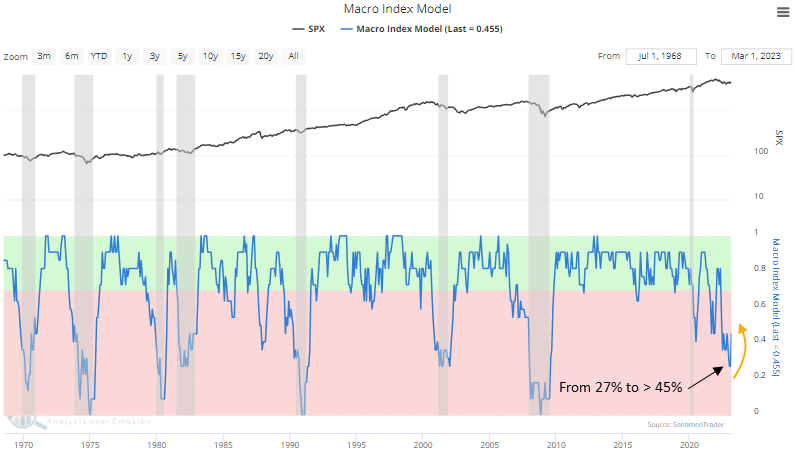
Most MIM month-over-month increases of 18% or more occurred when the S&P 500 turned up from a growth-scare correction or economic contraction.

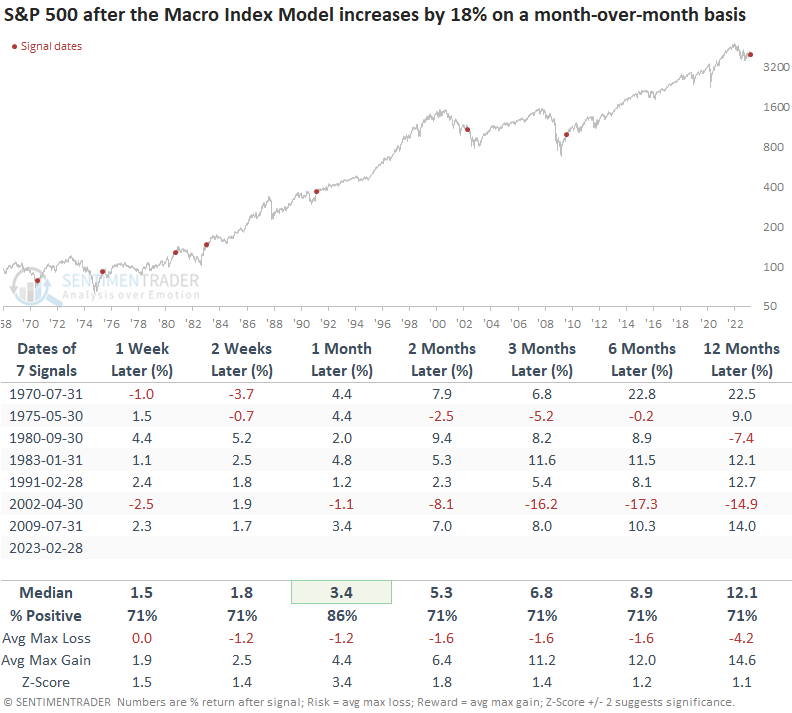
Month-over-month surges in the Macro Index Model preceded positive results for stocks

When the Macro Index Model increases on a month-over-month basis by 18% or more, the S&P 500 responds with a bullish outcome. Returns, win rates, and z-scores look excellent across all time frames. 

The only significant failure occurred in 2002. Interestingly, the MIM continued to rise as stocks declined in the final leg lower of a multi-year bear market.

I screened out repeats by identifying the first signal in a year.

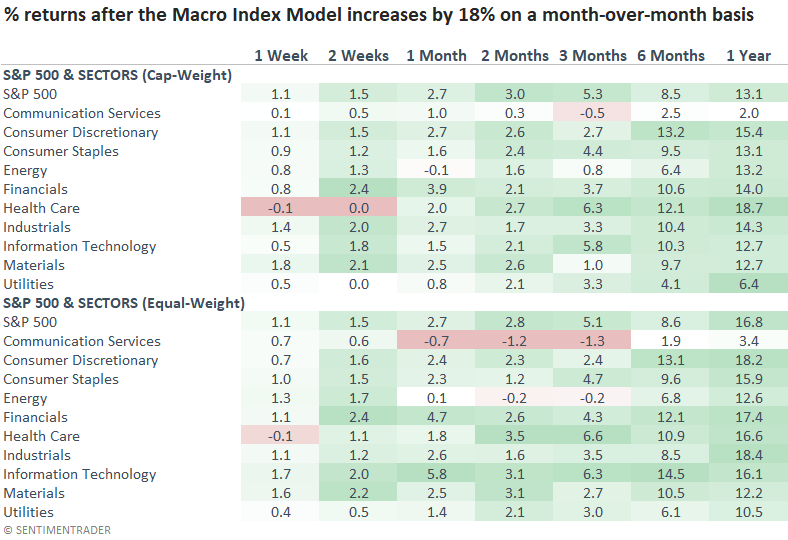
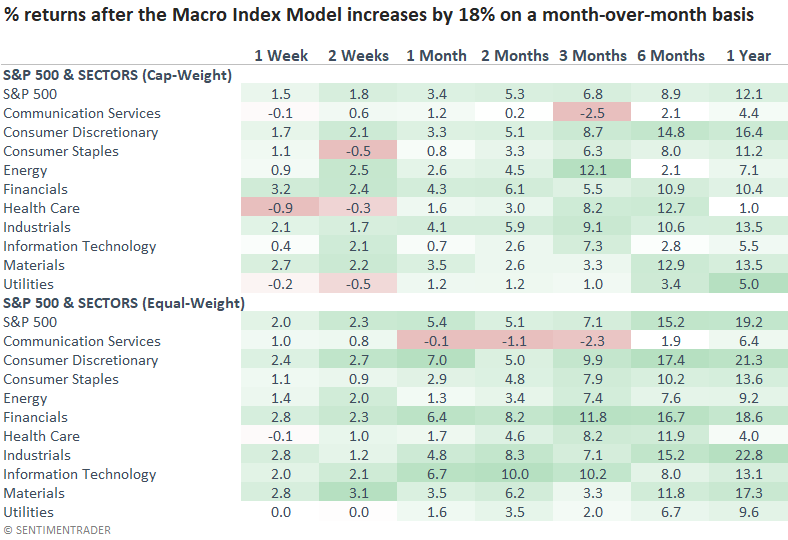
From a sector perspective, Consumer Discretionary and Industrials tend to perform well over the next year, which aligns with current relative strength trends. 
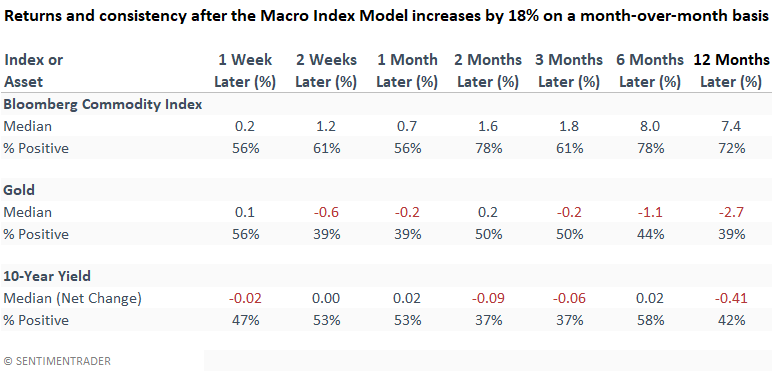
Other asset classes

When I apply the signals to other asset classes, commodities, like stocks, tend to benefit from a jump in economic activity. However, the same can't be said for gold, as the metal is more likely to falter. The net change and win rates in the 10-year yield are a mixed bag.

Significant month-over-month increases from a low starting point

Let's isolate when the month-over-month change in the Macro Index Model increases by 18% or more after the composite falls below 30%, which is the case now. 

Significant surges from a starting point typically associated with an economic contraction provide bullish returns similar to the outlook for all signals. Win rates and z-scores are slightly less bullish but still impressive. 

Not surprisingly, early cycle sectors like Consumer Discretionary and Industrials outperform, which is even more pronounced for equal-weighted index returns. 
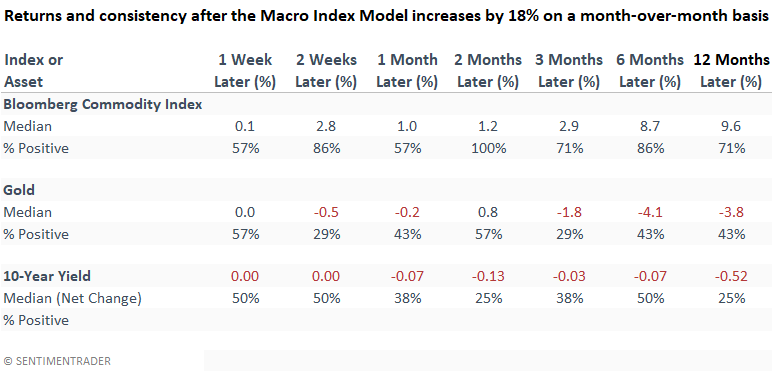
Other asset classes

Returns and consistency for the Bloomberg commodity index and gold look similar to the original study. However, after the Macro Index Model declined below 30%, the 10-year yield tended to ease.

What the research tells us...

The Macro Index Model surged on a month-over-month basis. Except for one instance in 2002, similar increases benefited stocks, especially cyclical sectors. While the renewed strength in economic activity is bullish for a basket of commodities, one can't say the same for a safe-haven asset like gold. With no meaningful edge in long-duration bonds, I would stick with a T-Bill yielding 5%.

Sorry, you don't have access to this report

Upgrade your subscription plan to get access
Go to Dasboard
PRODUCTS
SentimenTrader
Trading Tools
Indicators & Data API
‍
Strategies & Scanner
‍
Research Reports
FREE
RESOUrCES
Simple Backtest
Calculator
Simple Seasonality
Calculator
The Kelly Criterion
Calculator
Sentiment Geo Map
‍
Public Research Reports
‍
Education
Sentiment Indicators
‍
Technical Indicators
‍
Pricing
Bundle pricing
‍
FAQ
‍
Announcements
‍
COMPANY
‍
About
‍
In the News
‍
Testimonials
‍
Client Success Stories
CONTACT
‍
General Inquiries
‍
Media Inquiries
‍
Financial Professionals Inquiries
‍
© 2026 Sundial Capital Research Inc. All rights reserved.
Setsail Marketing
TermsPrivacyAffiliate Program
Risk Disclosure: Futures and forex trading contains substantial risk and is not for every investor. An investor could potentially lose all or more than the initial investment. Risk capital is money that can be lost without jeopardizing ones’ financial security or life style. Only risk capital should be used for trading and only those with sufficient risk capital should consider trading. Past performance is not necessarily indicative of future results.

Hypothetical Performance Disclosure: Hypothetical performance results have many inherent limitations, some of which are described below. No representation is being made that any account will or is likely to achieve profits or losses similar to those shown; in fact, there are frequently sharp differences between hypothetical performance results and the actual results subsequently achieved by any particular trading program. One of the limitations of hypothetical performance results is that they are generally prepared with the benefit of hindsight. In addition, hypothetical trading does not involve financial risk, and no hypothetical trading record can completely account for the impact of financial risk of actual trading. for example, the ability to withstand losses or to adhere to a particular trading program in spite of trading losses are material points which can also adversely affect actual trading results. There are numerous other factors related to the markets in general or to the implementation of any specific trading program which cannot be fully accounted for in the preparation of hypothetical performance results and all which can adversely affect trading results.

Testimonial Disclosure: Testimonials appearing on this website may not be representative of other clients or customers and is not a guarantee of future performance or success.