
A massive number of breakouts in the Technology sector

Key points:
- The percentage of S&P 500 Technology stocks registering a 252-day high exceeded 45%
- After similar thrusts, there was some additional short-term upside in the sector, followed by a pause
- Stocks in the Technology sector exhibit relative trend scores that surpass those of all other groups
Technology stocks dominate the new highs list
After a brief dip to start the year, Technology stocks are back in vogue. On Monday, the percentage of S&P 500 Technology stocks hitting a 252-day high surpassed 45%, marking the highest point since February 2021 and the 31st most substantial level in history.
For those unfamiliar with market breadth history, the emergence of a substantial number of stocks hitting annual highs can sometimes lead to buyers' exhaustion. i.e., it's so good, it's bad. However, in most cases, the spike in new highs ushers in a consolidation rather than a bull market peak.
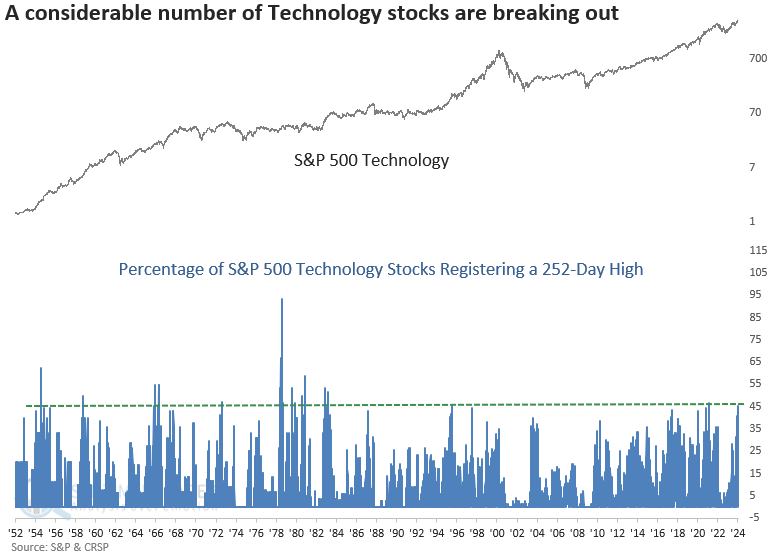
Technology and other cyclical sectors dominate the list of annual highs, a common feature of bull market environments.
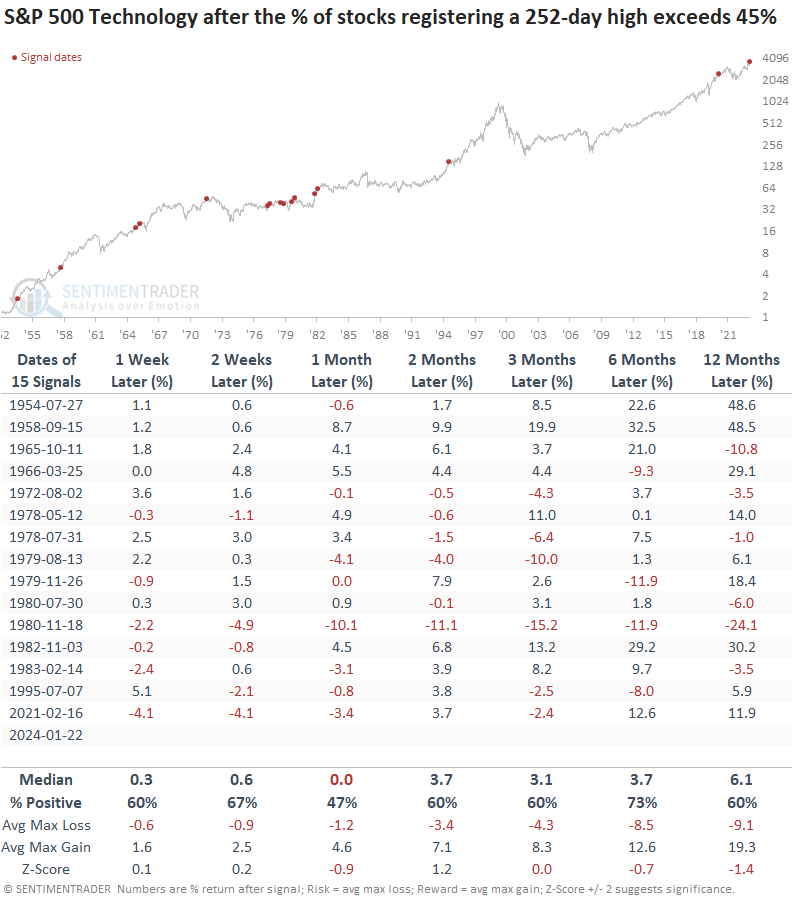
Similar expansions in 252-day highs preceded a pause
Whenever the percentage of S&P 500 Technology stocks hitting a 252-day high surpasses 45%, the sector tends to experience additional upward momentum in the subsequent weeks. However, this momentum fades a month later, resulting in a flat return and a marginally lower coin toss win rate. From a medium to long-term perspective, results are uninspiring.
Surprisingly, only two precedents occurred after 1982, a period containing two significant Technology-driven bull markets. If we focus on those two cases (1995 & 2021), the surge in annual highs signaled exhaustion, with both instances showing negative returns across several time horizons.
The sole instance of a surge in new highs nearly synchronizing with a broad market peak in the S&P 500 occurred in November 1980.
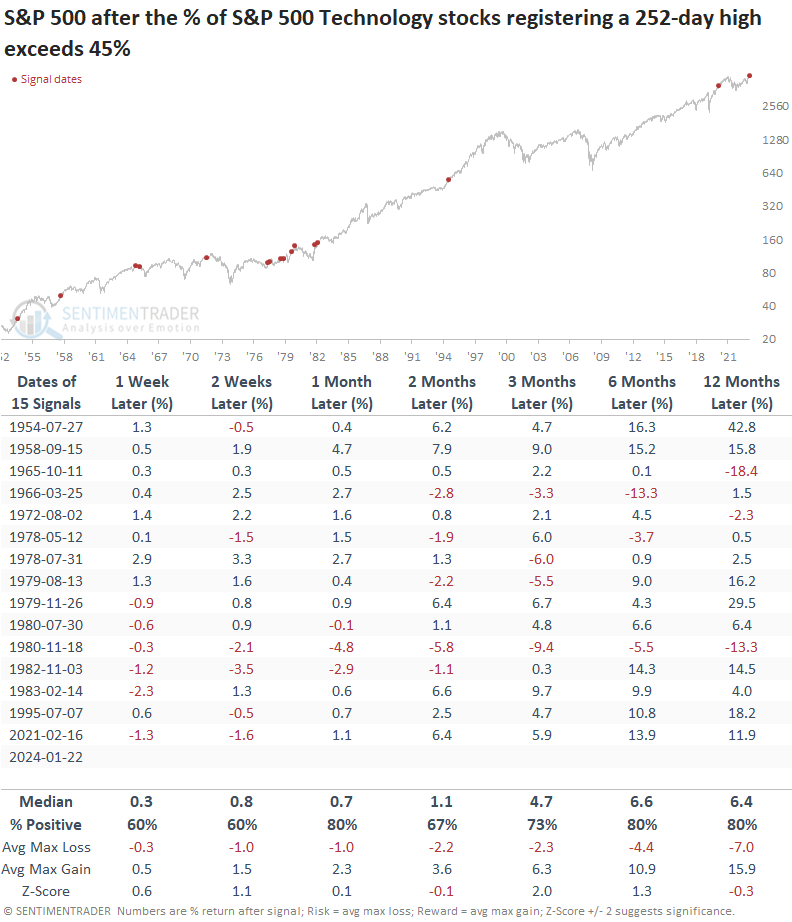
Returns and win rates for the S&P 500 were more favorable across all time frames, suggesting that any pause in Technology did not impact the broader market much. That was especially the case in 1995 and 2021. So, investors likely rotated to other sectors.
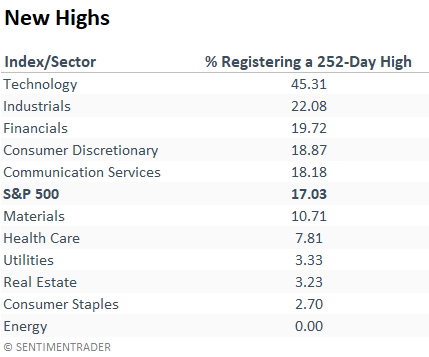
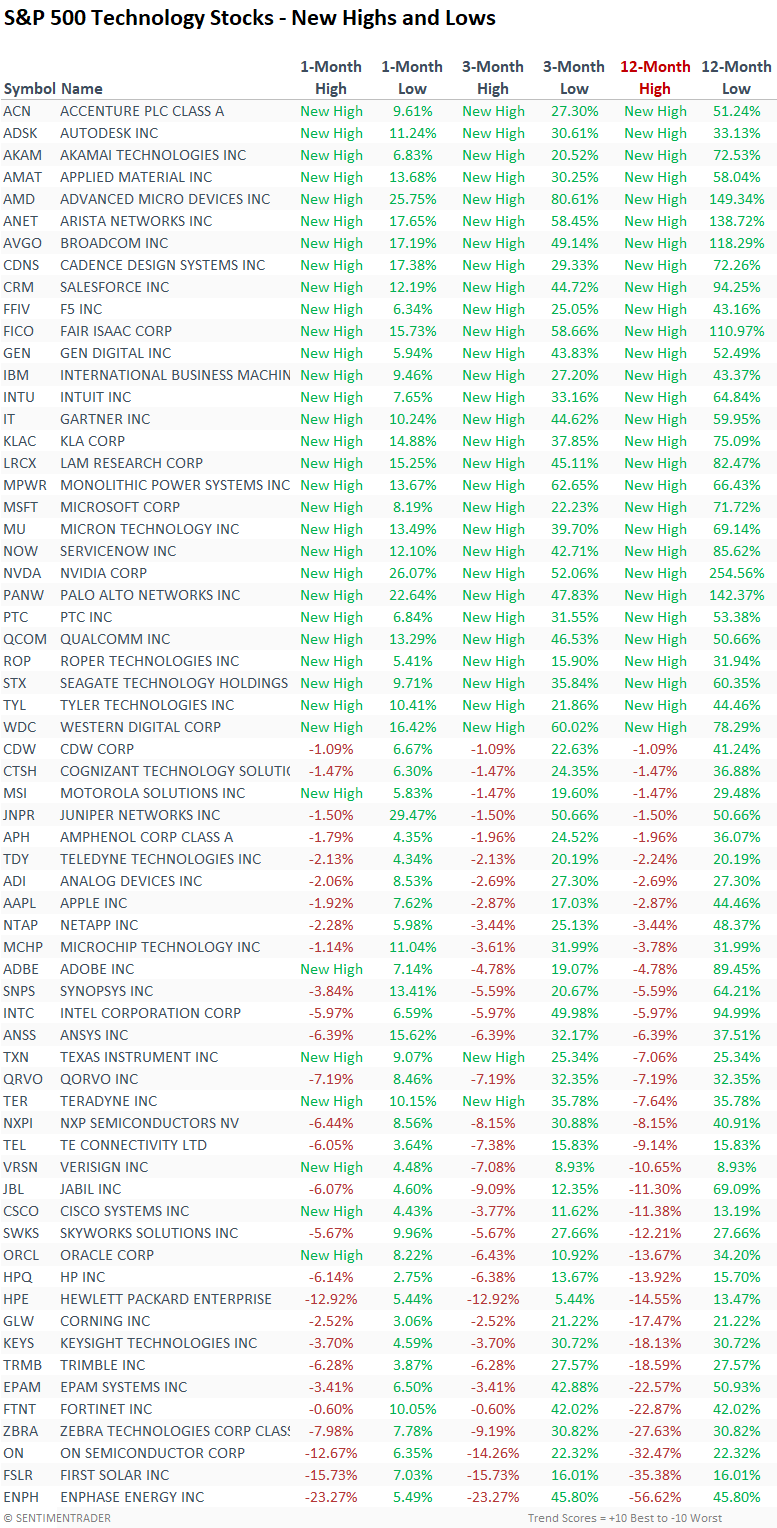
The new highs list
Suppose you're curious about the stocks that led to the recent surge in new highs. In that case, this table displays highs and lows over various timeframes, sorted by annual highs.
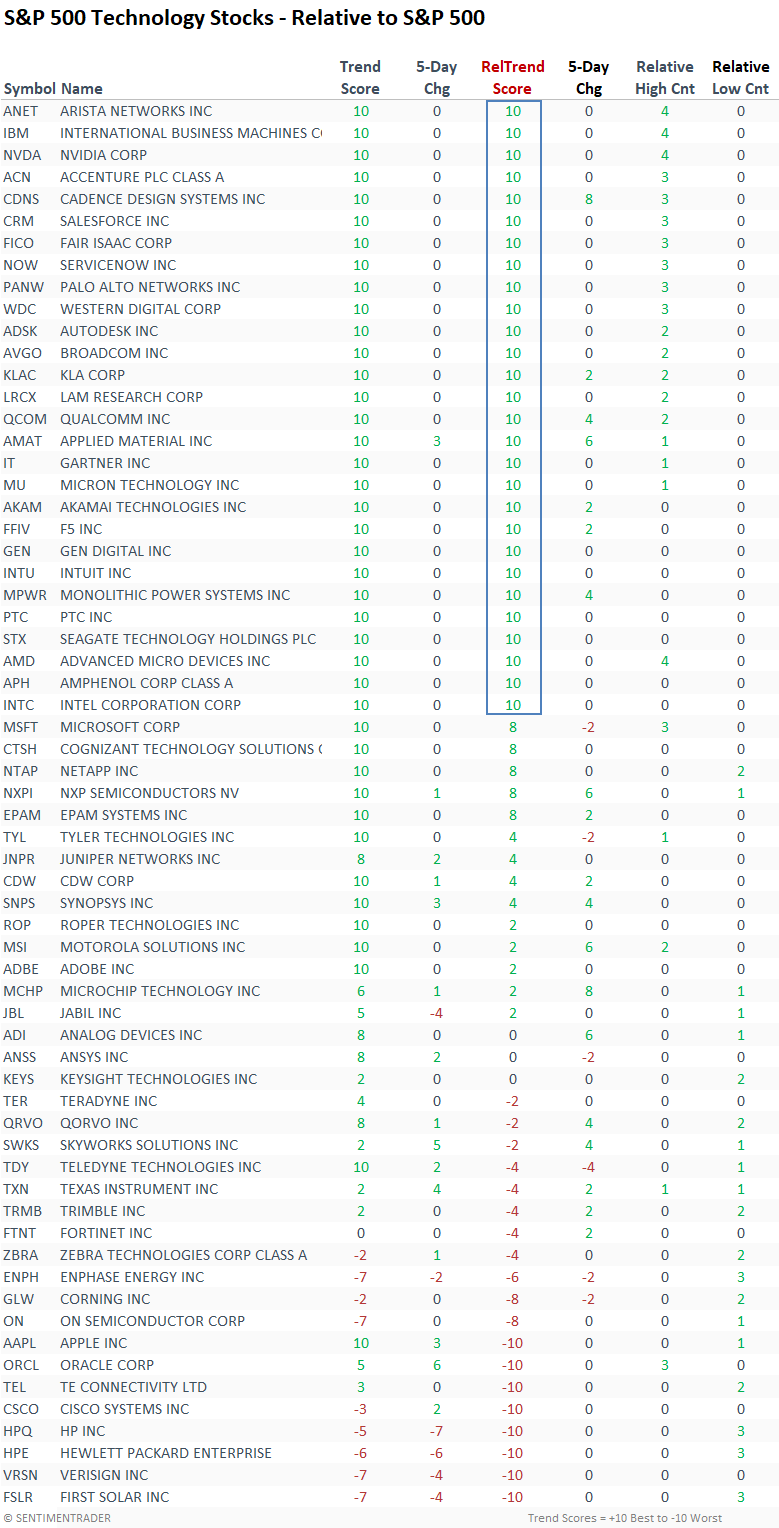
Absolute and Relative Trend Rankings
The Technology sector boasts a plethora of members, each showcasing impressive absolute and relative trend scores. This abundance implies a wealth of opportunities beyond the realm of the prominent Big Seven stocks.
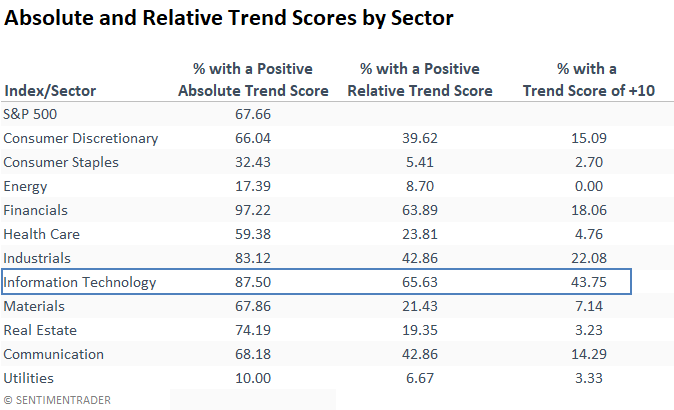
When assessing the percentage of stocks in each sector with a positive absolute or relative trend score, the Technology sector holds a dominant position, especially when it comes to relative scores.
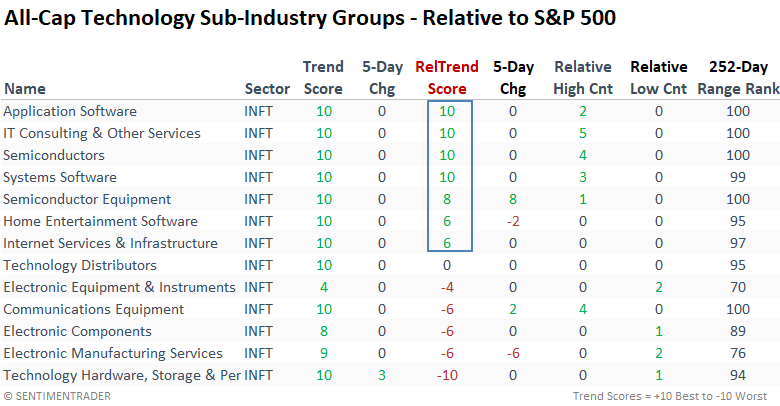
Within S&P 1500 Technology sub-industry groups, Semiconductor, Software, and IT Consulting and Services stocks maintain the highest relative trend scores.
What the research tells us...
The S&P 500 Technology sector registered one of the most pronounced surges in annual highs in more than three decades. While rare, history suggests investors should keep an open mind regarding the potential of a buyer's exhaustion pause. If a pause were to develop, it would likely fall into the sector rotation category rather than something more meaningful like a bull market peak. With absolute and relative trend scores for Technology stocks in excellent shape, the sector should continue to maintain a place in one's portfolio until additional evidence suggests otherwise.