Products
SentimenTrader Trading Tools
‍
Backtest Engine
My Trading Toolkit
Correlation Analysis
Seasonality
Market Prediction
Indicators & Data API
‍
Proprietary Indicators & Charts
Market Data API
Strategies & Scanner
‍
50+ Trading Strategies
Smart Stock Scanner
Smart Option Scanner
Research Reports
‍
Research Solutions
Reports Library
Free Resources
Simple Backtest Calculator
Simple Seasonality Calculator
The Kelly Criterion Calculator
Sentiment Geo Map
Public Research Reports
Education
Sentiment Indicators
Technical Indicators
Pricing
Company
About
In the News
Testimonials
Client Success Stories
Contact
Log inLoginSign up
< BACK TO ALL REPORTS

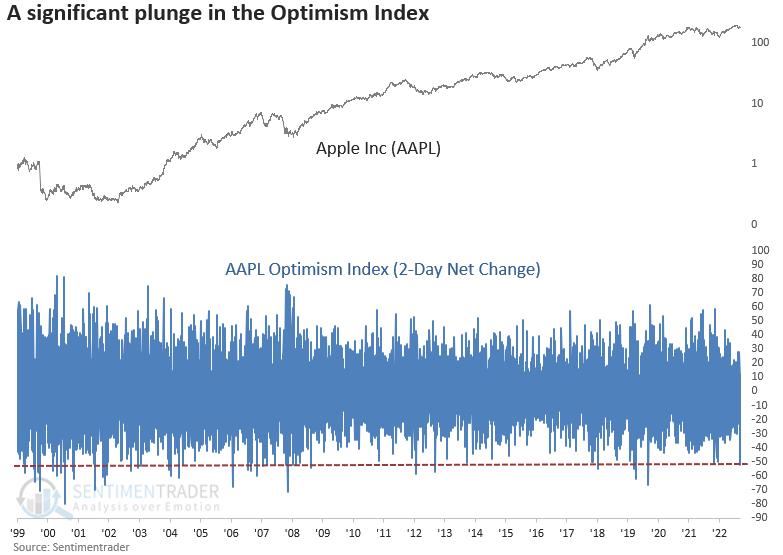
A massive decline in the Optimism Index for Apple

Dean Christians
2023-09-08
Over the prior two sessions, the Optimism Index for Apple plunged by one of the most significant amounts in 40 years. Similar sentiment-based shifts suggest near-term caution on an absolute and relative basis for the bellwether stock. The nosedive also triggered a negative price pattern with a similar cautious outlook for Apple.

Key points:

  • The Optimism Index for Apple saw a dramatic decline, with a drop of more than 50 points in two sessions
  • Similar plunges in sentiment during an uptrend led to negative returns over the following month
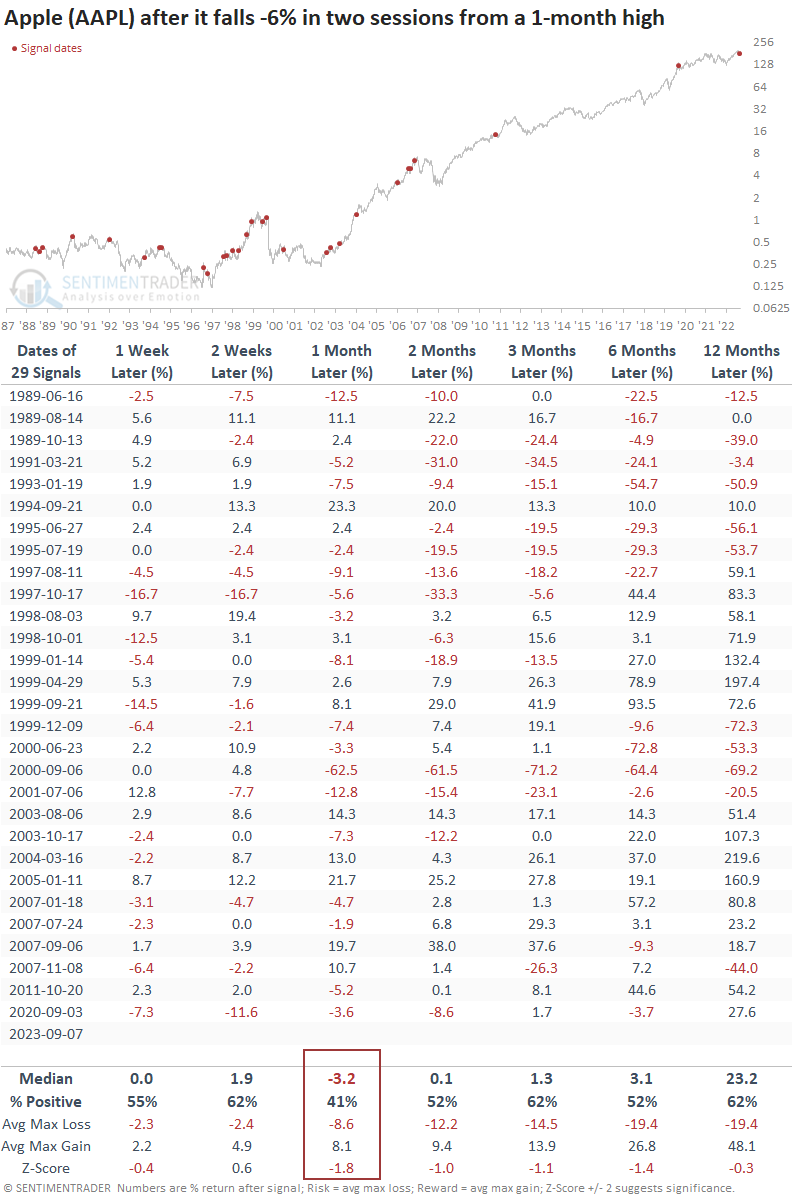
  • A two-session decline of over -6% from a 1-month high also suggests near-term caution for Apple

Sentiment for Apple, one of the big seven stocks, crashes amid China-related news

The prevailing question among investors centers on whether the decline in Apple's stock price, stemming from China's restricting local governments from using Apple products, signals a buying opportunity or the onset of a more substantial correction.

News-related price plunges like this one are difficult to assess as a certain amount of judgment is required. This one is even more difficult because it involves a foreign government.

As always, let's put more weight on our objective data-driven approach rather than our gut feelings.

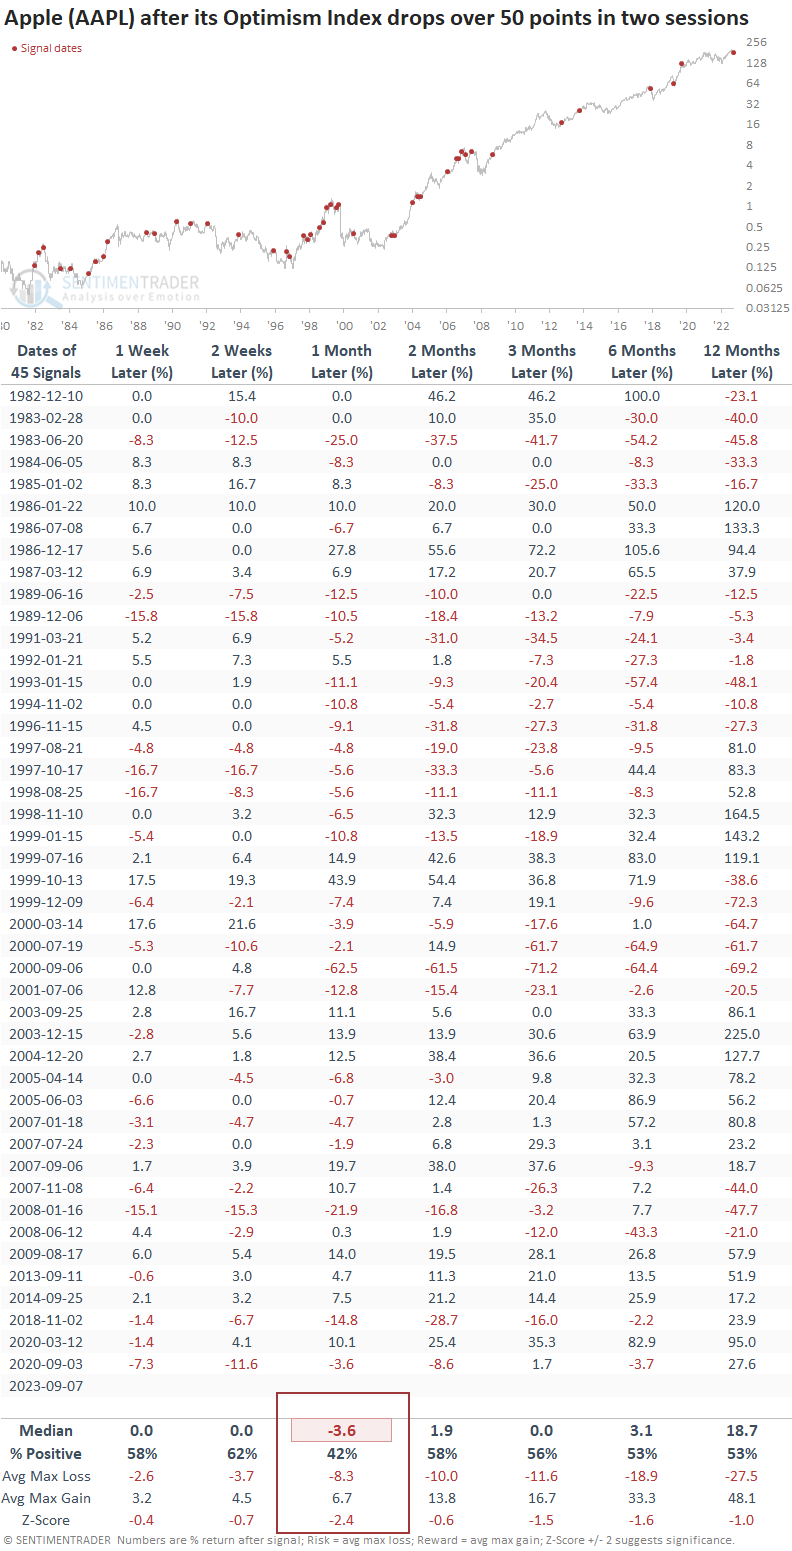
Similar Optimism Index conditions produced unfavorable results

When the Optimism Index for Apple takes a nosedive while the stock is trading above its 200-day moving average, the negative momentum tends to persist throughout the following month, resulting in a median return of -3.6% and a win rate of 42%. Additionally, the median maximum loss outweighs the maximum gain during this time period. 

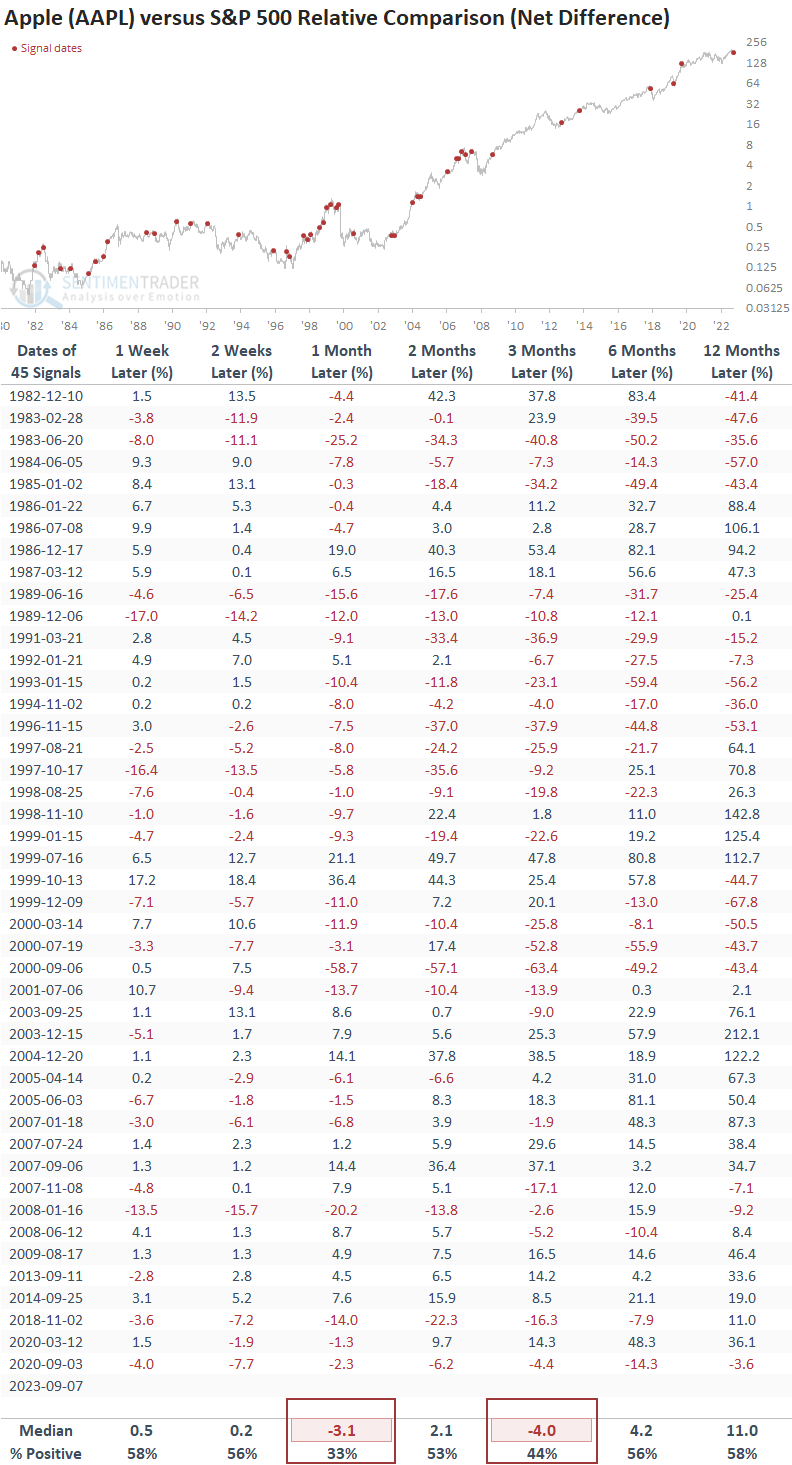
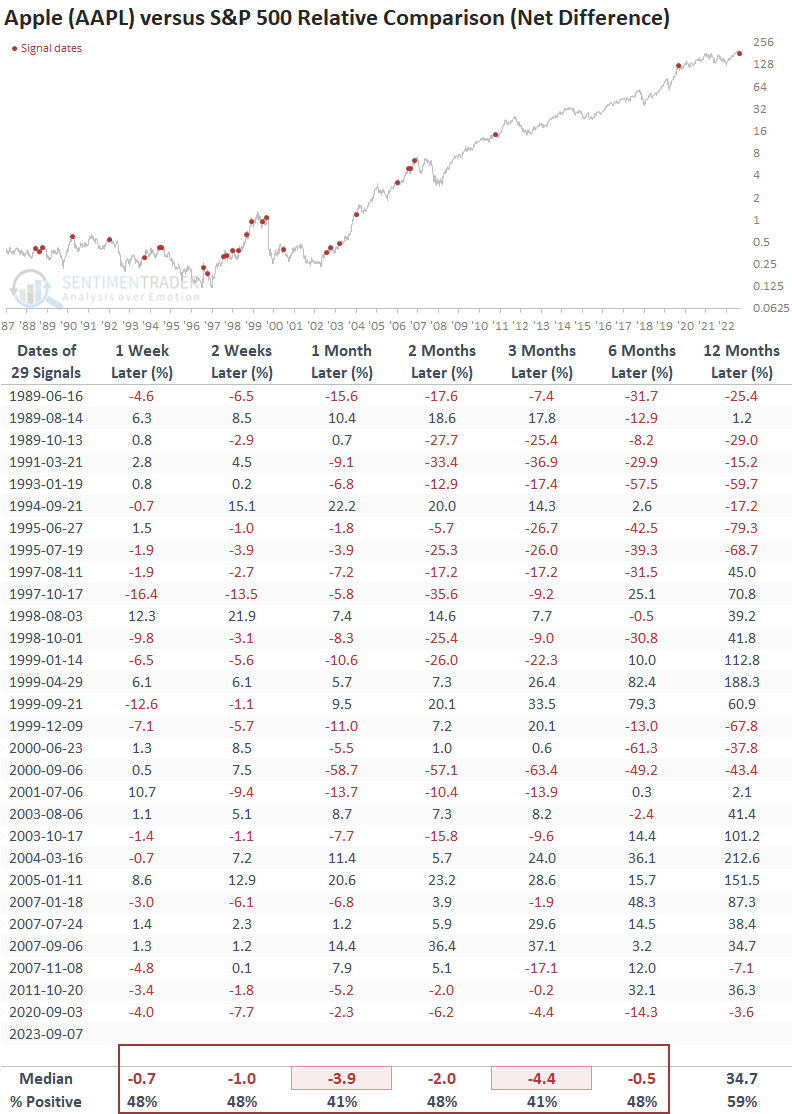
From a relative comparison perspective, the plunge in the Optimism Index suggests Apple could underperform the broad market on a medium-term basis. 

Price and sentiment suggest a similar fate

In cases where Apple registers a decline exceeding -6% in two sessions from a one-month high while still maintaining a position above its 200-day average, history suggests a tendency for the stock to decline over the subsequent month, resembling the behavior observed in the Optimism Index. 

Similar to the Optimism Index results, investors need to be cognizant that AAPL could underperform the S&P 500 over short and medium-term time horizons.

What the research tells us...

The shares in Apple plunged on the news related to China, sending the Optimism Index lower by over 50 points in two sessions, with the stock in an uptrend. Similar sharp contractions in sentiment tended to lead to a negative outcome for the shares over the subsequent month. At the same time, the stock declined by over -6% from a 1-month high. This price pattern has tended to produce unfavorable results similar to the Optimims Index results in the subsequent month. In both cases, Apple underperformed the broad market. While news-driven sell-offs are always difficult to assess, history suggests a cautious outlook for now.

PRODUCTS
SentimenTrader
Trading Tools
Indicators & Data API
‍
Strategies & Scanner
‍
Research Reports
FREE
RESOUrCES
Simple Backtest
Calculator
Simple Seasonality
Calculator
The Kelly Criterion
Calculator
Sentiment Geo Map
‍
Public Research Reports
‍
Education
Sentiment Indicators
‍
Technical Indicators
‍
Pricing
Bundle pricing
‍
FAQ
‍
Announcements
‍
COMPANY
‍
About
‍
In the News
‍
Testimonials
‍
Client Success Stories
CONTACT
‍
General Inquiries
‍
Media Inquiries
‍
Financial Professionals Inquiries
‍
© 2026 Sundial Capital Research Inc. All rights reserved.
Setsail Marketing
TermsPrivacyAffiliate Program
Risk Disclosure: The information and tools provided are for research and analytical purposes only and are not intended as investment advice. Market analysis involves uncertainty, and outcomes may differ from expectations. Users should conduct their own due diligence and consider their individual circumstances before making any financial decisions. Past performance is not necessarily indicative of future results.

Hypothetical Performance Disclosure: Hypothetical performance results have many inherent limitations, some of which are described below. No representation is being made that any account will or is likely to achieve profits or losses similar to those shown; in fact, there are frequently sharp differences between hypothetical performance results and the actual results subsequently achieved by any particular trading program. One of the limitations of hypothetical performance results is that they are generally prepared with the benefit of hindsight. In addition, hypothetical trading does not involve financial risk, and no hypothetical trading record can completely account for the impact of financial risk of actual trading. for example, the ability to withstand losses or to adhere to a particular trading program in spite of trading losses are material points which can also adversely affect actual trading results. There are numerous other factors related to the markets in general or to the implementation of any specific trading program which cannot be fully accounted for in the preparation of hypothetical performance results and all which can adversely affect trading results.

Testimonial Disclosure: Testimonials appearing on this website may not be representative of other clients or customers and is not a guarantee of future performance or success.