
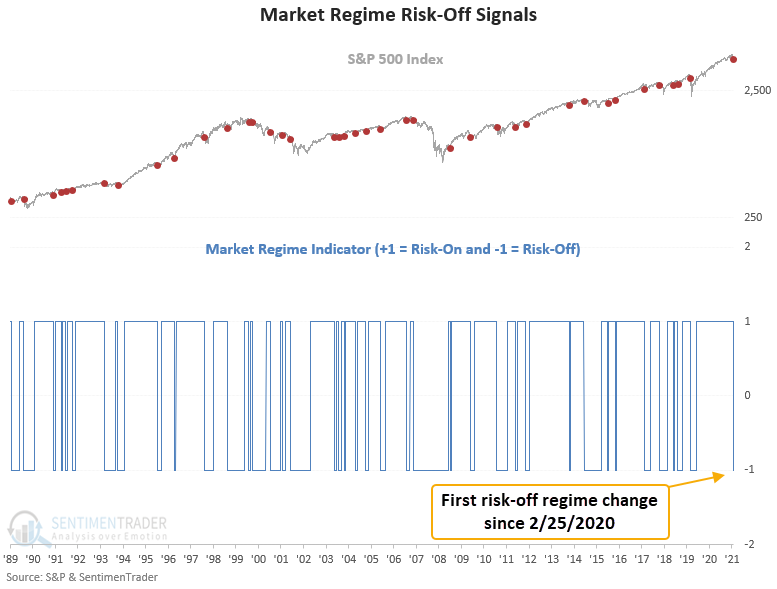
A market regime indicator reversed from risk-on to risk-off

Key points:
- The S&P 500 closed at a 40-day low
- At the same time, fewer than 56% of S&P 500 members > their respective 200-day average
- The simultaneous condition of both events flipped a market regime indicator to risk-off
A market regime indicator that combines internal and external trend indicators
A new signal from a market regime indicator registered a risk-off alert on Thursday. Based on the following events, the market regime indicator will switch from one condition to another.
Risk-on conditions:
- The S&P 500 closes at a 40-day high
- The percentage of S&P 500 members above their 200-day average > 56%
Risk-off conditions:
- The S&P 500 closes at a 40-day low
- The percentage of S&P 500 members above their 200-day average < 56%
A backtesting process determined the optimal threshold levels for the system. The optimization parameters were 20-42 days in 2-day increments for the high-low breakout condition and 30-60% in 1% increments for the percent above 200-day condition. So, a 40-day breakout provides an intermediate-term external assessment of the index price trend. In contrast, the percent above the 200-day provides an internal evaluation of long-term member trends.
Annualized returns based on the market regime
Market regime indicators rarely show overwhelmingly bullish or bearish annualized return scenarios, especially ones with a start date in 1927. Risk-on numbers tend to look slightly better than long-term averages. And, risk-off returns are not as negative due to whipsaw signals and the inability to quickly flip back bullish after severe bear markets. For example, the S&P 500 rallied 40% in 3 months after the 2009 low before the market regime indicator reversed back to risk-on. That type of surge creates an upward bias at the tail end of a devasting period.
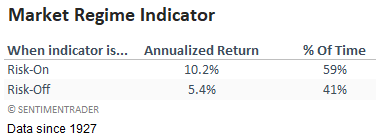
This is what we seek to avoid with a market regime indicator.
However, this is what we can get in a choppy trend environment.
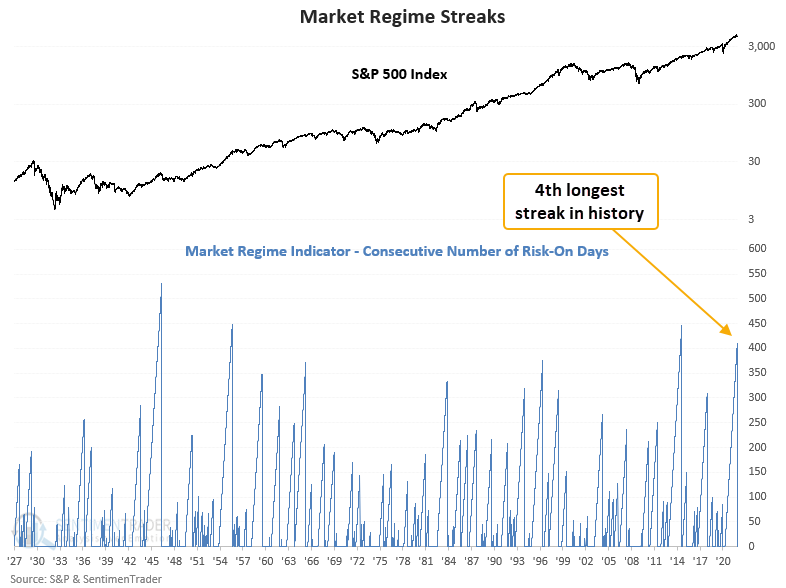
What happens when a risk-off signal occurs after a long risk-on period
After 410 trading sessions in the risk-on regime, the indicator flipped to risk-off, ending the 4th longest streak since 1927. Let's conduct a study to assess the outlook for the S&P 500 when the market regime indicator flips to risk-off after a risk-on signal that lasts for 300 days or more.
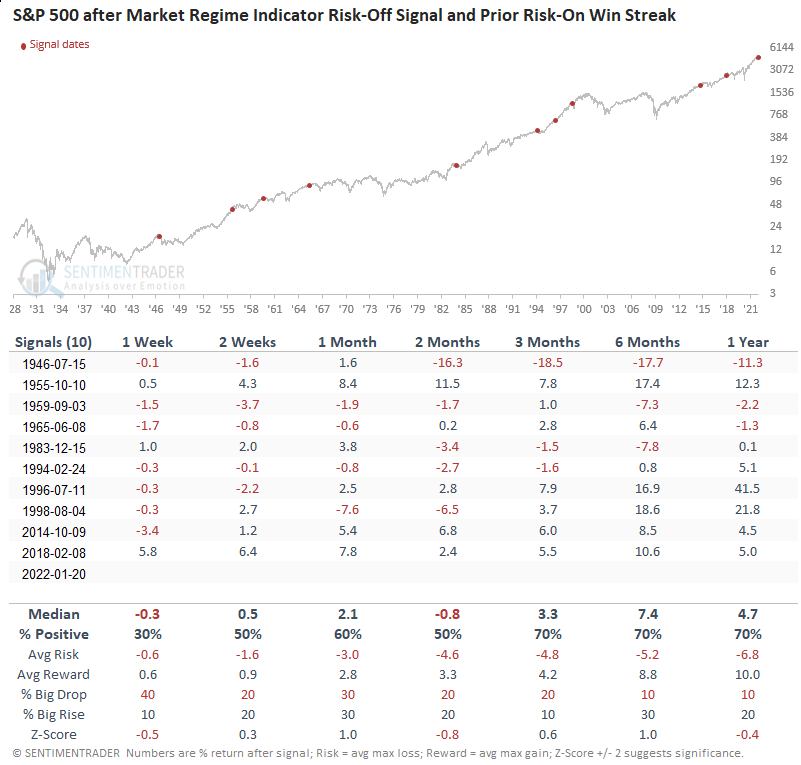
 Similar signals preceded slightly weak to flat returns
This signal triggered 10 other times over the past 76 years. After the others, S&P 500 future returns and win rates were slightly weak to flat in the 1-8 week timeframes. The signal in 1946 is the only time that one of the risk-off regime changes coincided with a bear market top.
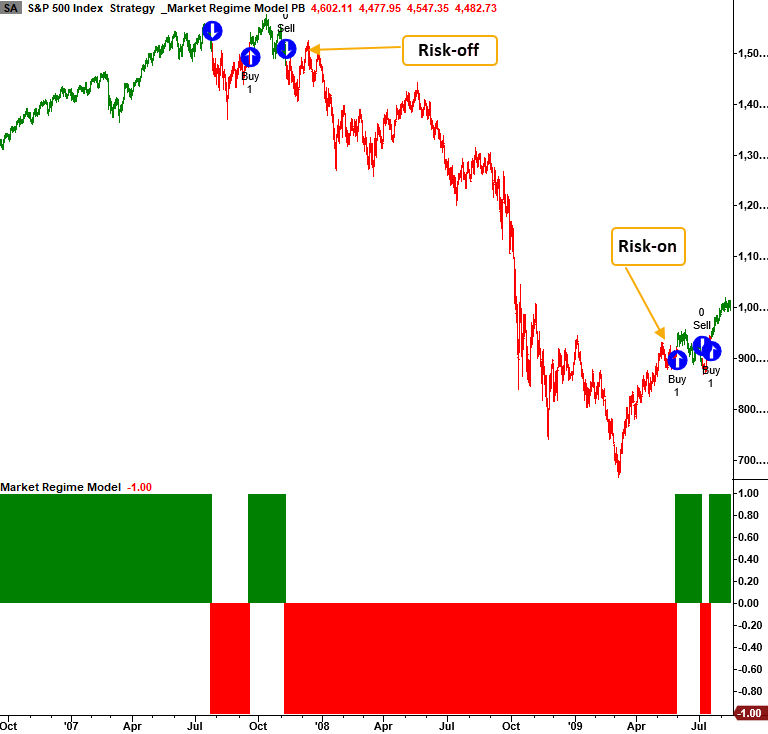
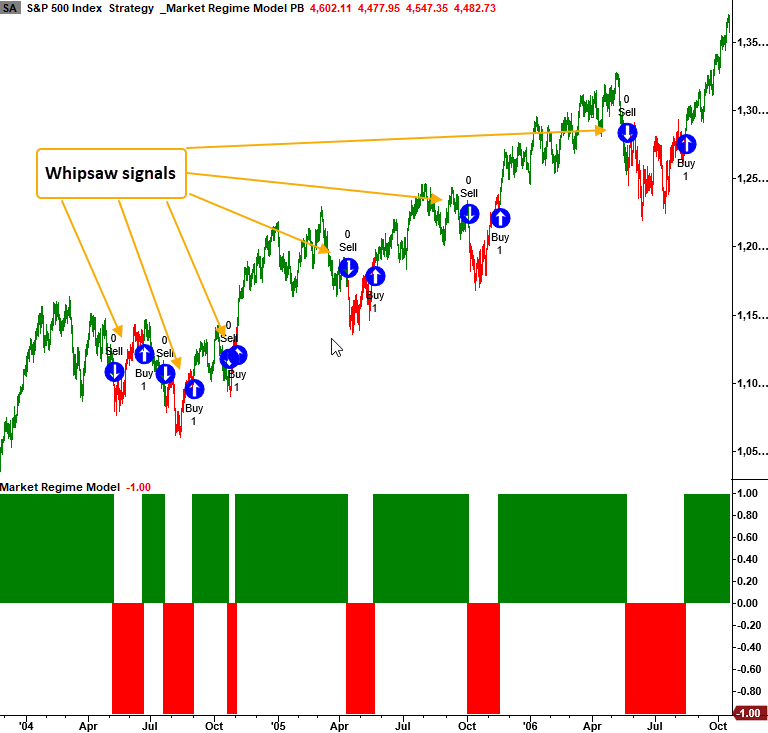
Some thoughts on this indicator
- While the market regime indicator can avoid devasting drawdowns like 2007-08, it can also produce whipsaw signals. I would never use it as a stand-alone method.
- I designed this indicator with my risk tolerance and investing/trading style in mind. Suppose you're a long-term buy-and-hold investor with a taxable account. In that case, you might want to use a method with more long-duration indicators. For instance, you could replace the 40-day breakout condition with the slope of the 200-day moving average.
What the research tells us...
When the S&P 500 closes at a 40-day low, and fewer than 56% of S&P 500 members are above their 200-day average, a risk-off regime environment can lead to lower than average market returns. Furthermore, after long market regime risk-on streaks end, future returns and win rates look slightly weak to flat on a short and medium-term basis.