
A majority of NYSE common stocks are now in long-term uptrends

Key points:
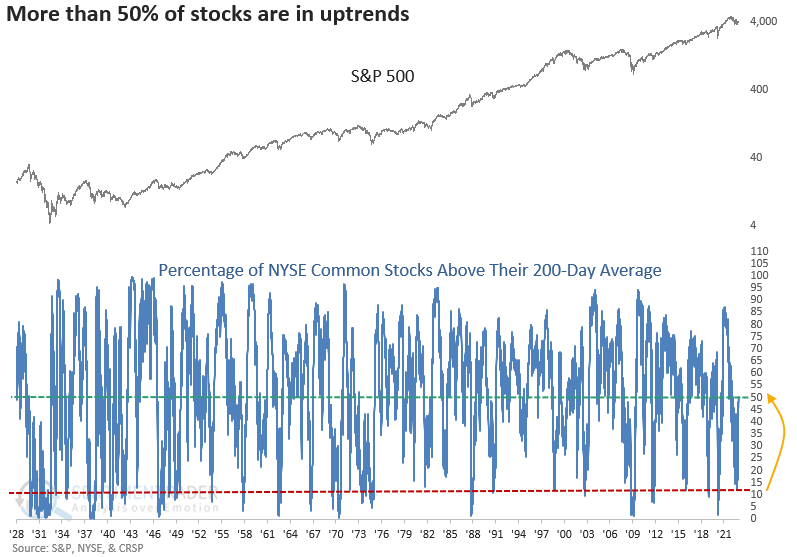
- The percentage of NYSE common stocks above their 200-day average cycled from < 13% to > 50%
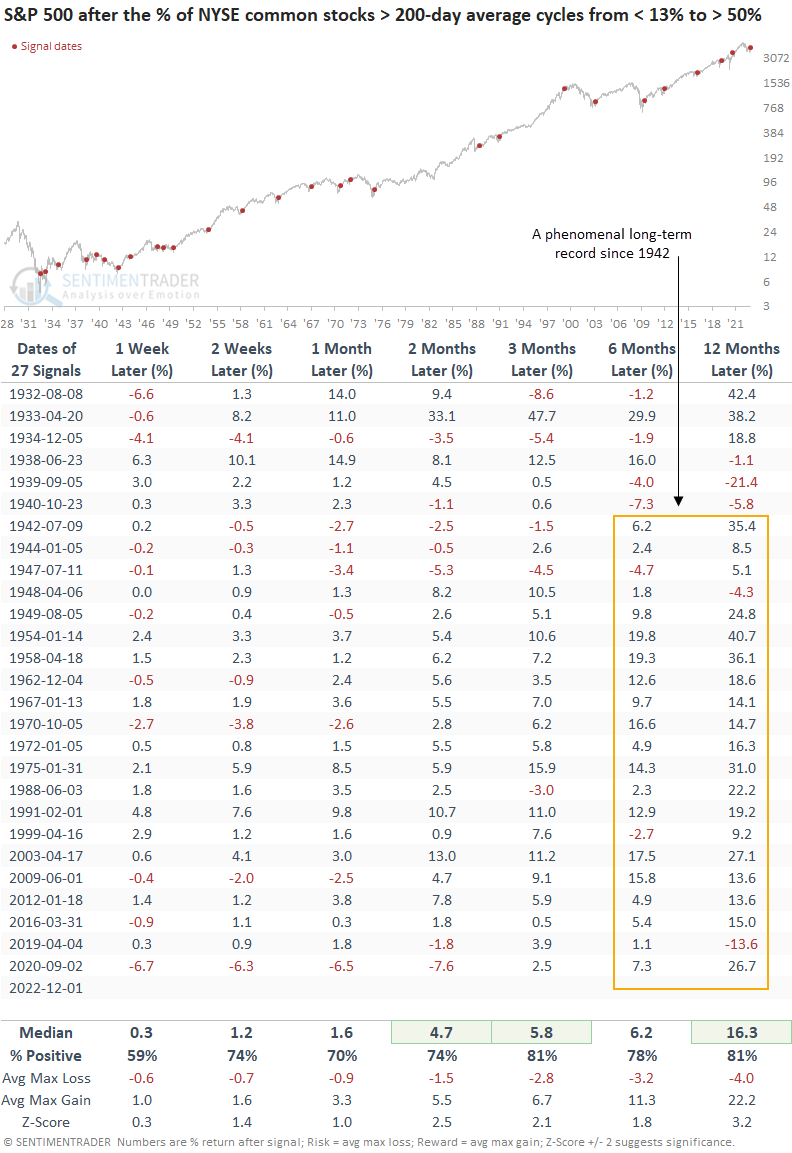
- After similar reversals, the S&P 500 was higher 81% of the time a year later
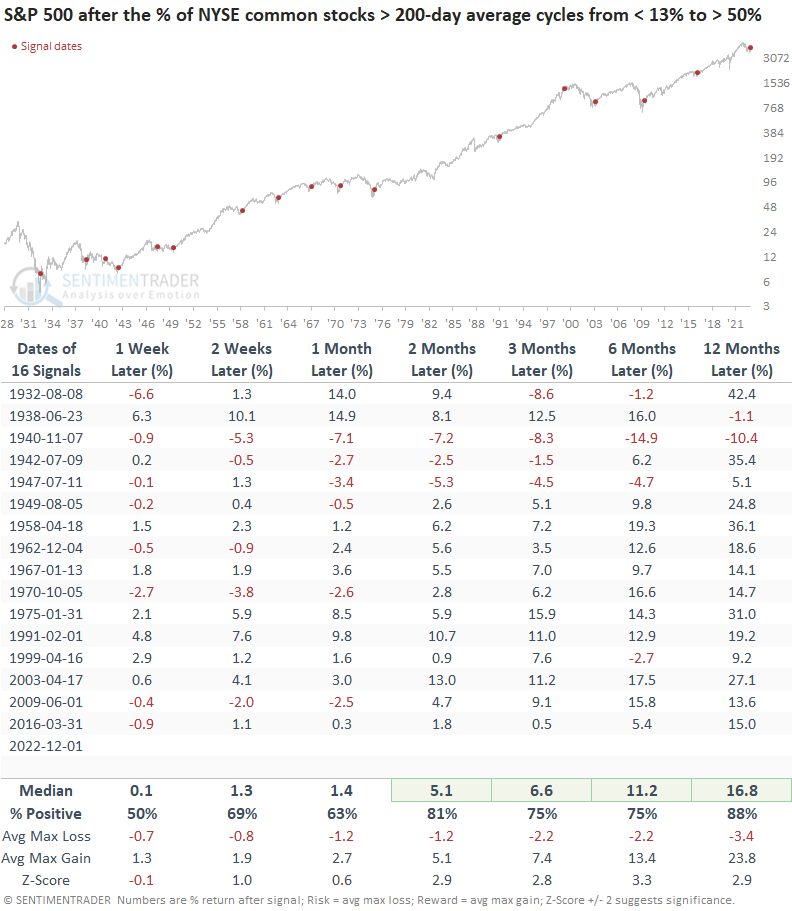
- A recovery accompanied by a breakout led to an 88% win rate a year later
A majority of NYSE common stocks have recaptured their long-term uptrends
Since the October low, the recovery in market breadth indicators for indexes and sectors has been impressive. And it's occurring on a worldwide basis.
On Thursday, the recovery got even more impressive when the percentage of NYSE common stocks trading above their 200-day moving average exceeded 50%. Keep in mind the NYSE common stock basket contains over 2000 constituents. The recovery in long-term uptrends occurred after fewer than 13% of members closed above their 200-day average as recently as late September.
Similar reversals preceded excellent long-term returns
When the percentage of NYSE common stocks above their 200-day average cycles from < 13% to > 50%, returns, win rates, and z-scores were excellent across all time frames. Besides two signals, drawdowns were remarkably low throughout history. Since 1942, the S&P 500 has shown a positive return every time at some point in the next year.
A bullish development worth noting
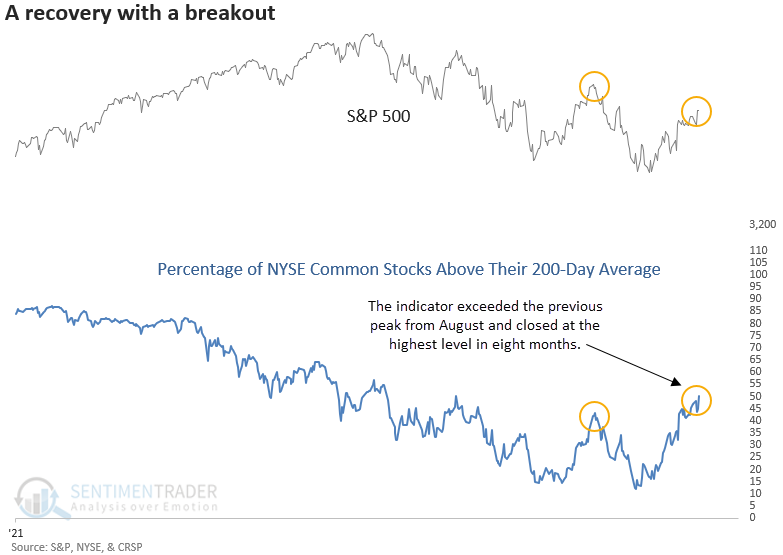
Usually, during extended bear markets, the percentage of stocks above their 200-day moving average will register a series of lower highs and lower lows, similar to stock indexes. However, the recent recovery in long-term uptrends exceeded the previous peak from August. i.e., a higher high. The improvement above the previous high water mark resulted in an 8-month high for the indicator.
Let's add some context to the original signal by including an 8-month high for the percentage of stocks above their 200-day moving average. So, when the indicator crosses above 50%, the time series must also close at an 8-month high.
The stock market outlook improves further when the percentage of NYSE common stocks above their 200-day average cycles from < 13% to > 50% and the percentage exceeds an 8-month high. The signal has a perfect record a year later since 1942. Once again, drawdowns are minimal.
What the research tells us...
As we've highlighted in several recent notes, most stocks within popular indexes and sectors have recovered their medium and long-term uptrends. Adding further confirmation to the bullish backdrop is a recovery in a significantly broader basket of stocks, the NYSE composite. After similar reversals in long-term uptrends for NYSE common stocks, the S&P 500 enjoyed healthy returns, especially over the next year.