
A Major Divergence Emerges: Strong Stocks vs. Weak Bonds and Crude Oil

Key points:
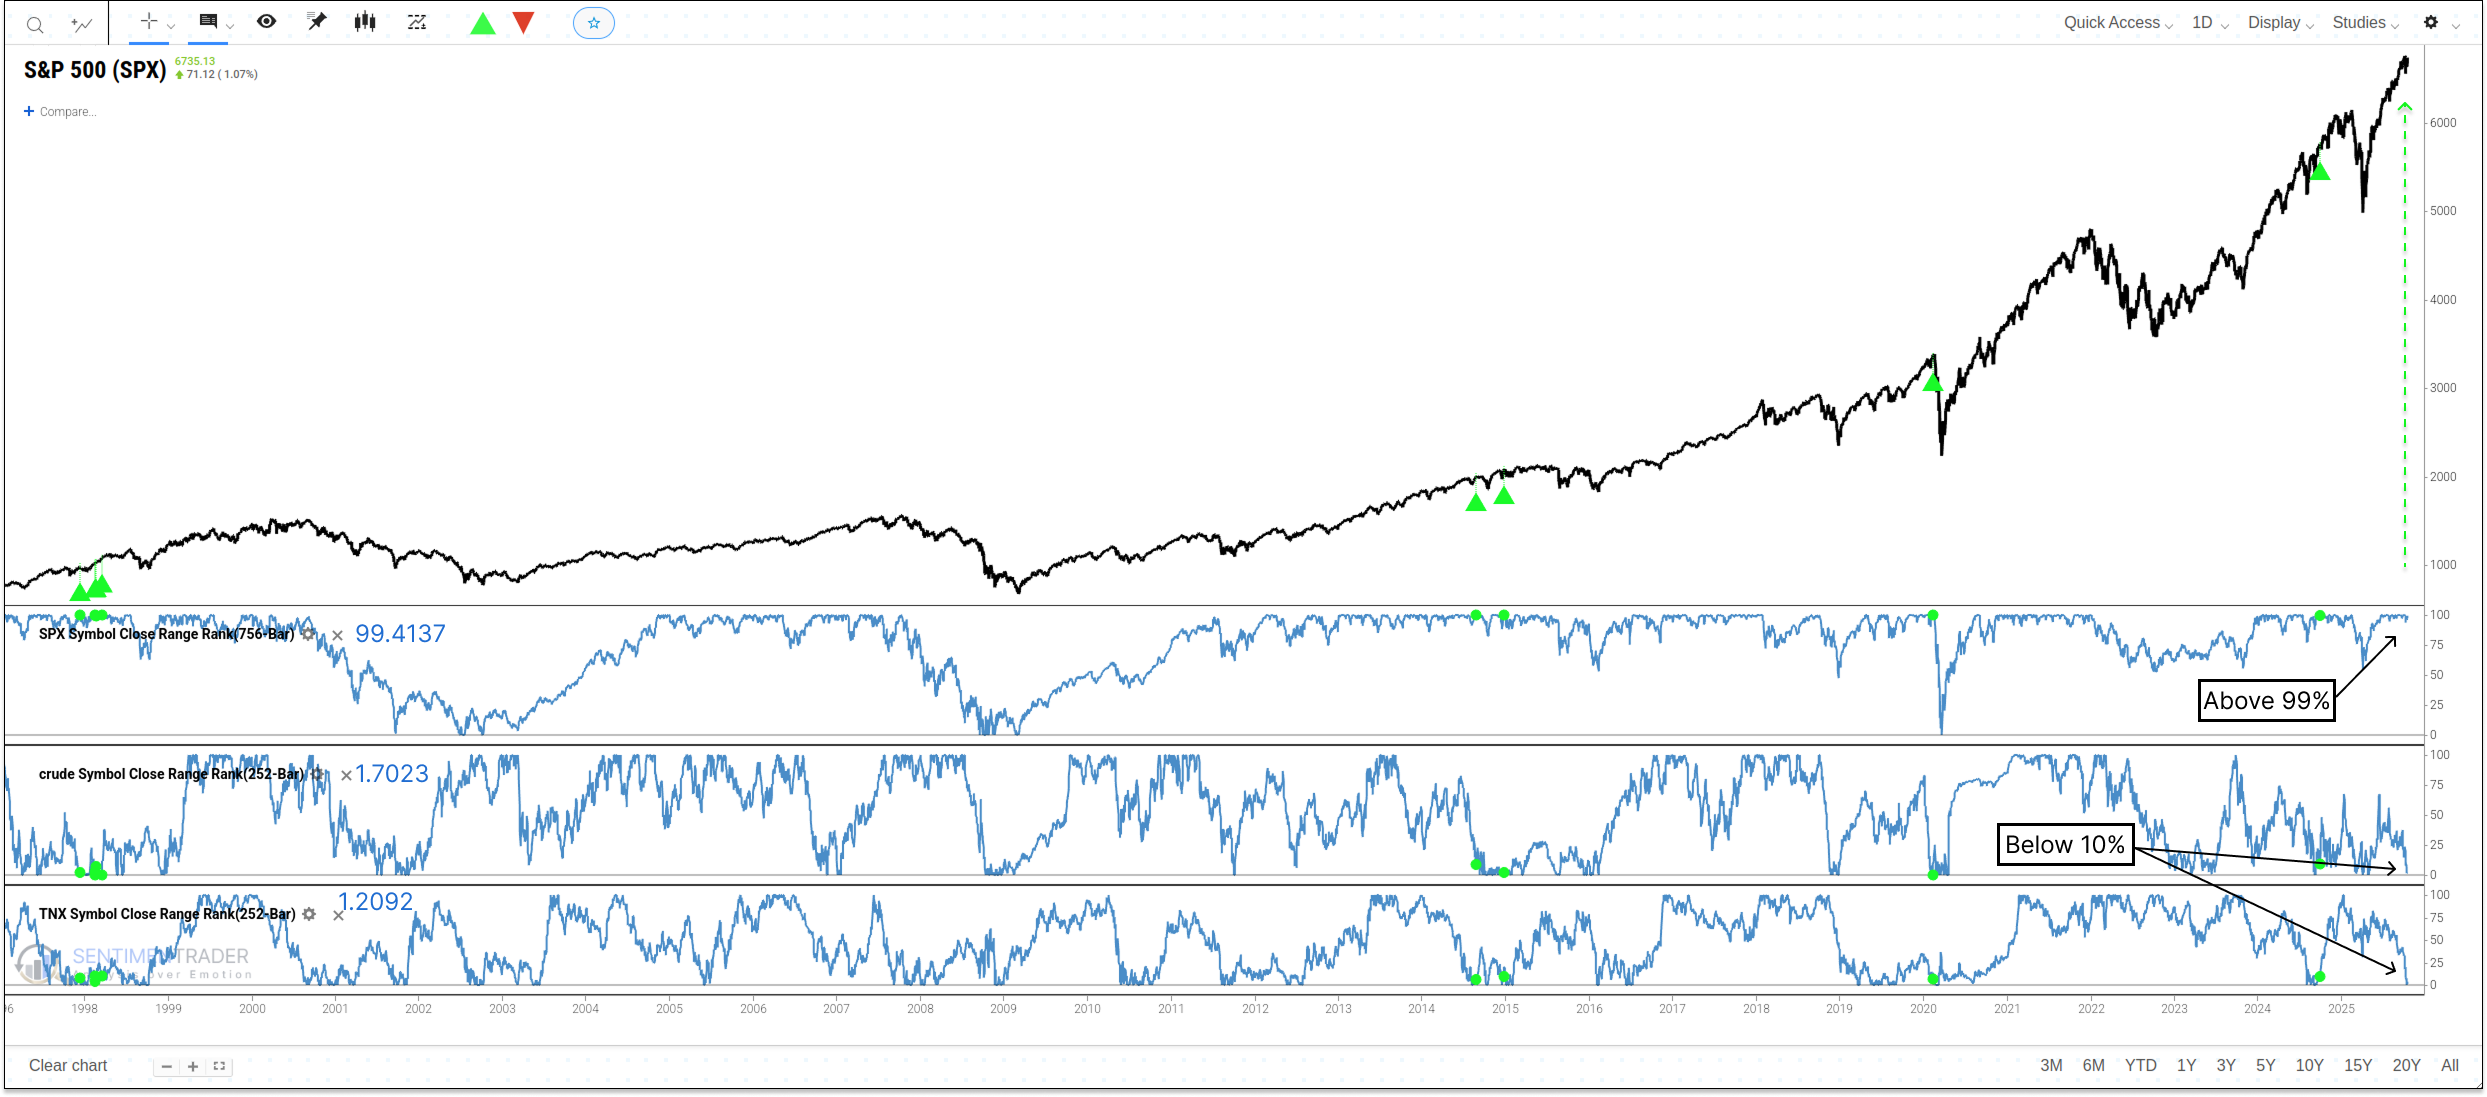
- The S&P 500 is trading near a three-year high, while Crude Oil and the 10-year Treasury yield are simultaneously trading near one-year lows, creating a significant intermarket divergence.
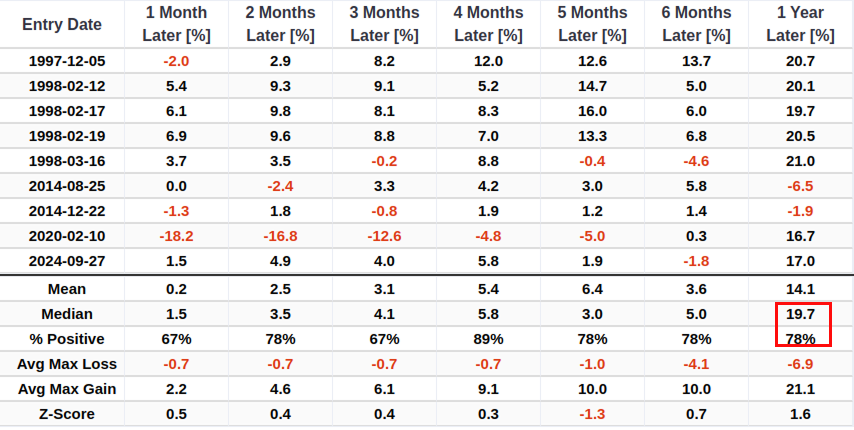
- Historically, similar divergences have preceded strong returns for the S&P 500, with a one-year median return of +19.7%.
- Following the signal, both Crude Oil and the 10-Year Treasury Yield have shown a strong tendency to continue trending lower.
When stocks are pricing a soft landing, but bonds and oil signal a slowdown
The current market is sending deeply conflicting messages, creating a fierce debate between bulls and bears. On one hand, stock market bulls point to the S&P 500 trading at its highest levels in three years as a clear sign of economic resilience and a successful "soft landing." On the other hand, bears are sounding the alarm, pointing to the concurrent weakness in two economically-sensitive assets: crude oil and long-term interest rates, which are both hovering near one-year lows. As one market commentator might say, "The stock market and the bond/commodity markets are telling two completely different stories. Both cannot be correct."
A new signal has just triggered under the following conditions:
- The 756-day (3-year) range rank for the S&P 500 is greater than 99.
- The 252-day (1-year) range rank for Crude Oil is less than 10.
- The 252-day (1-year) range rank for the 10-Year Treasury Yield (TNX) is less than 10.
This rare divergence raises a critical question: Historically, which market has been right? Do stocks tend to follow oil and bonds lower, or do the lower energy costs and interest rates provide a tailwind that pushes stocks even higher?
Similar divergences preceded strong returns for the S&P 500
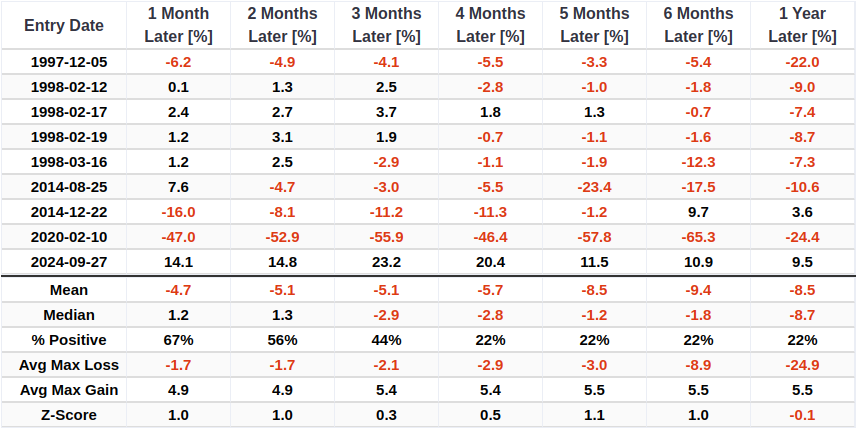
The historical data provides a clear answer to our primary question. Whenever the S&P 500 has been near a multi-year high while crude oil and the 10-year yield were simultaneously near one-year lows, it has historically been the stock market that has been correct. The S&P 500 has tended to post solid gains, appearing to benefit from the tailwind of more favorable energy prices and borrowing costs.
The performance over the subsequent year is particularly noteworthy, with a median return of +19.7% and a 78% win rate. While the sample size is small due to the rarity of this divergence, it's significant that five of the nine precedents occurred in the late 1990s, an era frequently described as a "Goldilocks" period for the economy and the market.
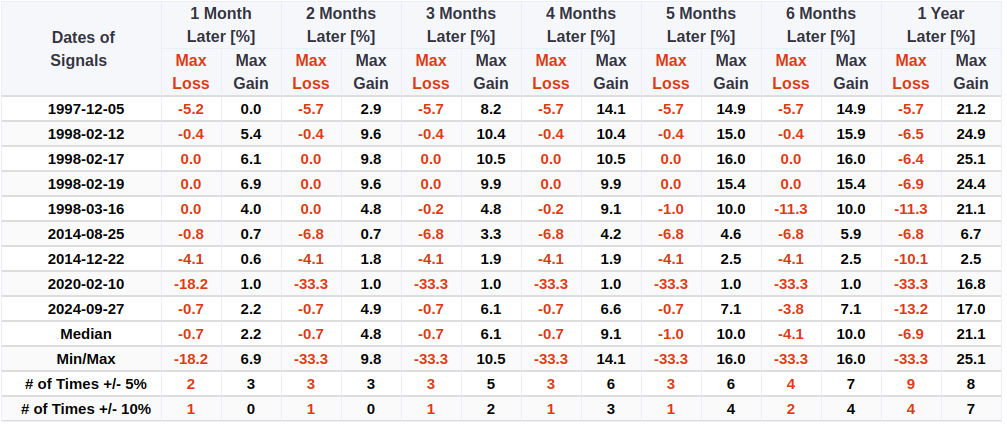
An analysis of the maximum drawdowns provides additional context on the risk profile. The median maximum loss over the subsequent year was -6.9%. The 2020 signal was a notable outlier, experiencing a drawdown of -33.3% during the pandemic-induced crash, while most other signals saw more contained pullbacks.
Now let's turn to the other side of the divergence. The historical precedent suggests that the weakness in crude oil and Treasury yields has tended to persist. Following these signals, crude oil's performance has been overwhelmingly negative, with win rates struggling to get above 30% across all time frames. One year later, the median return for crude was a deeply negative -26.0%.
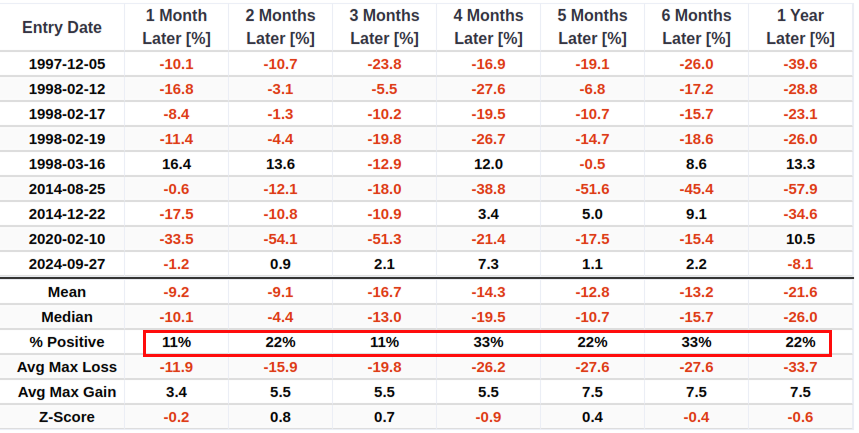
The maximum loss table for crude oil shows a history of significant downside volatility, with a median max loss over one year of -33.7%.
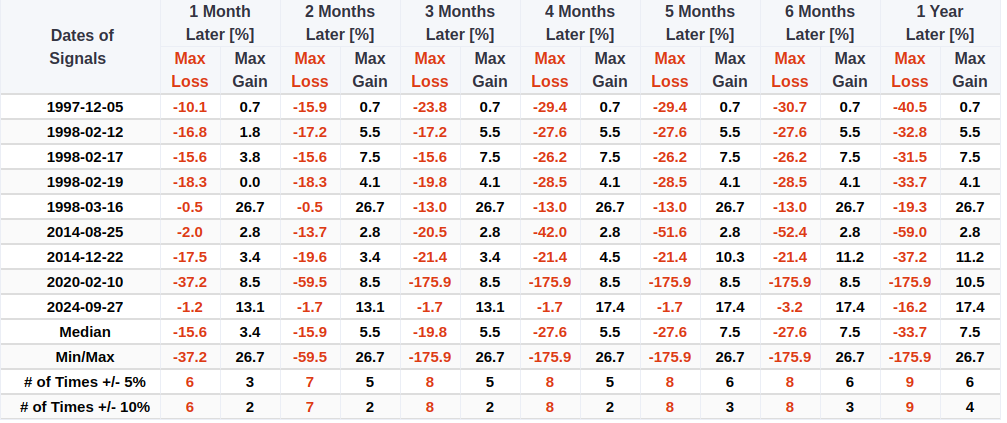
A similar pattern of continued weakness has been evident in the 10-year Treasury yield. Following similar divergences, the yield, commonly used as a proxy for mortgage rates, displayed a solid tendency to decline. Over a period of four to twelve months, there is a 78% probability that yields will decline. The one-year median return was a significant -8.7%.
Don't count the consumer out
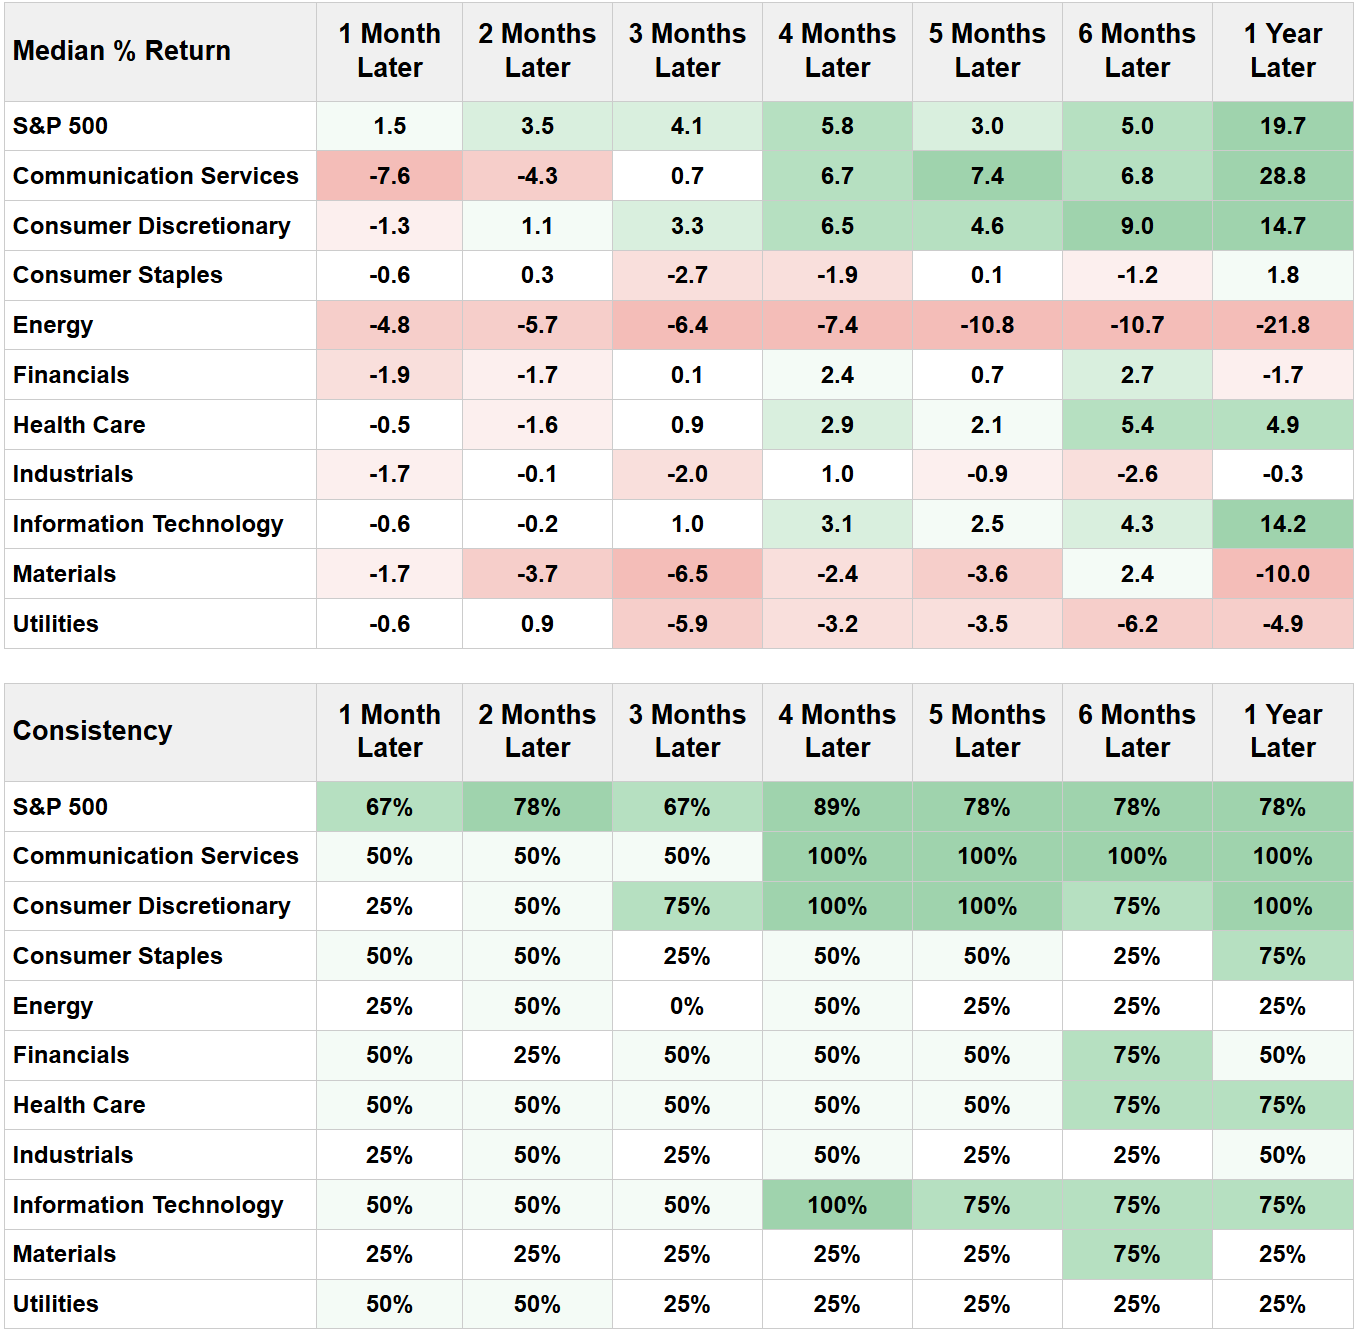
The continued decline in both energy prices and borrowing costs provides the fundamental underpinning for the bullish outlook for stocks. An easing in oil and rates should logically benefit consumer-oriented sectors the most, and the historical data strongly supports this hypothesis.
Following similar conditions, the Consumer Discretionary sector was a standout performer, posting a solid one-year median return of +14.7% and showing remarkable consistency with a 100% win rate from four months through the one-year mark. While several sectors had negative returns, Information Technology also performed well with a +14.2% median return. Unsurprisingly, the Energy sector was the worst performer by a wide margin. This clear divergence in sector performance shows exactly where the market's leadership has been found during these historical "Goldilocks" environments.
What the research tells us...
When crude oil and the 10-year Treasury yield approach annual lows while stocks hover near multi-year highs, a fierce debate between bulls and bears often ensues. The historical data, however, resolves this conflict: investors who trusted the bullish message from equities have historically reaped the rewards. A more worrisome concern would arise if all three assets were declining in tandem.
The underlying logic is sound. Lower energy costs and reduced borrowing expenses create an economic stimulus that has historically fueled stock prices higher. Following similar precedents, the S&P 500 rallied with strong consistency over the subsequent year. However, seasonality, and the Fed will likely keep the market range-bound in the short term.