
A major breakout in the most important interest rate

Key points:
- The yield on 10-year Treasury notes recently broke out to a decade-long high
- Over the past 60 years, significant breakouts in the yield have preceded gains in the S&P 500 every time six months later
- In prior decades, big yield breakouts were much more damaging to stocks
A major breakout in the most important interest rate
Long-term interest rates have quickly risen again, which has had a ripple effect across markets from stocks to real estate, both foreign and domestic. Investors tend to be most concerned about potential impacts on the stock market, as the The Wall Street Journal notes:
When investors start demanding higher yields on longer-term bonds to compensate for the risk of inflation, that "is correlated with lower risk-asset prices," said Zhiwei Ren, a portfolio manager at Penn Mutual Asset Management. "I think that's what markets are worried about right now."
Because we were mired in a multi-generational bear market in interest rates, it has been a long time since the yield on 10-year Treasuries reached a 10-year high for the first time in more than 200 sessions. It happened in June 2022, but before that, we'd have to go back to 1981.
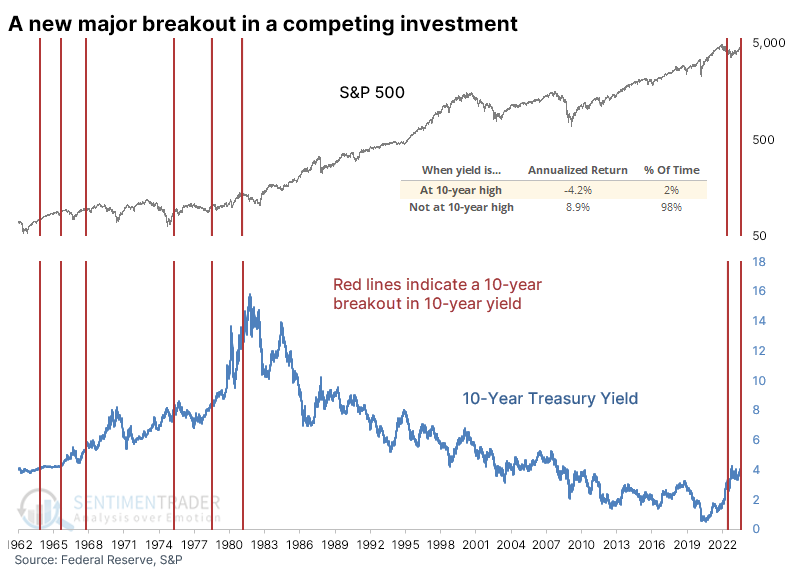
Over the past 60 years, when the 10-year yield was at a 10-year high, the S&P 500's annualized return was -4.2%, compared to +8.9% when the yield was not at a 10-year high.
Big breakouts in yields were not a good sell signal...lately
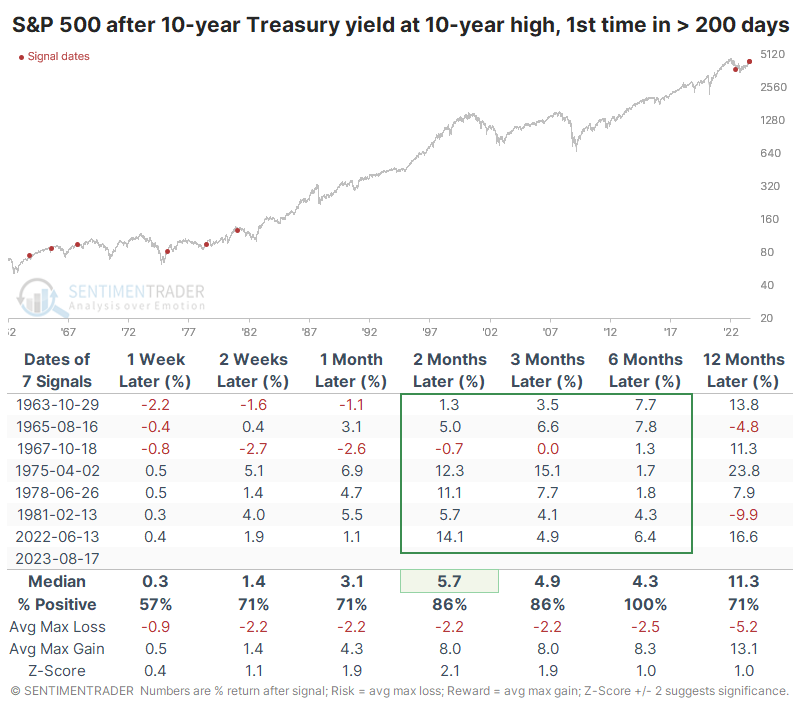
That's a distressing data point for stock investors, but almost all the days were concentrated among only a handful of distinct instances. The table below shows returns in the S&P after the first decade-long breakout in 10-year yields in at least 200 sessions.
These were not bearish for stocks. The S&P rose consistently across all time frames and was higher every time six months later. Its average returns weren't all that special, nor was the risk/reward ratio. The biggest takeaway was simply the lack of significant declines within the next year or any declines whatsoever six months later.
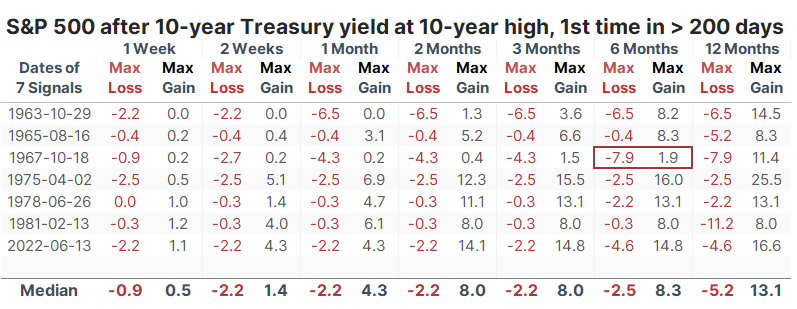
The table of maximum gains and losses across time frames shows that over the next six months, there was only one drawdown of more than -6.5% within the next six months, while all but one signal gained more than +6.5% over that time frame.
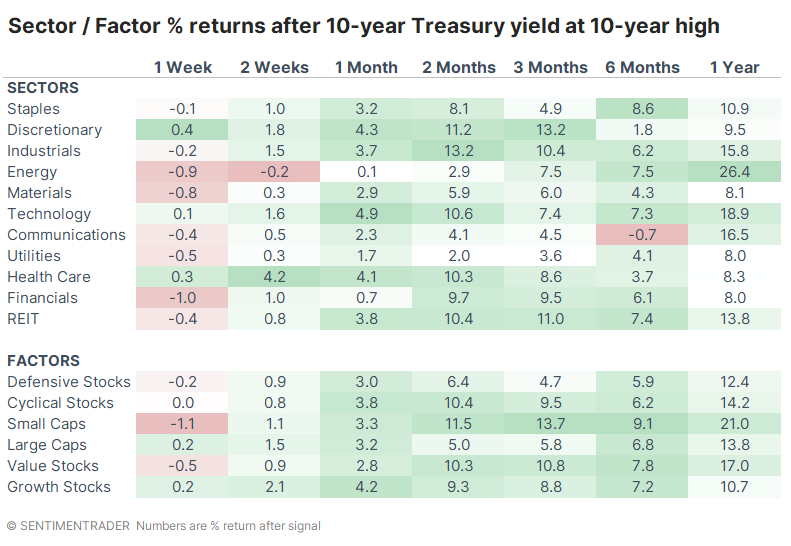
Among sectors and factors, Small-caps enjoyed the best average returns over the next 3-6 months, with Value stocks, REITs, Financials, Industrials, and Discretionary stocks also putting in strong performances. Energy stocks showed the most robust 12-month returns.
Returns were questionable when going back a looooooong time
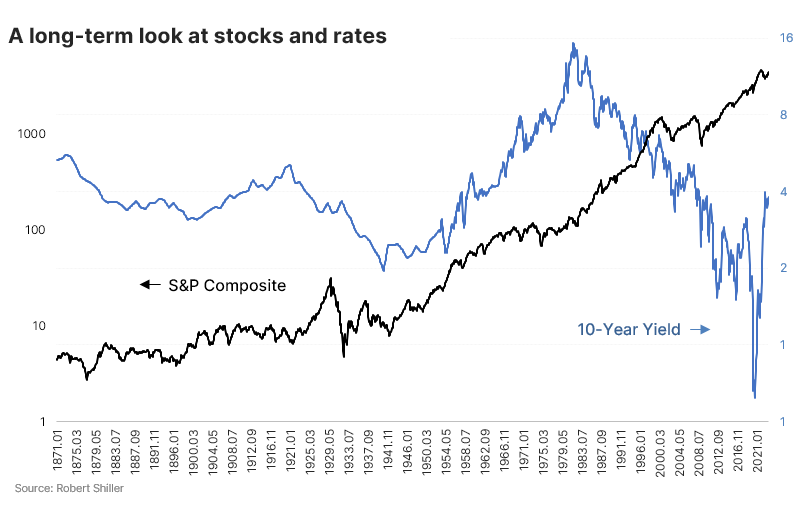
Using monthly closing data from Robert Shiller, we can go back to the 1870s and roughly approximate these conditions to generate a larger sample size. That allows us to incorporate more of the 40-year secular rise in interest rates from the 1940s to the 80s.
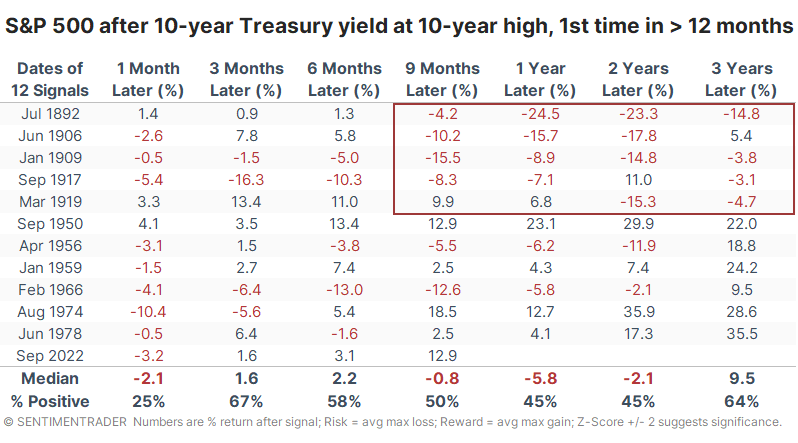
The table below shows long-term returns in the S&P after 10-year yields reached a 10-year high for the first time in at least 12 months. They were not good - before the last six decades, stocks had a hard time showing gains following a big rate breakout. There were only a couple of rallies, while the rest mostly showed double-digit declines over the next year or two.
Granted, during about half of these signals, the primary method of transportation was the horse, and more than half the country lacked indoor plumbing, so there's that.
What the research tells us...
There is no shortage of worries for investors, and after a year like 2022, we will glom onto any factor that might seem likely to wipe away the gains since October. Rising interest rates are a popular bogeyman, but context matters, and most of the anxiety usually lacks empirical support. But major breakouts in the most critical interest rate - the yield on 10-year U.S. Treasuries - have often triggered significant losses. Those have tended to be front-loaded in early decades. During modern markets, the S&P 500 has been unbothered by major yield breakouts, at least over the next six months or so.