Products
SentimenTrader Trading Tools
‍
Backtest Engine
My Trading Toolkit
Correlation Analysis
Seasonality
Market Prediction
Indicators & Data API
‍
Proprietary Indicators & Charts
Market Data API
Strategies & Scanner
‍
50+ Trading Strategies
Smart Stock Scanner
Smart Option Scanner
Research Reports
‍
Research Solutions
Reports Library
Free Resources
Simple Backtest Calculator
Simple Seasonality Calculator
The Kelly Criterion Calculator
Sentiment Geo Map
Public Research Reports
Education
Sentiment Indicators
Technical Indicators
Pricing
Company
About
In the News
Testimonials
Client Success Stories
Contact
Log inLoginSign up
< BACK TO ALL REPORTS

A loss of momentum in a downtrend

Dean Christians
2022-08-23
The MACD indicator, a popular trend-following momentum tool, issued a sell signal for the S&P 500. If an alert occurs when the S&P 500 is down 20% or less from a high, which is the case now, forward returns look significantly worse.

Key points:

  • The MACD indicator triggered a sell signal for the S&P 500
  • At the same time, the 200-day moving average for the S&P 500 is declining
  • After other MACD sell signals, the S&P 500 showed negative returns
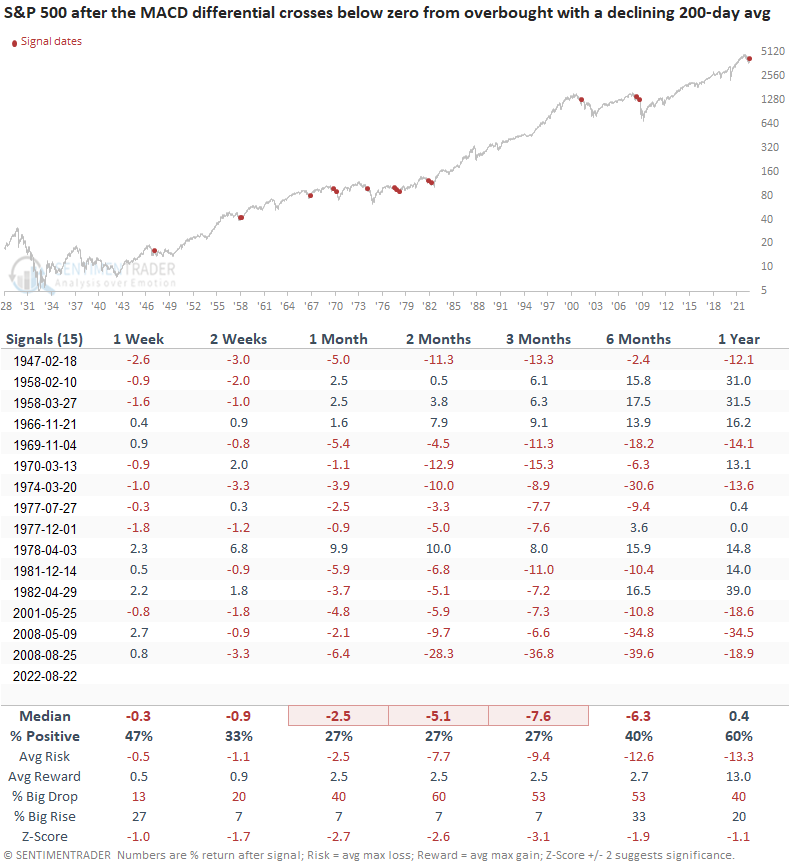
  • If an alert occurs with the S&P 500 < 20% from a high, the outlook is worse

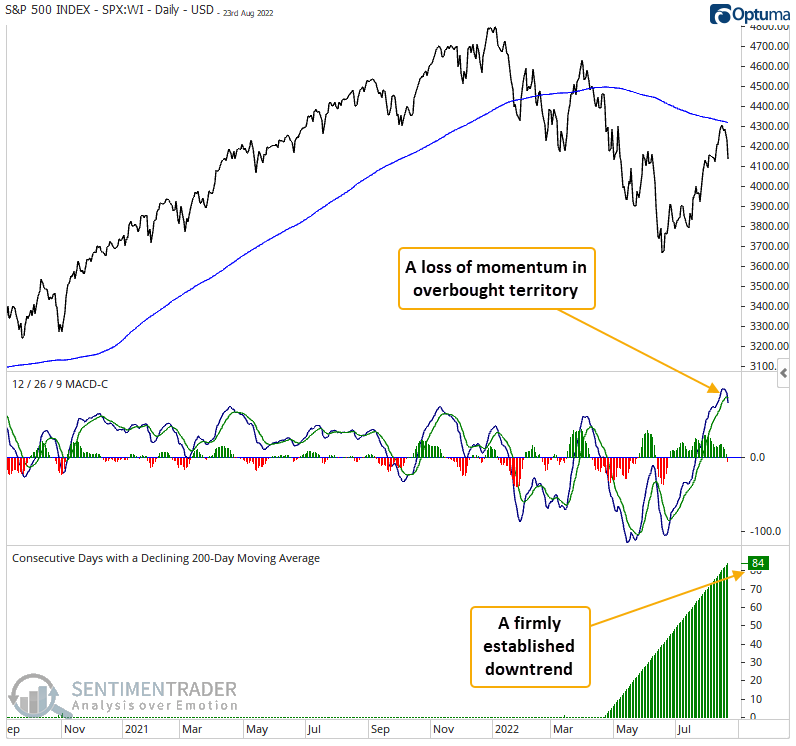
A short-term trend following indicator lost some momentum

The Moving Average Convergence Divergence (MACD), invented by Gerald Appel, is a trend following momentum indicator. On Monday, the differential between the MACD line and its nine-day exponential moving average turned negative, with the MACD line in positive or overbought territory. At the same time, the index remains below the 200-day moving average, and the 200-day has been declining for 84 consecutive days. 

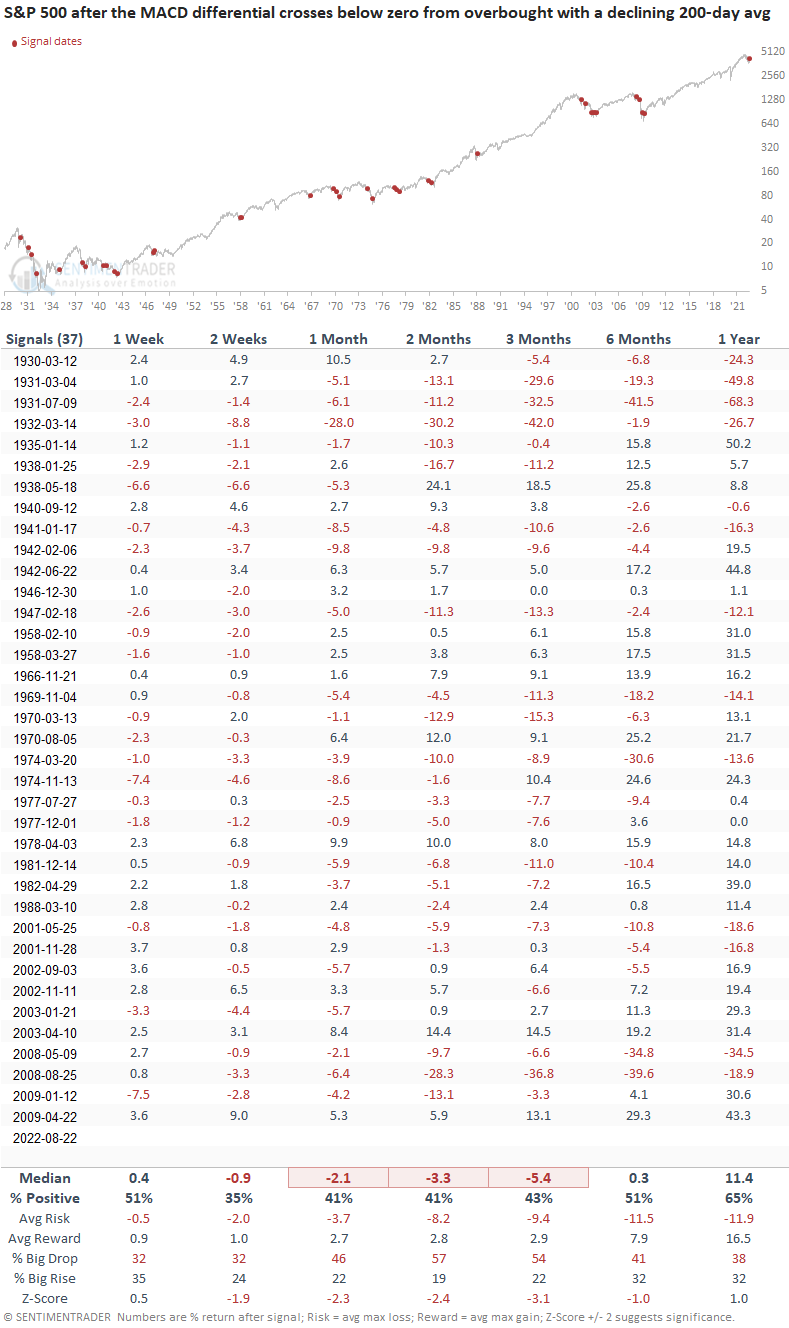
Let's conduct a study to assess the outlook for the S&P 500 when the MACD indicator gives a sell signal under similar conditions. I will lower the successive days with a declining average to 80 sessions to increase the sample size. 

Similar MACD sell signals in a downtrend preceded negative returns

A loss of momentum from overbought territory within an established downtrend looks unfriendly across short to medium-term time frames. The signal shows a loss at some point in the first two months in 29 out of 37 instances. The median return a year later looks favorable as signals that occurred in the later stages of a downtrend show healthy gains. 

Signals that occurred when the S&P 500 was down 20% or less from a multi-year high, which is the case now, show a significantly worse outlook across all time frames. Once again, the first few months look troubling, with a negative return at some point in 13 out 15 instances. 

What the research tells us...

We've had a nice rally off the June lows with several thrust signals showing broad-based participation from index members. The weight of the evidence continues to favor the bulls. However, we always need to keep an open mind and remember that the market can throw us a curve ball from time to time. The rally and loss of momentum in the initial stages of an established downtrend should keep us alert to all possible outcomes.

PRODUCTS
SentimenTrader
Trading Tools
Indicators & Data API
‍
Strategies & Scanner
‍
Research Reports
FREE
RESOUrCES
Simple Backtest
Calculator
Simple Seasonality
Calculator
The Kelly Criterion
Calculator
Sentiment Geo Map
‍
Public Research Reports
‍
Education
Sentiment Indicators
‍
Technical Indicators
‍
Pricing
Bundle pricing
‍
FAQ
‍
Announcements
‍
COMPANY
‍
About
‍
In the News
‍
Testimonials
‍
Client Success Stories
CONTACT
‍
General Inquiries
‍
Media Inquiries
‍
Financial Professionals Inquiries
‍
© 2026 Sundial Capital Research Inc. All rights reserved.
Setsail Marketing
TermsPrivacyAffiliate Program
Risk Disclosure: The information and tools provided are for research and analytical purposes only and are not intended as investment advice. Market analysis involves uncertainty, and outcomes may differ from expectations. Users should conduct their own due diligence and consider their individual circumstances before making any financial decisions. Past performance is not necessarily indicative of future results.

Hypothetical Performance Disclosure: Hypothetical performance results have many inherent limitations, some of which are described below. No representation is being made that any account will or is likely to achieve profits or losses similar to those shown; in fact, there are frequently sharp differences between hypothetical performance results and the actual results subsequently achieved by any particular trading program. One of the limitations of hypothetical performance results is that they are generally prepared with the benefit of hindsight. In addition, hypothetical trading does not involve financial risk, and no hypothetical trading record can completely account for the impact of financial risk of actual trading. for example, the ability to withstand losses or to adhere to a particular trading program in spite of trading losses are material points which can also adversely affect actual trading results. There are numerous other factors related to the markets in general or to the implementation of any specific trading program which cannot be fully accounted for in the preparation of hypothetical performance results and all which can adversely affect trading results.

Testimonial Disclosure: Testimonials appearing on this website may not be representative of other clients or customers and is not a guarantee of future performance or success.