Products
SentimenTrader Trading Tools
‍
Backtest Engine
My Trading Toolkit
Correlation Analysis
Seasonality
Market Prediction
Indicators & Data API
‍
Proprietary Indicators & Charts
Market Data API
Strategies & Scanner
‍
50+ Trading Strategies
Smart Stock Scanner
Smart Option Scanner
Research Reports
‍
Research Solutions
Reports Library
Free Resources
Simple Backtest Calculator
Simple Seasonality Calculator
The Kelly Criterion Calculator
Sentiment Geo Map
Public Research Reports
Education
Sentiment Indicators
Technical Indicators
Pricing
Company
About
In the News
Testimonials
Client Success Stories
Contact
Log inLoginSign up
< BACK TO ALL REPORTS

A look at post-election sector and factor performance - Part III

Jay Kaeppel
2024-11-07
In Part I, we examined performance for specific sectors and factors during the first three months after a U.S. Presidential election. In Part II, we extended the test to six months after an election. We posit a simple strategy in Part III using information from Parts I and II.

Key points

  • In Part I, we looked at sector and factor performance during the first three months after each U.S. Presidential election year since 1944
  • In Part II, we will do the same but look at performance over the first six months after each U.S. Presidential election year
  • In Part III, we lay out a simple post-election "strategy" (such as it is)

A simple strategy for post-election six months 

In Parts I and II, we found that the small-cap and value factors outperformed large-caps and growth in the various S&P 500 sectors. Interestingly, small-caps have done best during the first 63 trading days after a presidential election, and value has done best during the second 63 trading days. So, let's test the following strategy:

  • Long the S&P 500 Small-Cap index for 63 trading days after a Presidential Election
  • Long the S&P 500 Value index for the next 63 trading days after that

For 2024-2025, this would involve:

  • Buying small-caps (ticker IWM) at the close of election day (2024-11-05)
  • Selling small-caps (IWM) at the close on 2025-02-25 and switching into value (ticker VTV)
  • Selling VTV at the close on 2025-05-08 (the 126th trading day after the 2024 election)

At that point, the capital would likely be allocated to some other strategy since the next trading opportunity will not occur until November of 2028.

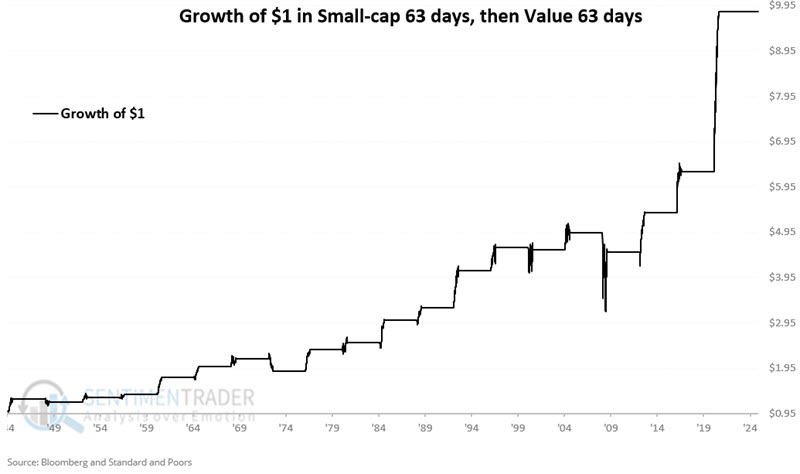
The chart below displays the hypothetical growth of $1 invested using the simple rules listed above.

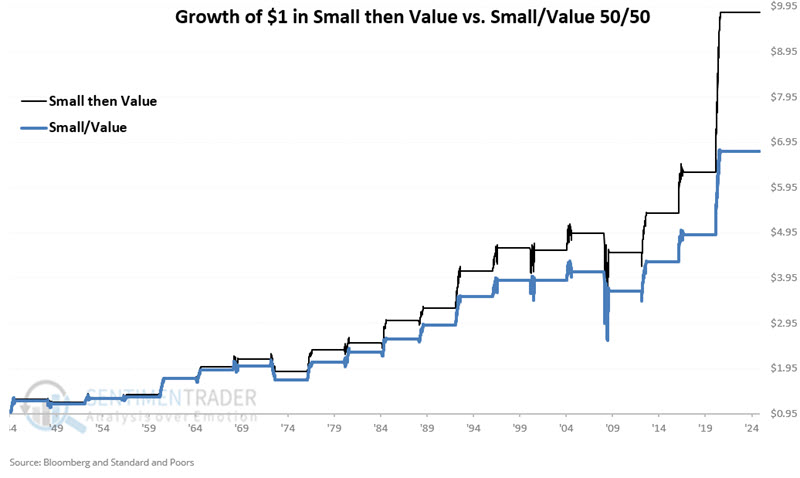
For comparison, the chart below also shows the growth of $1 invested by splitting capital 50/50 between small-cap and value for the entire 126-day period.

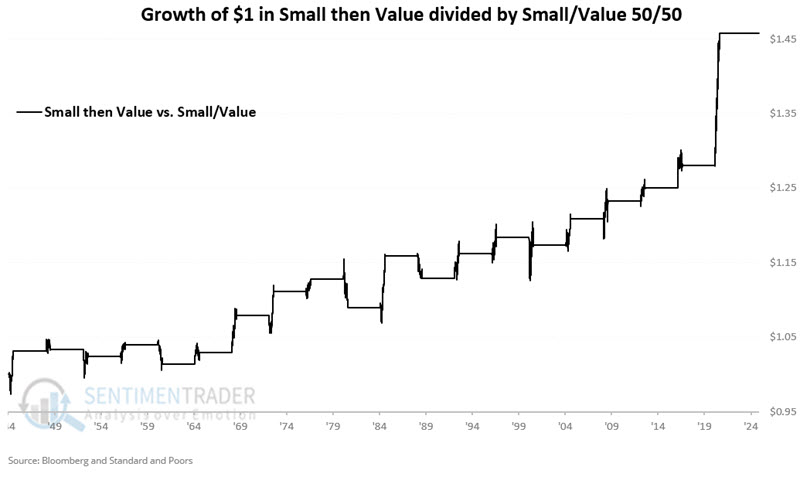
Finally, the chart below divides the two lines above to show the relative performance of the "Small then Value" approach versus the "Split between the two" approach.

Summarizing performance

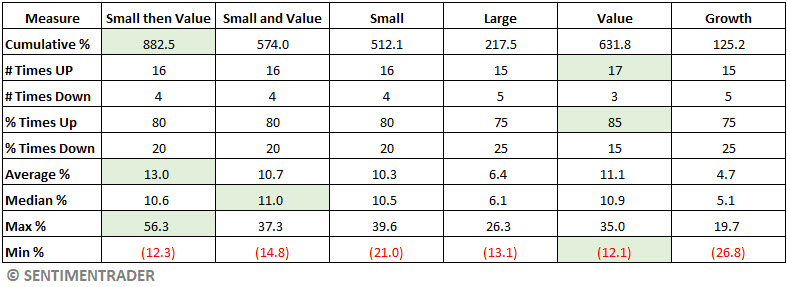
The table below displays 126-day performance for the 126 trading days after each election for the following:

  • Small-cap first 63 days, value for next 63 days
  • 50% Small-cap / 50% Value for 126 days
  • Small-cap only
  • Large-cap only
  • Value only
  • Growth only

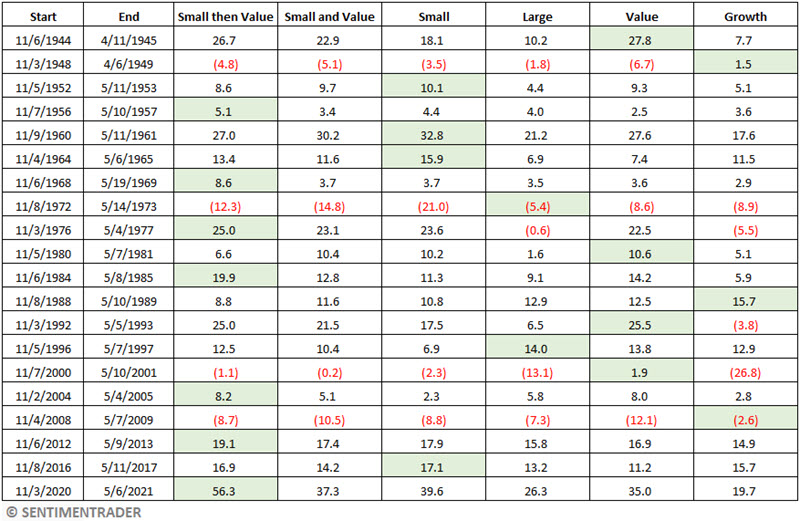
The table below summarizes the results.

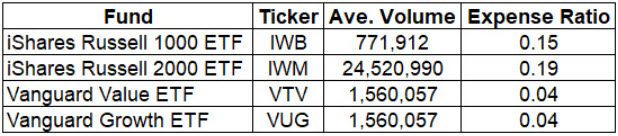
ETFs that track factors

Many ETFs and mutual funds track small-cap, large-cap, value, and growth factors, and investors are encouraged to explore the possibilities independently. The table below offers a "quick and dirty" guide to one choice for each category, with good volume and low expense ratios.

What the research tells us…

The good news is that historical results can be instructive. The bad news is that there is no guarantee that future results will match historical results. Nevertheless, the reality remains that many financial market trends are cyclical, often for reasons that no one can fully explain. Everything in this series falls into this category. Statistically, there can be no debate that small-cap and value factors have consistently outperformed large-cap and growth and most sectors in the months following previous U.S. presidential elections. The (so-called) "strategy" laid out above has historically performed well in the past. How will it do in the future? That remains the open question.

PRODUCTS
SentimenTrader
Trading Tools
Indicators & Data API
‍
Strategies & Scanner
‍
Research Reports
FREE
RESOUrCES
Simple Backtest
Calculator
Simple Seasonality
Calculator
The Kelly Criterion
Calculator
Sentiment Geo Map
‍
Public Research Reports
‍
Education
Sentiment Indicators
‍
Technical Indicators
‍
Pricing
Bundle pricing
‍
FAQ
‍
Announcements
‍
COMPANY
‍
About
‍
In the News
‍
Testimonials
‍
Client Success Stories
CONTACT
‍
General Inquiries
‍
Media Inquiries
‍
Financial Professionals Inquiries
‍
© 2026 Sundial Capital Research Inc. All rights reserved.
Setsail Marketing
TermsPrivacyAffiliate Program
Risk Disclosure: The information and tools provided are for research and analytical purposes only and are not intended as investment advice. Market analysis involves uncertainty, and outcomes may differ from expectations. Users should conduct their own due diligence and consider their individual circumstances before making any financial decisions. Past performance is not necessarily indicative of future results.

Hypothetical Performance Disclosure: Hypothetical performance results have many inherent limitations, some of which are described below. No representation is being made that any account will or is likely to achieve profits or losses similar to those shown; in fact, there are frequently sharp differences between hypothetical performance results and the actual results subsequently achieved by any particular trading program. One of the limitations of hypothetical performance results is that they are generally prepared with the benefit of hindsight. In addition, hypothetical trading does not involve financial risk, and no hypothetical trading record can completely account for the impact of financial risk of actual trading. for example, the ability to withstand losses or to adhere to a particular trading program in spite of trading losses are material points which can also adversely affect actual trading results. There are numerous other factors related to the markets in general or to the implementation of any specific trading program which cannot be fully accounted for in the preparation of hypothetical performance results and all which can adversely affect trading results.

Testimonial Disclosure: Testimonials appearing on this website may not be representative of other clients or customers and is not a guarantee of future performance or success.