
A look at post-election sector and factor performance - Part II

Key points
- In Part I, we looked at sector and factor performance during the first three months after each U.S. Presidential election year since 1944
- In Part II, we will do the same but look at performance over the first six months after each U.S. Presidential election year
- The small-cap and value factors have tended to outperform large-cap and growth factors during the six months after an election
A look at S&P 500 Sectors post-presidential election performance (six months)
We start our test with 1944, the first election year in the post-WWII era. We will measure returns for various sectors and factors during the first 126 trading days (roughly six months) after each presidential election day. Note that before 1953, the stock market was open on Saturday, which counts as a trading day in this test.
The table below displays the performance for each S&P 500 sector during the 126 trading days after each election. The top performer for each period is highlighted in green.
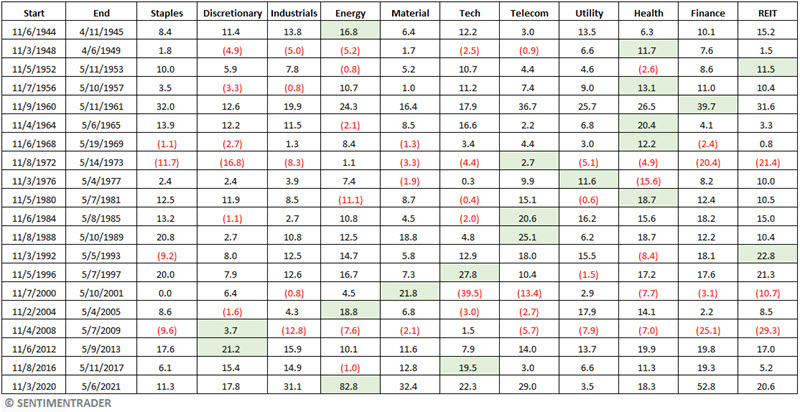
The results are not rhymed or reasoned, but it is worth noting that Staples and Industrials were never the top performers.
The table below summarizes each sector's performance during this post-election period. The top performer for each Measure is highlighted in green.
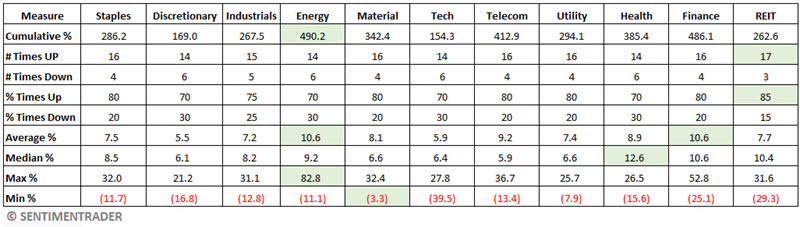
Energy and Finance had the highest cumulative returns; however, Healthcare had the highest median returns. REITs had the highest Win Rate (85%), while five other sectors had a Win Rate of 80%. For the risk-averse, it is interesting to note that the worst six-month loss for Materials was just -3.3%.
Turning to market factors
It is difficult to draw any conclusions regarding sector performance after presidential elections. So, let's focus on the following factors: small-cap, large-cap, value, and growth.
The table below displays the performance for each S&P 500 factor during the 126 trading days after each election. The top performer for each period is highlighted in green.
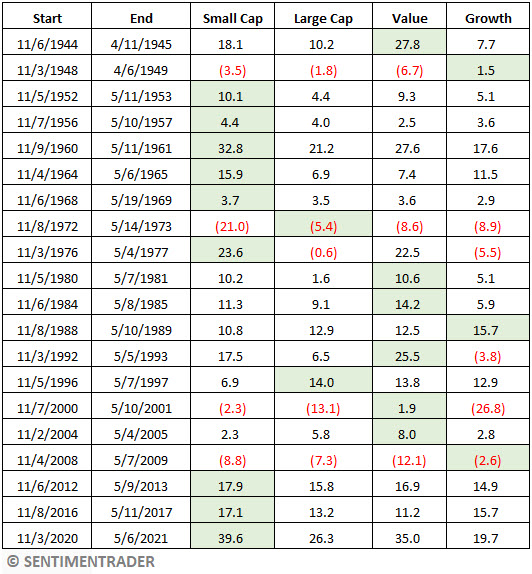
- Note that small-caps were the leading factor nine times, and all of the last three
- Large caps outperformed small caps during 6 of 20 post-election periods but were the top-performing factor only twice
- Value outperformed growth in 14 of 20 periods and was the top performer among all four factors six times
- Growth was the top performer on only three occasions
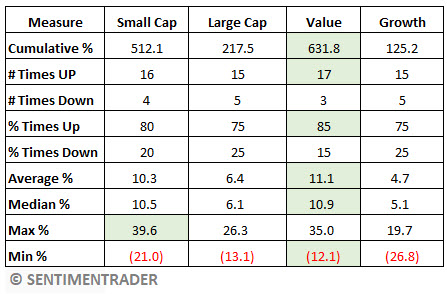
The table below summarizes factor performance from the table above.
As with the sixty-three trading day results in Part I, the 126-day results above present something of a conundrum versus today's market. For several years, large-cap and/or growth stocks have been the top-performing factors, hands down. Is that all going to change over the next six months? It's a reasonable question, albeit one that can only be answered in hindsight.
Combining factors
For this test, we will combine the small-cap factor with the value factor, and combine the large-cap factor with the growth factor, and track cumulative results.
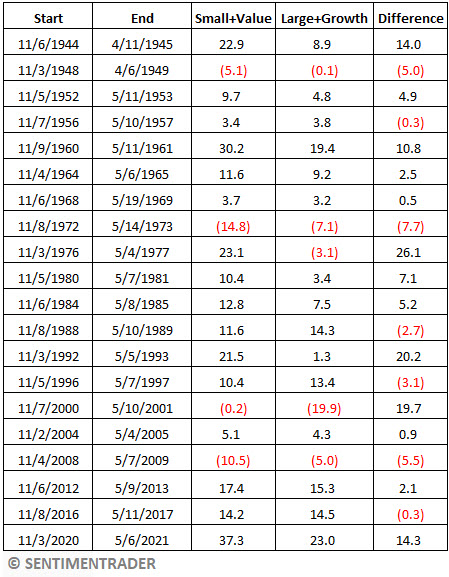
The table below displays the performance for small-cap/value to large-cap/growth. Note that small-cap/value outperformed large-cap/growth in fourteen of twenty periods.
The table below summarizes the performance for each pairing.
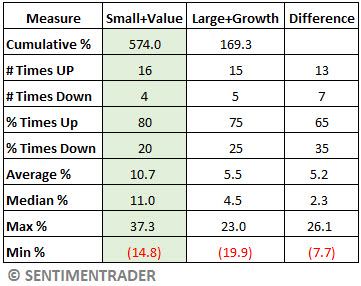
Note that for every performance measure, the small-cap/value pairing outperformed the large-cap/growth pairing during the 126-trading-day post-election period.
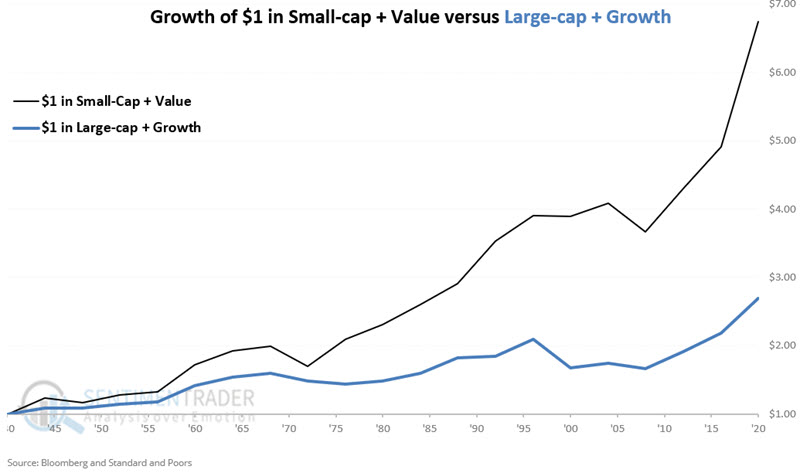
The table below displays the hypothetical growth of $1 split evenly between small-cap and value indexes for 126 trading days after each presidential election (black line) versus the hypothetical growth of $1 split evenly between large-cap and growth indexes for sixty-three trading days after each presidential election (blue line). $1 invested in Small-cap/Value grew to $6.74 versus $2.69 in Large-cap/Growth.
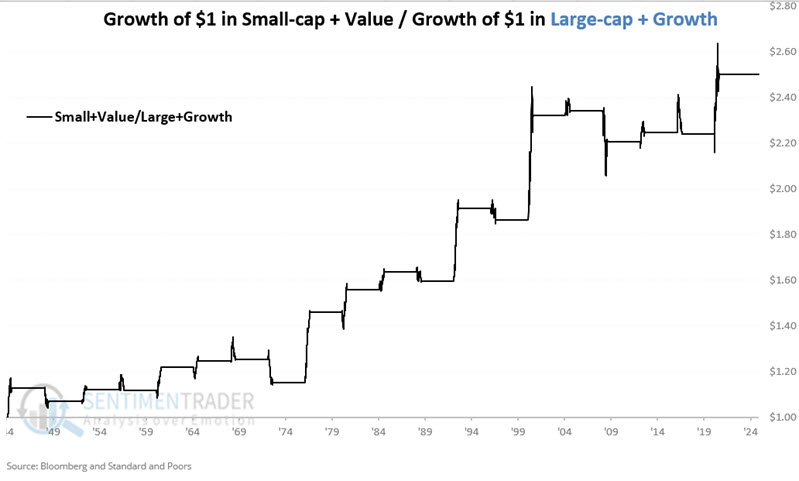
Lastly, the chart below divides the two data series in the chart above to display the relative performance of small-cap+value and large-cap+growth.
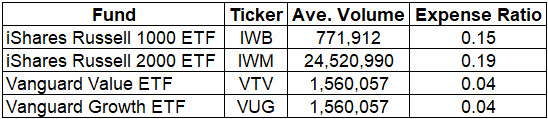
ETFs that track factors
Many ETFs and mutual funds track small-cap, large-cap, value, and growth factors, and investors are encouraged to explore the possibilities on their own. The table below offers a "quick and dirty" guide to one choice for each category, with good volume and low expense ratios.
What the research tells us…
Among sectors, energy showed the largest cumulative gain (+490%) but with only a 70% Win Rate. Among factors, value showed the largest cumulative gain (+632%) with a Win Rate of 85%. If we split the money evenly between small-cap and value, we get a cumulative gain of +574% with a Win Rate of 80%. The question for traders to answer in the near term is, "Is this the time to allocate some capital away from large-cap and/or growth into small-cap and/or value?" History suggests such a move may be worthy of consideration BUT offers no guarantees for the 2024-2025 post-election period.