
A longer-term use for the Market Environment Composite

Key Points
- Our Market Environment Composite (MEC) was designed to help investors assess whether the market is in a healthy or unhealthy state
- The indicators that comprise the composite track various aspects of market behavior, including price movement, breadth, and market internals
- While the MEC is intended to provide a snapshot of the state of the market "here and now", we have discovered a potentially useful longer-term application
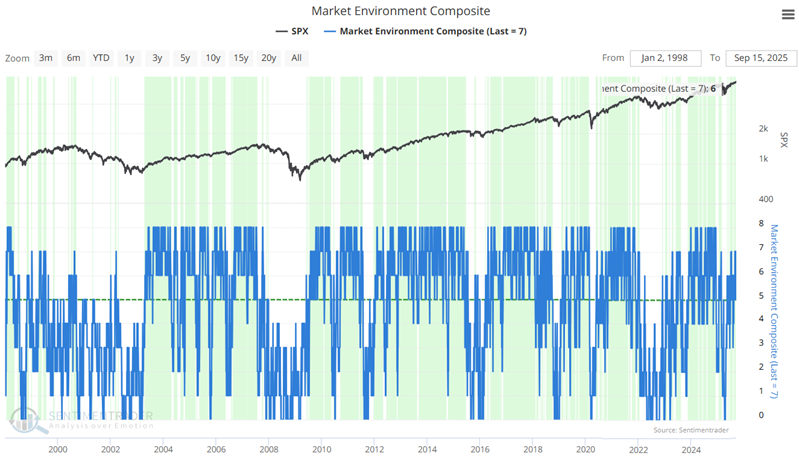
The Market Environment Composite is a snapshot of current market conditions
The Market Environment Composite (MEC) is a set of eight key metrics that provide a snapshot of the overall market condition. These indicators track various aspects of market behavior, such as stock price movements, breadth, and market internals, to help investors assess whether the market is healthy or unhealthy. By monitoring factors like the percentage of stocks above their 200-day moving averages and the McClellan Summation Index, traders can gain insights into the strength or weakness of the broader market.
A healthy reading suggests favorable stock conditions, while unhealthy readings may signal caution. These indicators are not intended for precise market timing but serve as a guide to help adjust exposure based on prevailing market conditions. The market is considered healthy when MEC is five or higher, and unhealthy when MEC is below five.
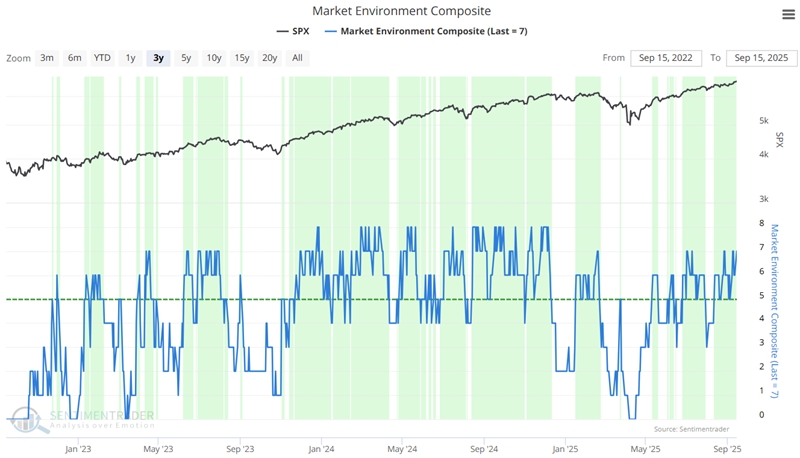
The first chart below shows MEC's full history versus the S&P 500, and the second chart zeroes in on the last three years.
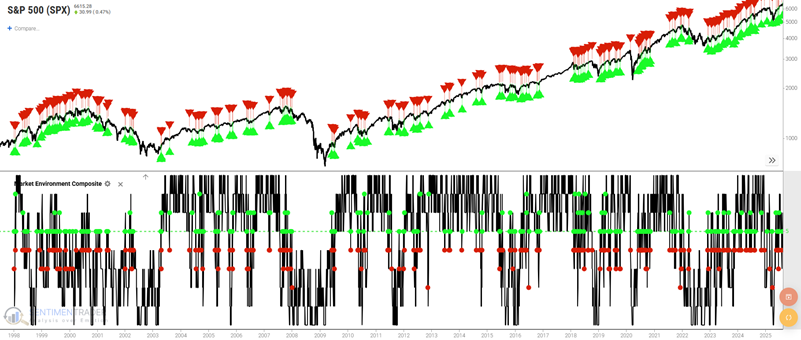
To examine the indicators that comprise MEC, click here. The MEC is not necessarily intended to be used as a standalone trading system, but rather as a weight-of-the-evidence tool to help investors and traders objectively identify the current state of the market. Nevertheless, for the sake of illustration, let's consider a strategy that buys the S&P 500 when MEC reaches five or higher and goes flat when MEC is four or lower.
The chart below highlights the considerable number of back-and-forth trading signals such a strategy would generate.
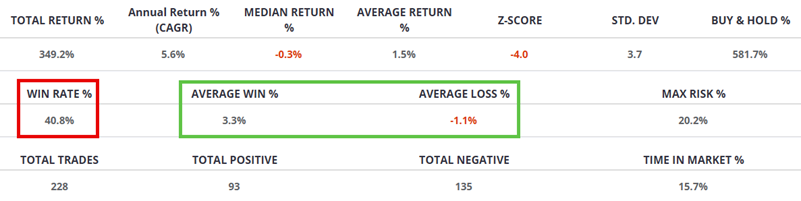
The table below summarizes the results. The Win Rate was only 40.8%, but the Average Win was three times as great as the Average Loss.
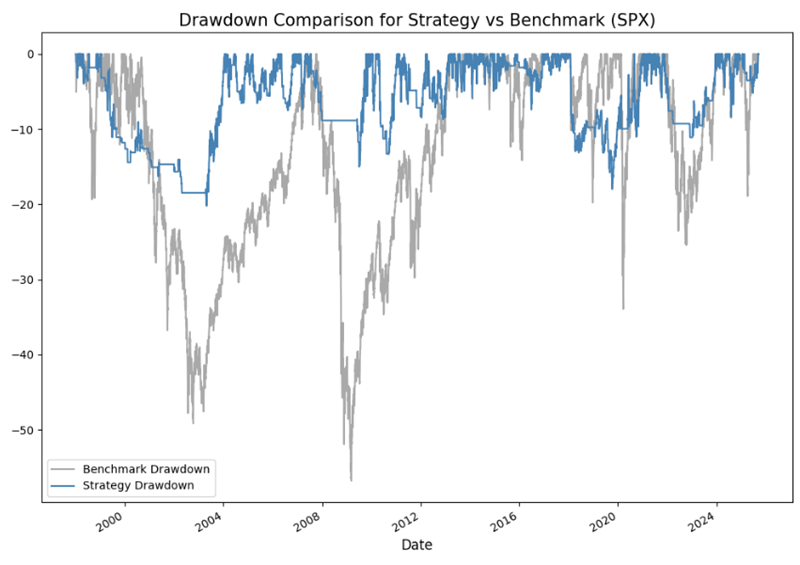
The charts below capture the good and bad news for this hypothetical strategy. The first chart shows that the strategy experienced much lower drawdowns than a buy-and-hold approach, with a maximum drawdown of 20% versus well over 50% for buy-and-hold.
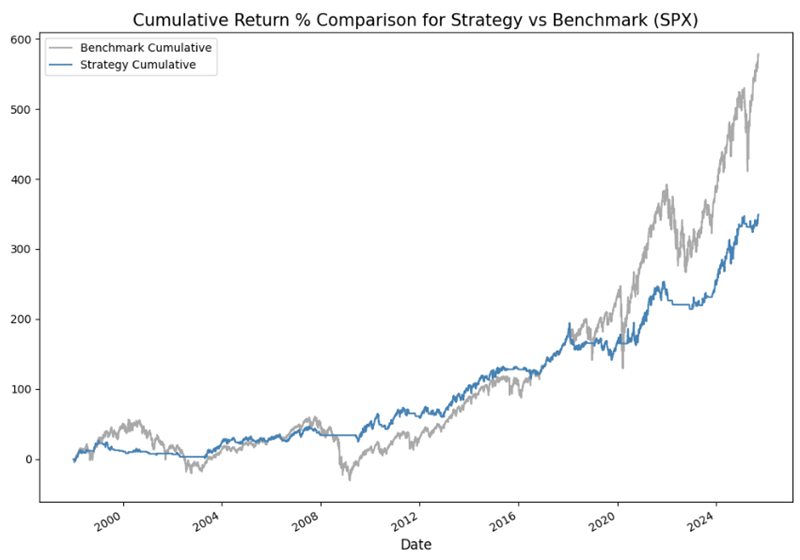
In the chart below, the blue line represents the hypothetical equity curve for the switching strategy, and the grey line represents buy-and-hold. While the blue line experiences smaller drawdowns and lower volatility, it has underperformed a simple buy-and-hold approach.
Now let's consider a different approach to using MEC.
Looking for longer-term trend confirmation via the Market Environment Composite
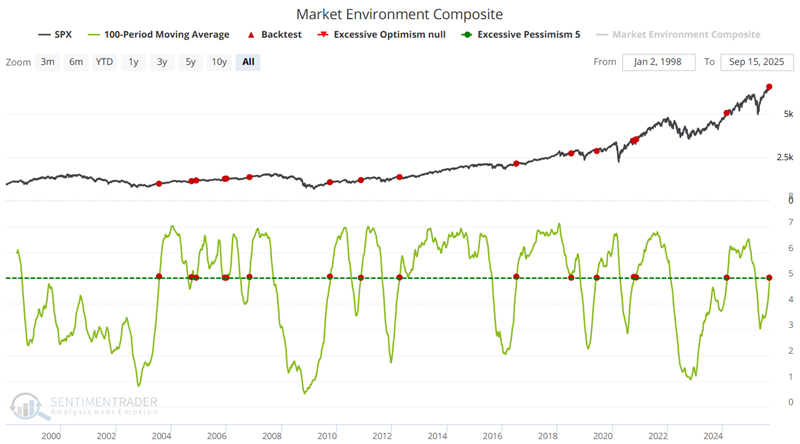
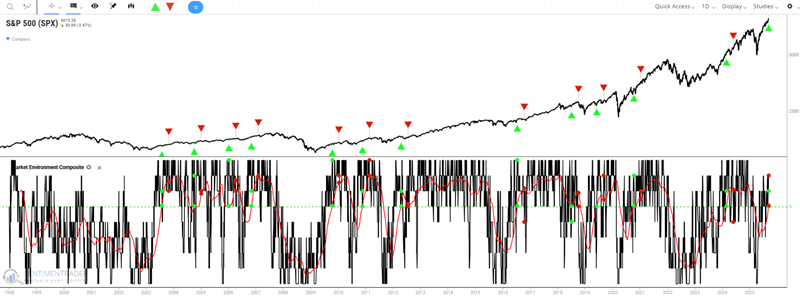
We will examine the Market Environment Composite's 100-day moving average for this test. The chart below highlights all dates (including overlaps) when the MEC's 100-day average crossed above 5. The most recent signal occurred on September 12th.
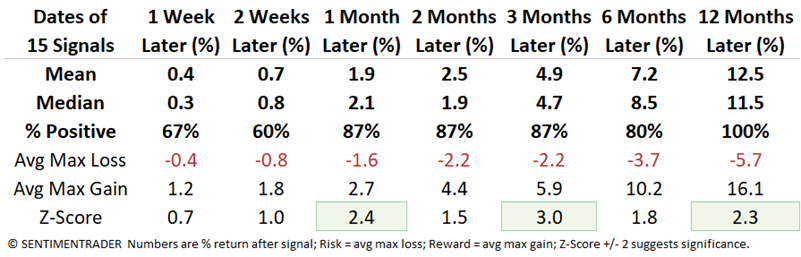
The table below shows SPX performance following each of the dates highlighted in the chart above.
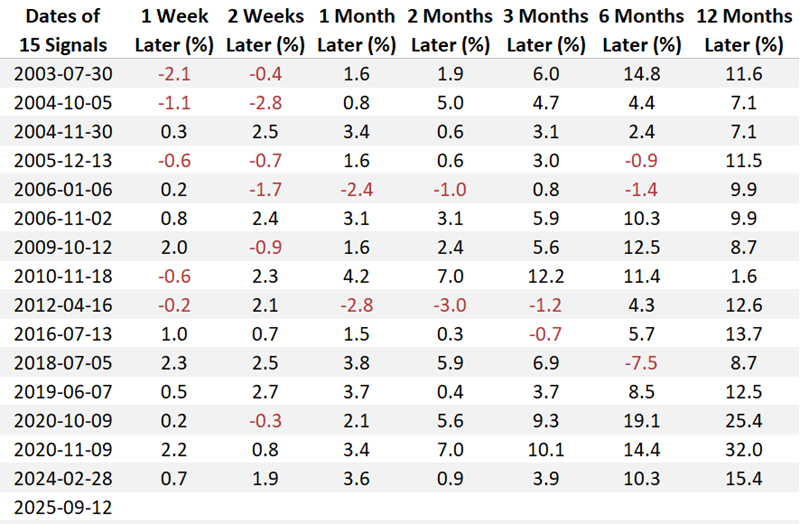
The following table summarizes SPX performance following all signals. The key point is the 80%+ Win Rates for one-month to one-year timeframes.
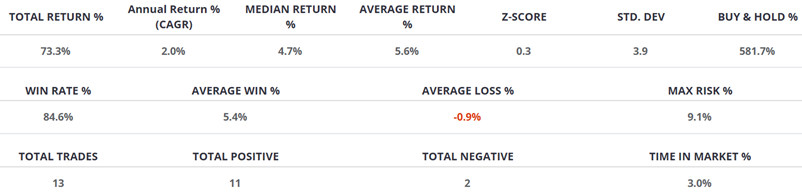
Let's next consider a trading strategy that buys the S&P 500 when the 100-day moving average for MEC crosses above five and holds for three months. The chart below highlights entry and exit dates.
The table below summarizes S&P 500 performance.
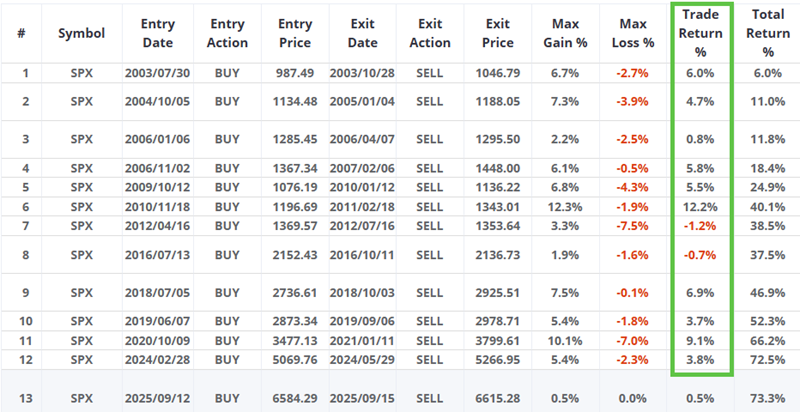
The hypothetical trade-by-trade results appear below.
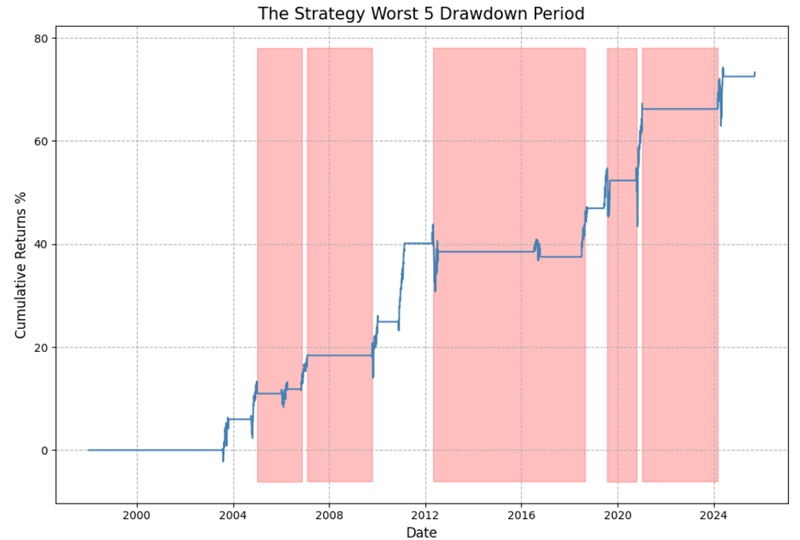
The chart below displays the hypothetical equity curve for this strategy.
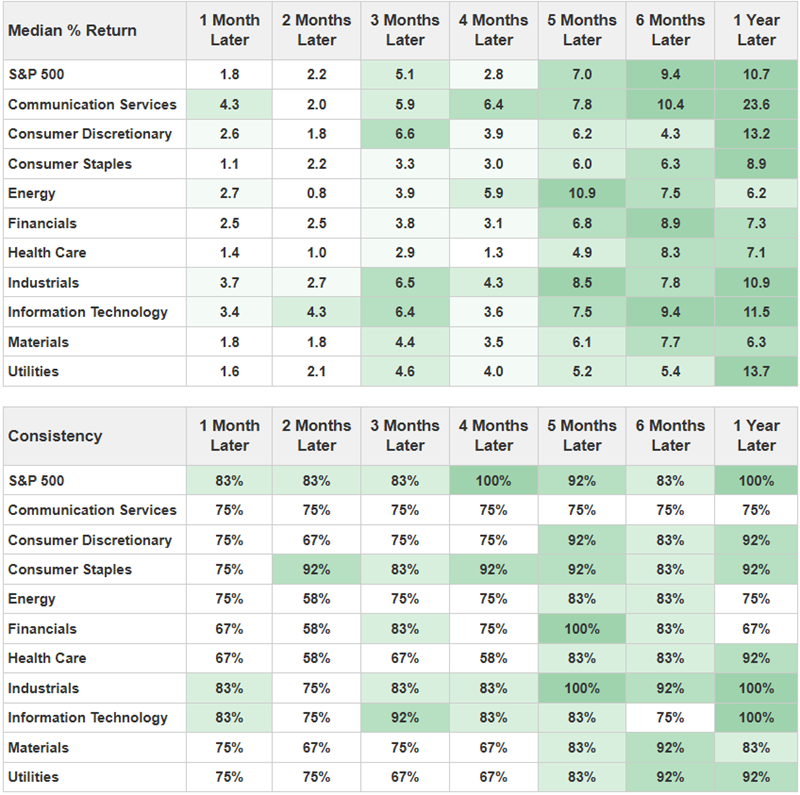
Finally, the table below displays performance for the S&P 500 sectors following the highlighted signal dates.
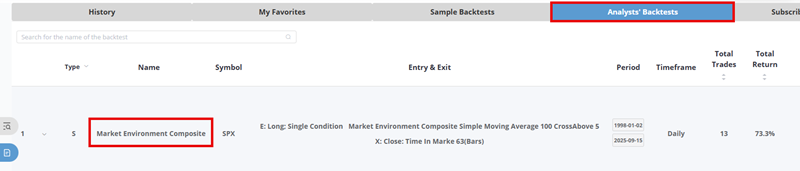
Note that the test above is available in Backtest Edge 2.0 under "Analysts' Backtests".
What the research tells us…
Our Market Environment Composite is intended to provide a real-time snapshot of the market's state. As a standalone indicator, it does a good job of not staying on the wrong side of the market for very long. However, trading in and out based on every cross above and below five is not everyone's cup of tea. A longer-term version, such as the 100-day average detailed here, has potential use for longer-term investors and swing traders. The recent cross above 5 for the 100-day average is an item for the favorable side of the weight of the evidence ledger.