
A long-term momentum indicator turns favorable

Key points
- Momentum can often carry the stock market in a given direction for an extended period of time
- This is especially true when momentum flips from unfavorable to favorable
- One simple but highly effective momentum indicator flashed a new favorable signal at the end of January
LBR Momentum - a long-term momentum indicator
I have long referred to the indicator in question as LBR Momentum. The name is because I learned it many years ago from a presentation by Market Wizard Linda Bradford Raschke. For the record, while I consider her one of the all-time greats, I am not entirely sure she actually "invented" it. In reality, there is not much to invent because it is really just a simple application of two moving averages. Also, in her webinar, she used a daily version to help her with the type of short-term trading she primarily focused on. We will use a much longer-term monthly version for our purpose below.
So what's the "Secret Formula?" (prepare to be underwhelmed):
- S&P 500 three-month moving average - S&P 500 ten-month moving average (both using month-end closing price)
Yep, that's it. Not exactly rocket science. Which seems like a good time to invoke:
Jay's Trading Maxim #7: Rocket science is great. But when it comes to investing, it's not necessarily necessary.
Clearly, the LBR Momentum indicator involves no rocket science.
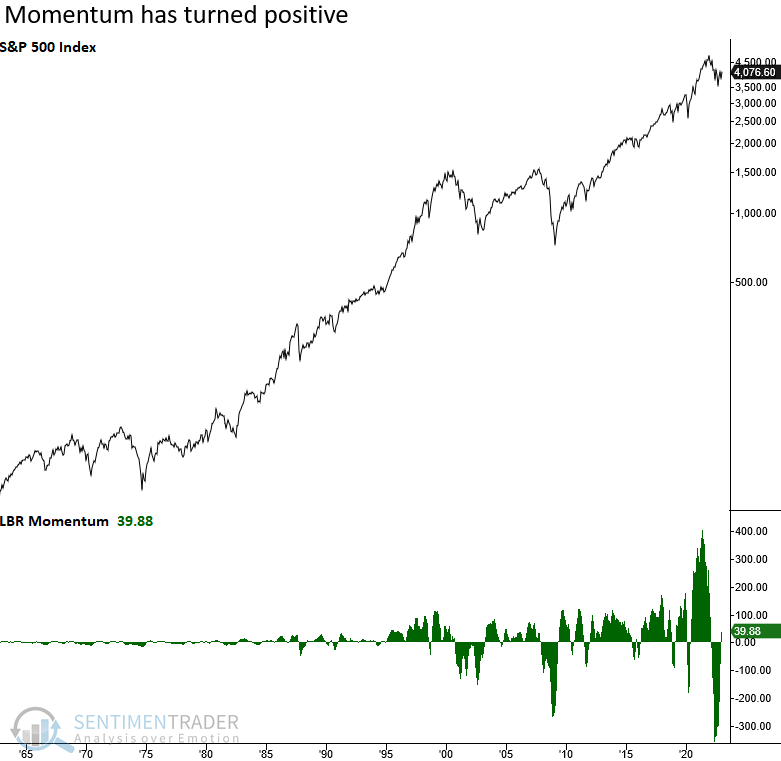
The chart below displays the S&P 500 Index at the top and the LBR monthly indicator at the bottom.
Applying the indicator - Part 1
As you will see, there are different ways to use this indicator, but in a nutshell, above zero is good, and below zero is bad. For our first test, we will consider the results of the following rule:
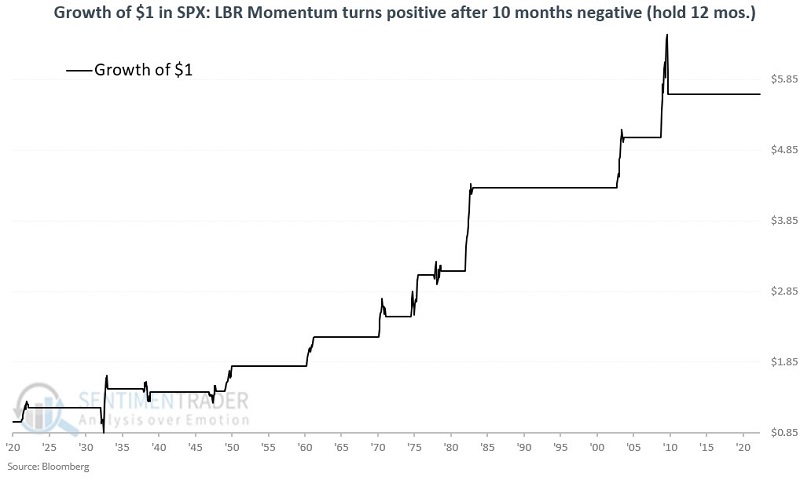
- Buy and hold the S&P 500 Index for 12 months if a) LBR Momentum crosses above zero, b) after being below zero for at least ten months
In this test, we are looking for a prolonged period of market weakness (defined as LBR Momentum below zero for at least ten months) and then a reversal from negative to positive for the LBR Momentum indicator.
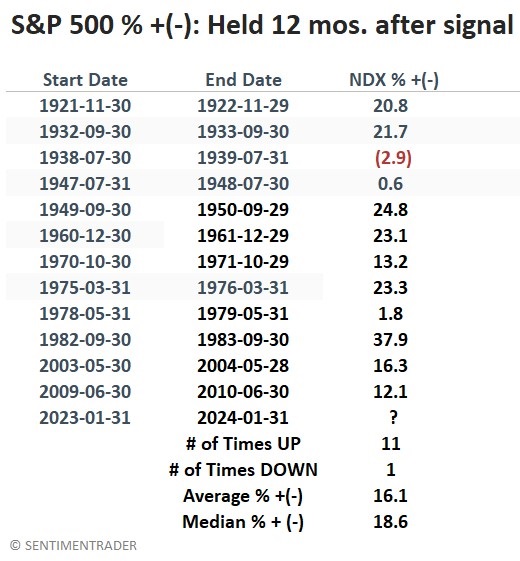
The chart below displays the growth of $1 in the S&P 500 during favorable periods. The table below displays the dates of entry and exit signals and the performance of the S&P 500.
Applying the indicator - Part 2
Now let's loosen the rule a bit. For this test, we will consider the results of the following rule:
- Buy and hold the S&P 500 Index for 12 months if LBR Momentum crosses above zero, regardless of how long it was below zero
Under this rule, we can get overlapping signals. For example, a signal occurs one month, then the LBR Momentum indicator drops back below 0 and then reverses back above 0 again within twelve months of the first signal. In this test, each new cross above 0 resets the holding period to twelve months.
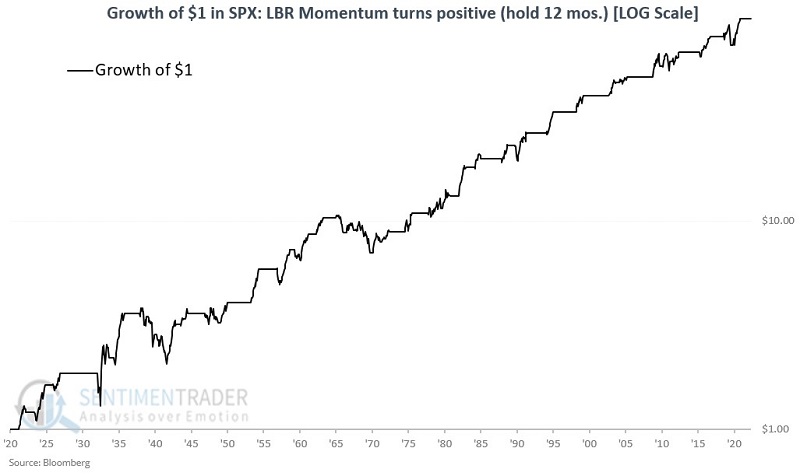
The chart below displays the growth of $1 in the S&P 500 during favorable periods.
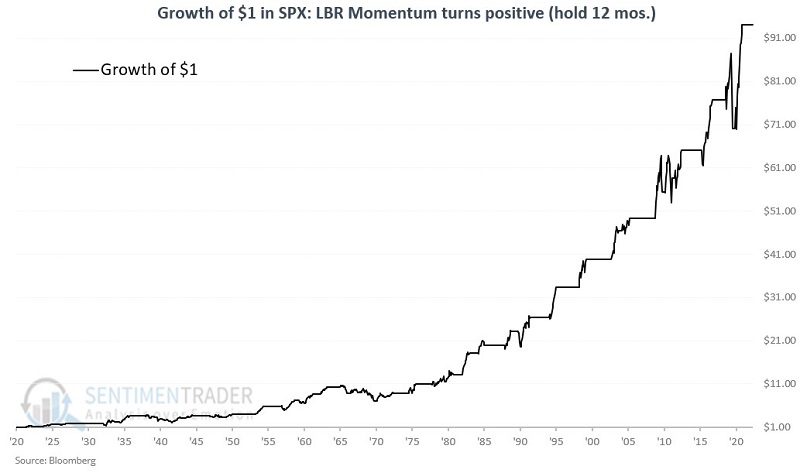
The chart below displays the same results as above but on a logarithmic scale to highlight the relative favorable consistency.
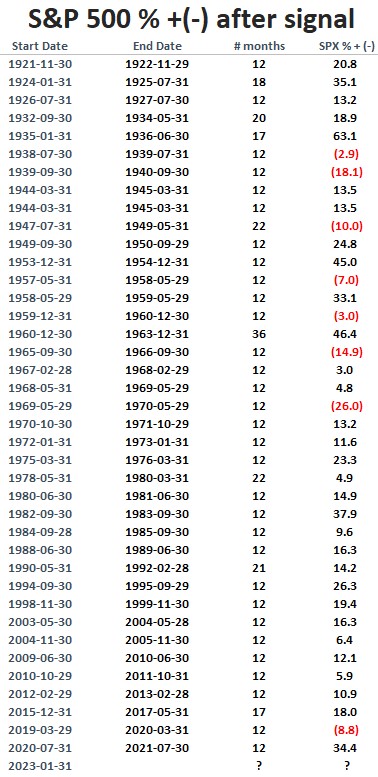
The table below displays the dates of entry and exit signals and the performance of the S&P 500.
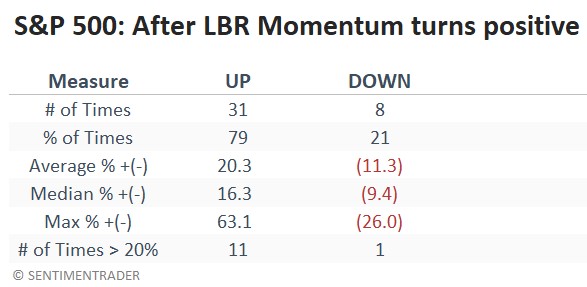
The table below summarizes the performance above.
What the research tells us…
Ironically, the problem with momentum indicators is that they give signals well after a bottom and often in the heat of a significant advance. This can often leave investors feeling uneasy and that they are "chasing the market." But in reality, identifying when momentum is accelerating in the stock market is one of the most fruitful things an investor can do. A cross from negative to positive for the LBR Momentum indicator in no way guarantees a continued market advance. But history suggests that that is the way to bet.