
A long-term approach to assessing interest rate trends

NOTE: The information below is in no way a commentary on the current, volatile state of the financial markets. In the short term, factors are attempting (successfully at the moment) to push interest rates lower. No opinion is offered here as to whether those efforts will persist or not. The note below merely details one objective, long-term approach to attempting to stay on the right side of interest rate trends.
Key points
- Interest rates tend to move in long-term waves
- Identifying the current primary wave can assist bond investors and traders in positioning themselves properly
- Below, we combine treasury yields versus their long-term trend and real interest rates into a simple and surprisingly helpful model
Tools for assessing the trend in interest rates
Falling interest rates lead to higher bond prices and vice versa. Let's take a closer look at a trend-following method for designating the trend for interest rates as "rising" or "falling." We will use two measures:
- The yield on 10-year treasury notes (ticker $TNX) versus its 120-month exponential moving average
- The "real" interest rate (here defined as the 10-year treasury yield minus the inflation rate) versus its long-term average
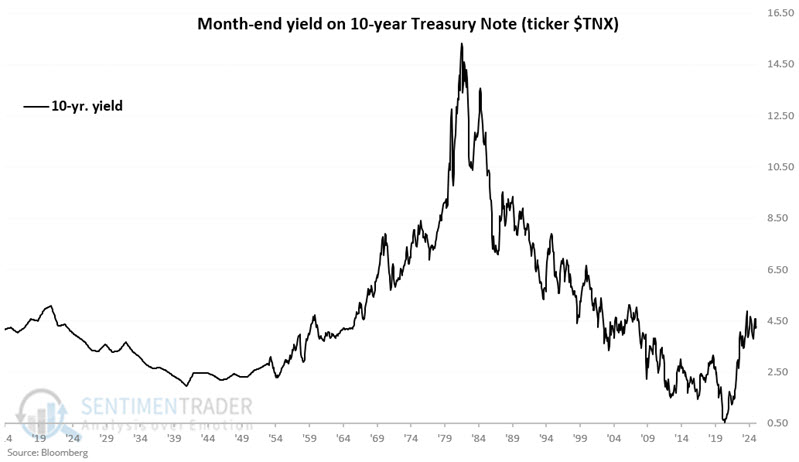
The chart below displays the history of 10-year treasury yields since 1914. We use the month-end value for ticker $TNX.
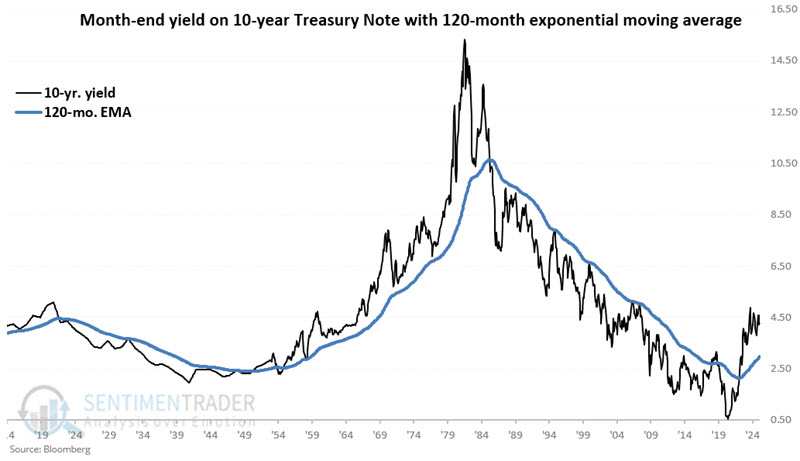
The chart below adds the 120-month exponential moving average of month-end readings. When TNX is above its 120-month EMA, we say rates are rising, and when TNX is below its 120-month EMA, we say rates are falling. As you can see, interest rates have a history of trending in one direction or another for extended periods.
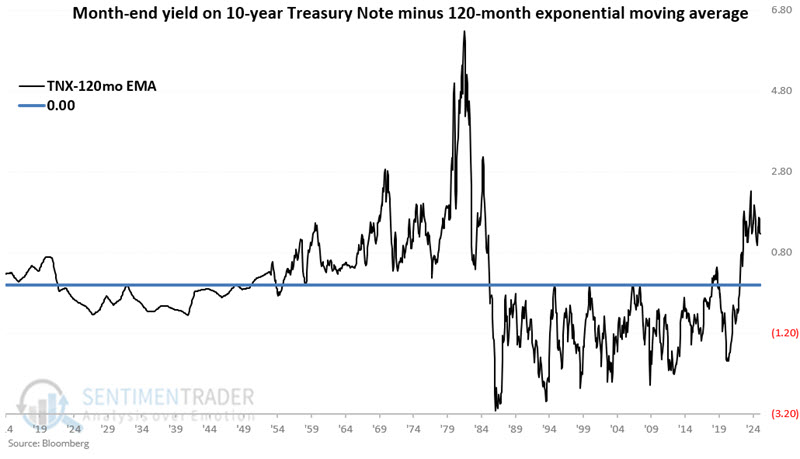
For our purposes:
A = Month-end 10 Year treasury yield ($TNX)
B = 120-month exponential average
C = A - B
The chart below displays Variable C. A positive value for Variable C signifies a rising rate environment and vice versa.
A look at "real" interest rates
For our purpose, the "real" interest rate is the yield on 10-year treasuries minus the 12-month change in the Consumer Price Index (CPI). This measure tells us how much yield we get after inflation. The long-term average is roughly 1.45 points, and the long-term median is about 1.95 points, so we will use the midpoint to set our long-term cutoff at 1.70 points. In other words, a real interest rate above 1.70 is considered "above average," and below is considered "below average."
A = Month-end 10 Year treasury yield ($TNX)
D = CPI 12-month % change
E = A - D (10-yr yield minus CPI inflation = real rate)
F = 1.7 (approximate long-term average of real rate)
G = E - F (current real rate minus approximate long-term average of real rate)
To calculate a simple model for identifying the trend for interest rates, we will make the following calculations at the end of each month:
H = If C >= 0 then H = 2 else H = 0 (i.e., TNX versus 120-month average)
I = If G <= 0 then I =1 else I = 0 (i.e., real rate versus long-term average)
So, at the end of each month, Variable H will be +2 or 0, and Variable I will be +1 or 0.
In English:
- A value of +2 for Variable H indicates an "unfavorable" - i.e., rising rate - environment
- A value of 0 for Variable H indicates a "favorable" - i.e., falling rate - environment
- A value of +1 for Variable I indicates an "unfavorable" - i.e., a negative real yield - environment
- A value of 0 for Variable I indicates a "favorable" - i.e., a positive real yield - environment
- If the overall environment is deemed "unfavorable," we would anticipate higher interest rates
- If the overall environment is deemed "favorable," we would anticipate lower interest rates
Analyzing indicator performance
We will measure the interest rate change by subtracting this month's TNX month-end value from last month's value.
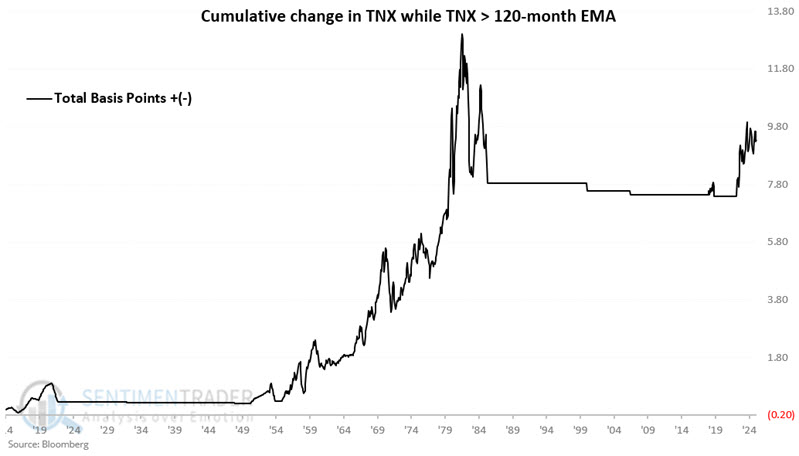
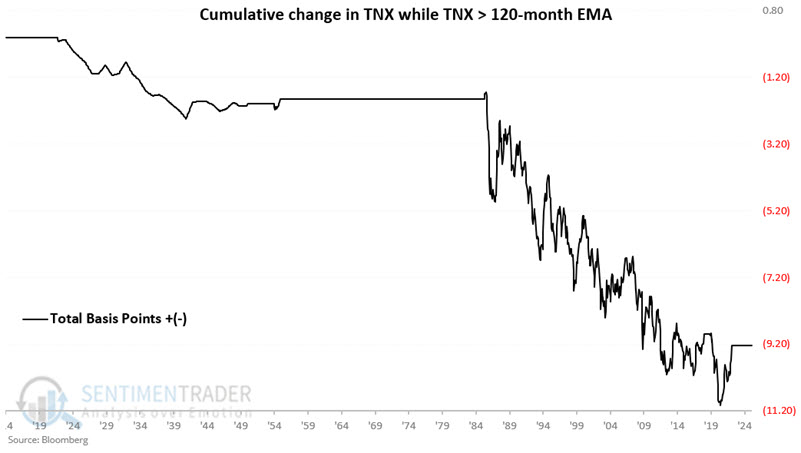
First, consider interest rate trends based on TNX versus its 120-month EMA (Value C). The chart below displays the cumulative movement of interest rates only during months when TNX closed the previous month above its 120-month EMA. Through 2025-03-31, the cumulative total is 9.32 points. In other words, the yield on 10-year treasury notes has increased by a net total of 932 basis points while Value C >= 0. As of 2025-03-31, Variable C = 1.28, thus Variable H = +2 (which will apply to April 2025).
The chart below displays the cumulative movement of interest rates only during months when TNX closed the previous month below its 120-month EMA. Through 2025-03-31, the cumulative total is -9.24 points.
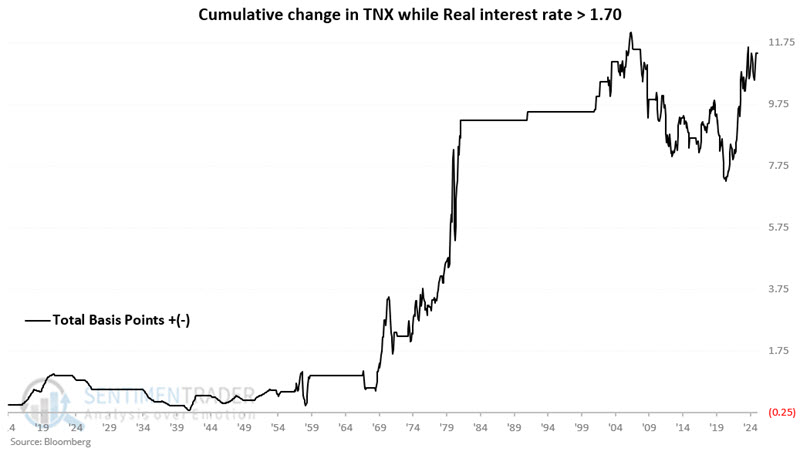
Let's consider real interest rate trends based on our real interest rate indicator (Value G). The chart below displays the cumulative movement of interest rates only during months when Value G closed the previous month below zero. Through 2025-03-31, the cumulative total is 11.42 points. As of 2025-03-31, Variable G = -0.26, thus Variable I = +1 (which will apply to April 2025)
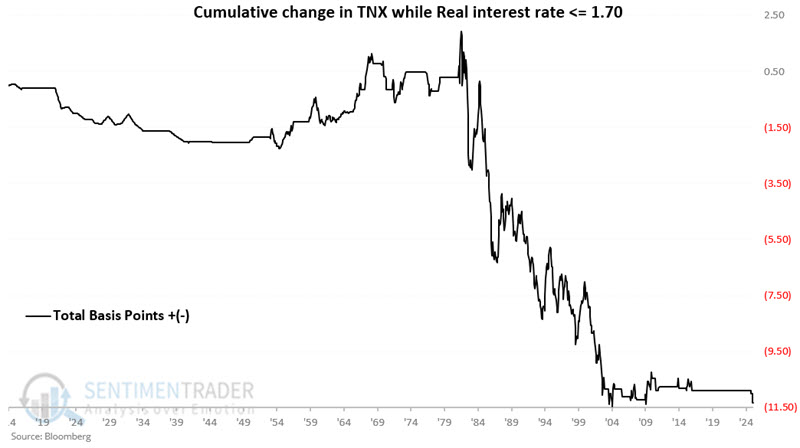
The chart below displays the cumulative movement of interest rates only during months when Value G closed the previous month above zero. Through 2025-03-31, the cumulative total is -11.34 points.
Building a simple model for riding interest rate trends
We will build a simple interest rate model as follows:
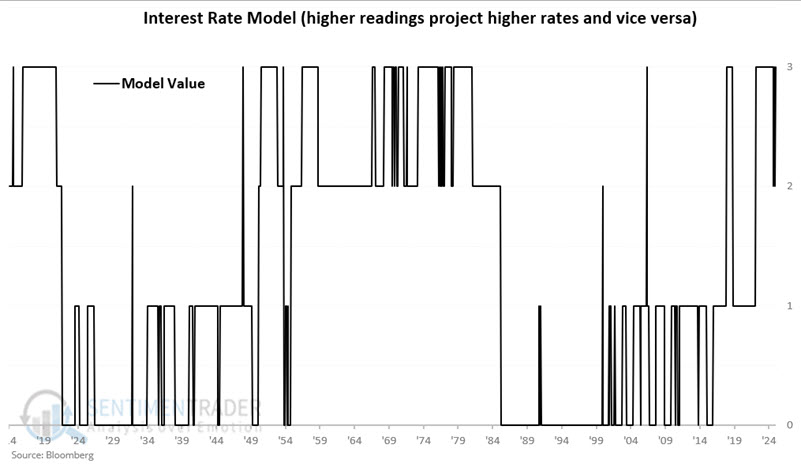
J (Model value) = H + I
Based on the calculations, the model's value can be +3, +2, +1, or 0 at the end of any given month. NOTE: The reading at the end of a given applies for trading purposes to the following month. The chart below displays the value for each month since 1914. The reading on 2025-03-31 = +3, which applies to April 2025.
Let's look at historical results for each reading.
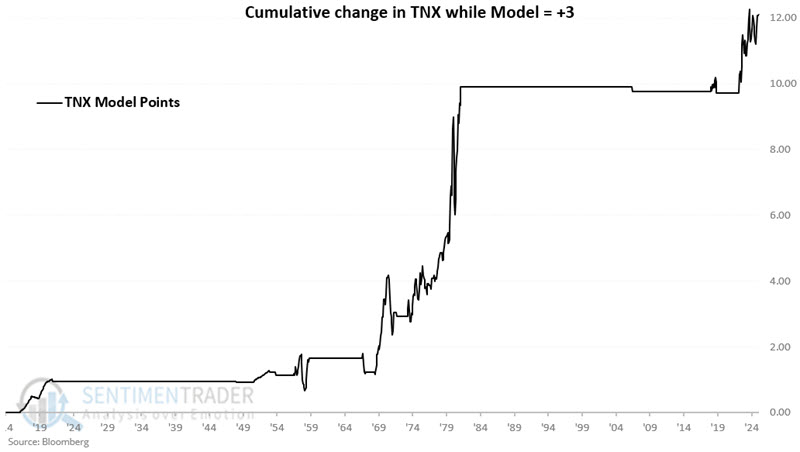
The chart below displays the cumulative movement of interest rates only during months when Value J closed the previous month equal to +3. Through 2025-03-31, the cumulative total is +12.10 points.
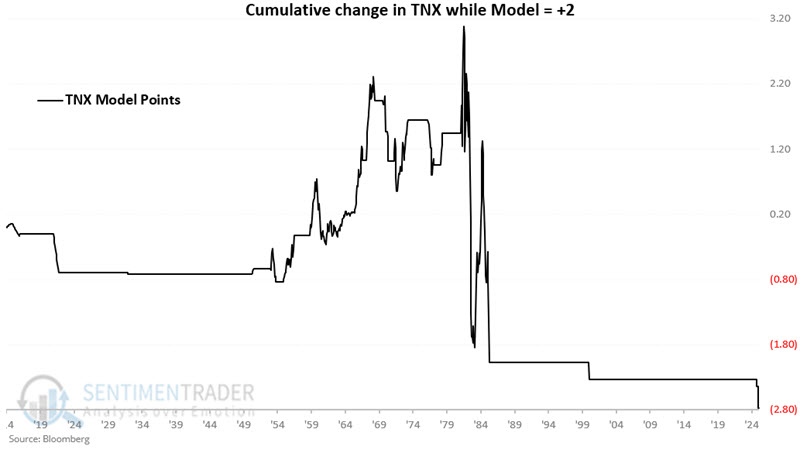
The chart below displays the cumulative movement of interest rates only during months when Value J closed the previous month equal to +2. Through 2025-03-31, the cumulative total is -2.78 points.
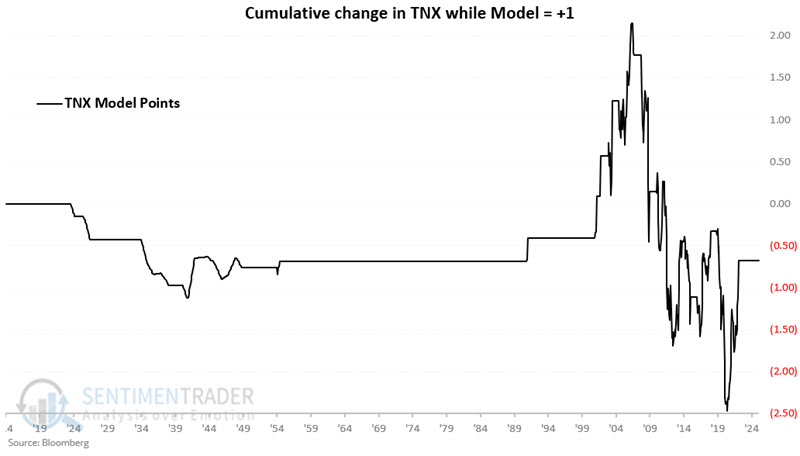
The chart below displays the cumulative movement of interest rates only during months when Value J closed the previous month equal to +1. Through 2025-03-31, the cumulative total is -0.68 points.
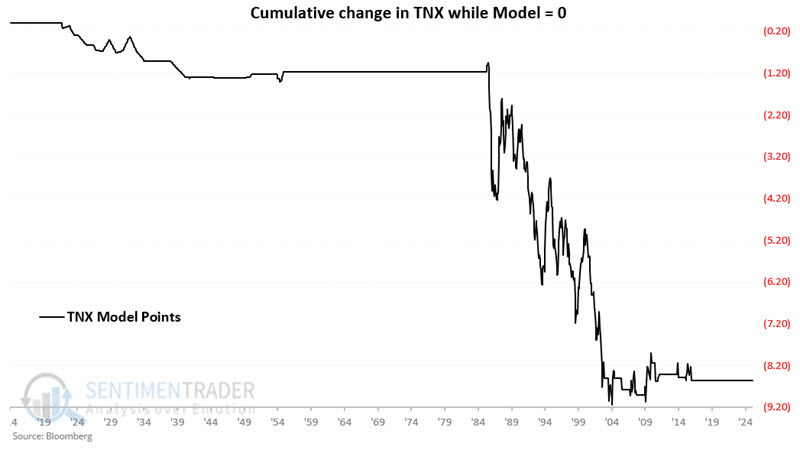
The chart below displays the cumulative movement of interest rates only during months when Value J closed the previous month equal to 0. Through 2025-03-31, the cumulative total is -8.56 points.
In a nutshell, interest rates have tended to rise when the model is = +3 and fall during all other periods. The chart below overlays +3 TNX performance (blue line) with less than +3 TNX performance (orange line).
Potential investing and trading applications
Interest rates have shown a strong tendency to rise when the model = +3 and a strong tendency to fall when the model = 0. While rates have shown a net decline when the model = +2 or +1, results have been much less consistent. With these thoughts in mind:
For a longer-term bond investor, a logical approach would be to hold bonds when the model is below +3 and to avoid bonds (particularly 10-year to 30-year bonds) when the model is equal to +3.
For a trader, the logical approach would be to hold a long position in t-bond futures when the model is equal to zero, to hold a short position in t-bond futures when the model is equal to +3, and to remain flat when the model equals +1 or +2.
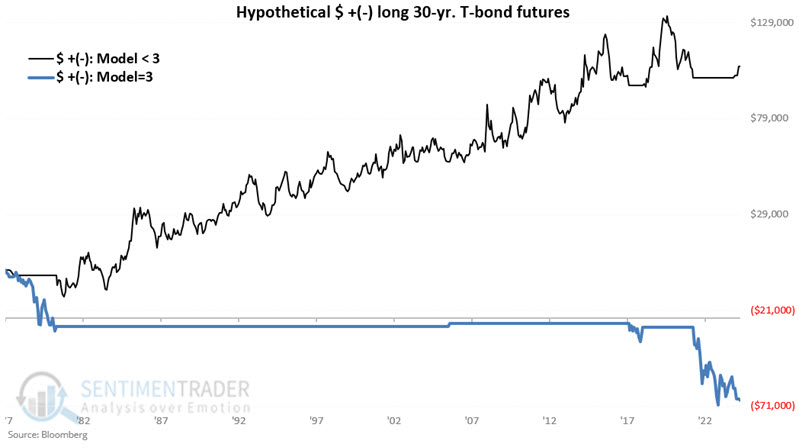
The chart below displays the hypothetical gain or loss from holding a long position in t-bond futures (a 1-point price movement = $1,000 in contract value) depending on whether the model is less than +3 (blue line) or equal to +3 (orange line).
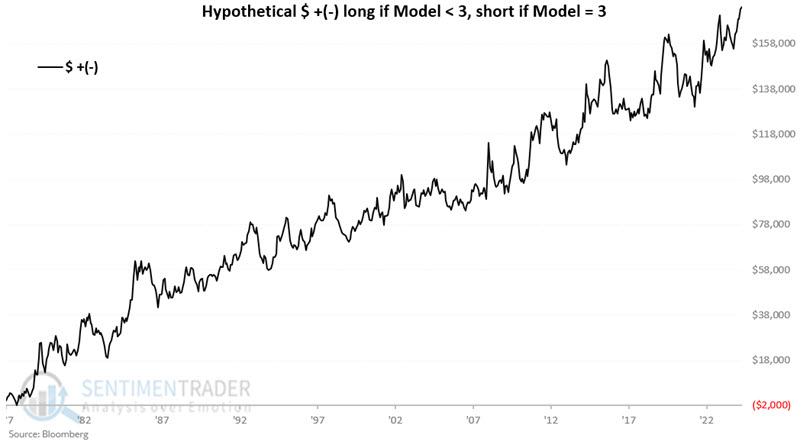
The chart below displays the hypothetical gain or loss from:
- Holding a long position in t-bond futures when the model is less than +3
- Holding a short position in t-bond futures when the model is equal to +3
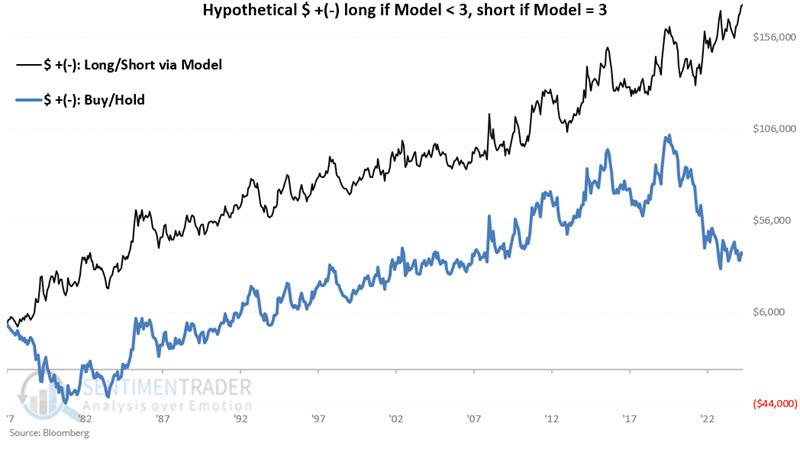
The chart below displays the same results as the chart above with the hypothetical return from a buy-and-hold approach represented by the orange line.
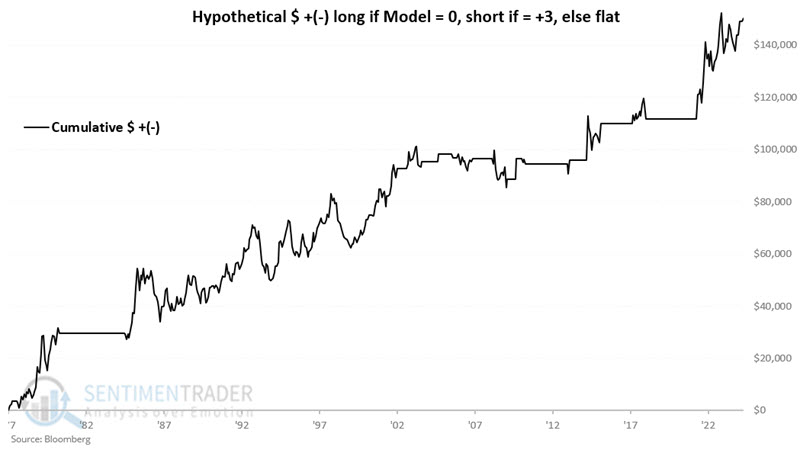
In one last iteration for traders (rather than longer-term investors), the chart below displays the hypothetical gain or loss from:
- Holding a long position in t-bond futures when the model is equal to 0**
- Holding a short position in t-bond futures when the model is equal to +3
What the research tells us…
It is useful to note that interest rates tend to move in long-term waves. For a bond investor, being on the right side of that long-term movement is essential. In all candor, millions of investors likely got hurt holding bonds in the last five years as interest rates reversed higher after declining for almost forty years (and lulling many investors into a false sense of security). In addition, avoiding bonds when the real interest rate is below average also appears to be a good idea.
As of the end of March 2025, the model detailed above stands at an unfavorable +3 (10-year yields are above their 120-month exponential moving average, and real rates are below their long-term average). This does not guarantee higher interest rates in the near term (and, by extension, lower bond prices). Long-term treasury bonds could rally strongly in the interim as a) they retrace some of the massive ground lost since 2020 and b) political forces attempt to force interest rates lower. But that is a (potential) opportunity for short-term "traders" willing to countertrend trade.
Overall, the results above suggest that longer-term bond "investors" remain cautious (i.e., stick to less volatile shorter-term securities) and that bond traders focus primarily on opportunities to trade the short side.