
A long cycle from last spring's massive participation in long-term uptrends

Key points:
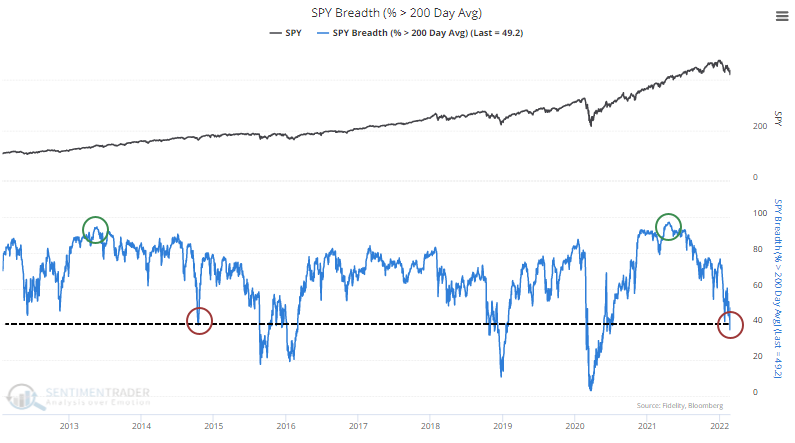
- Last spring, more than 90% of S&P 500 members traded above their 200-day moving averages
- After last week's selling pressure, that figure dropped below 40%
- Long cycles from above 90% to below 40% consistently preceded rebounds in the S&P
From more than 90% of stocks above average to fewer than 40%
Last spring, stocks had one of their best months in history. As we saw at the time, such broad-based buying interest across a wide variety of stocks within the S&P 500 has had a strong tendency to continue in the months ahead, which followed through yet again.
Participation within the S&P peaked in April of last year, with more than 95% of stocks in the index trading above their 200-day moving averages. That was one of the most extreme readings in nearly 100 years.
With the latest leg down last week, that figure eroded significantly, with fewer than 40% of stocks holding above their long-term averages. As we note consistently, healthy markets tend to see this metric hold above 60%, with dips below 40% attracting buyers. So far, that's been the case, but it would be better if we saw this rebound (and hold) above 60%.
Dean noted on Monday that it was a relatively quick reversal from more than 80% of stocks holding above their average to fewer than 50%. Quick reversals above and below those thresholds had a decent track record of preceding rebounds.
If we expand the thresholds to include the extremes over the past year, then the table below shows every time the S&P 500 went from having more than 90% of its member stocks above their 200-day averages to fewer than 40%.
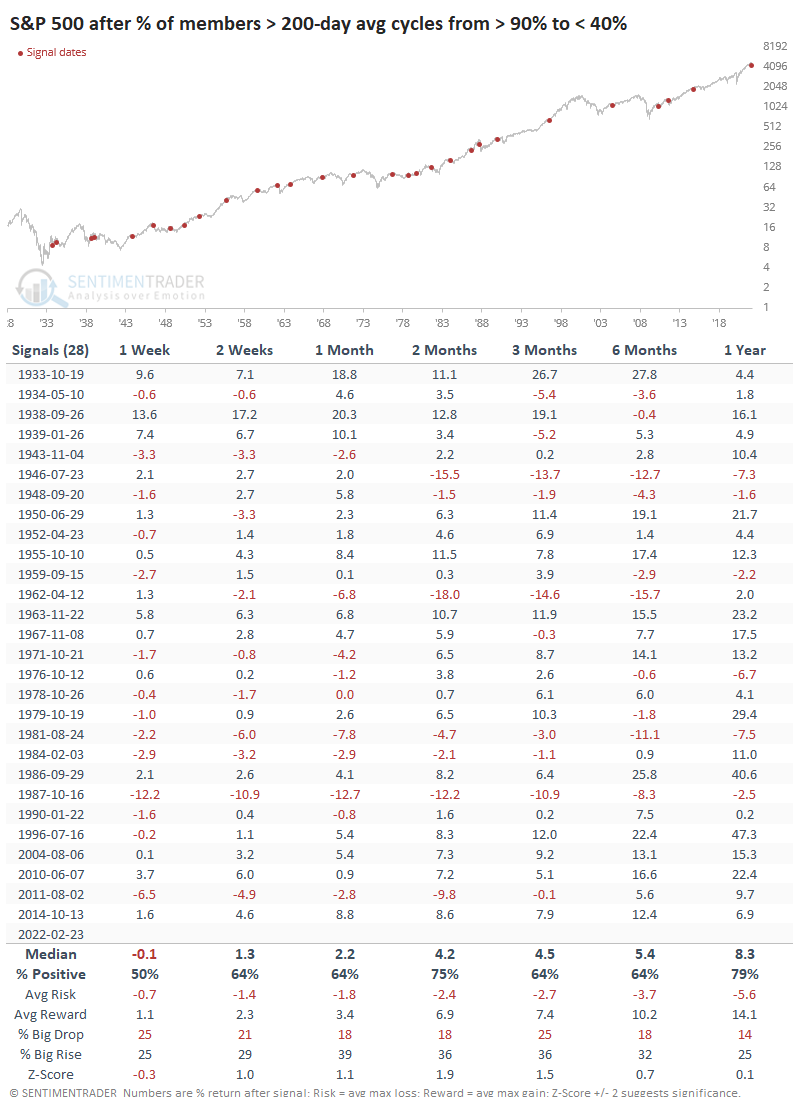
Returns were okay, modestly above any random return. But there were some hefty losses in there, too.
Curiously, it has taken a long time to see this cycle play out. While the trip from above 80% to below 50% happened in under 30 days, it has taken more than 6 months to go from above 90% to below 40%, just like it did in 2014. This tells us that after the massive participation last spring, buyers have been relatively intent on staying involved. Turns out, that's a pretty good sign.
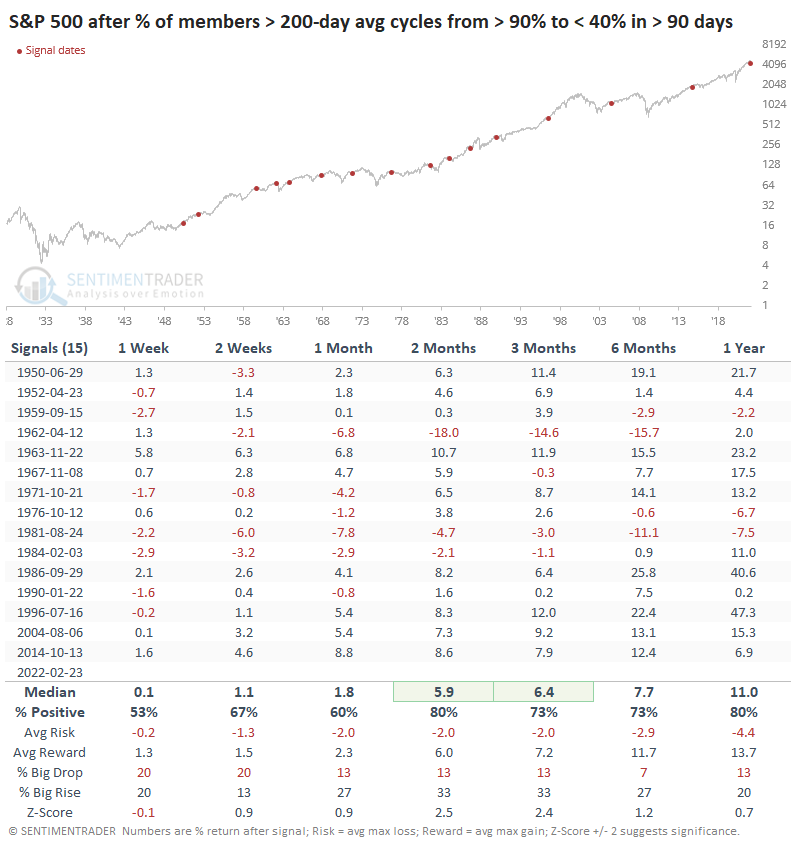
Once we saw fewer than 40% of stocks holding above their 200-day averages, the S&P rebounded consistently over the next 2-3 months and beyond, with a good median return and risk/reward ratio. There was a severe loss in 1962 that took a year to recover, and the signal in 1981 wasn't great, either. Other than that, returns were quite good.
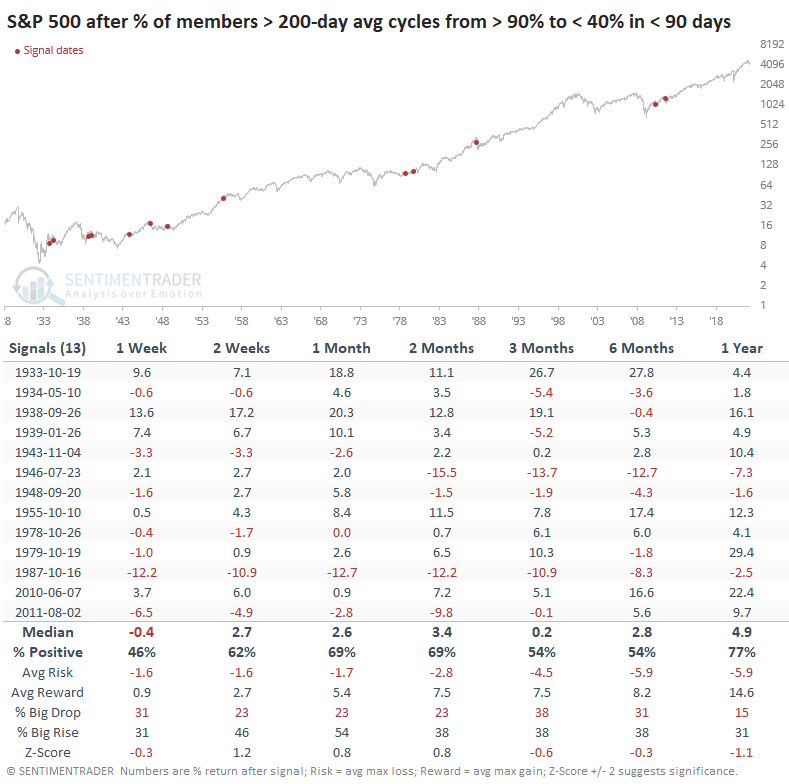
It's notable how much worse the medium-term returns were when it took fewer than 90 days to cycle from above 90% participation to below 40%. These quicker and more severe bouts of selling had more of a tendency to persist in the months ahead.
What the research tells us...
A little less than a year ago, stocks were having one of their best stretches in history. Momentum was incredible, and it was extremely broad-based. There has been internal churn since then, and the last week of semi-panic selling pressure caused even formerly well-bid stocks to decline below their 200-day averages. When we see a long cycle from extremely high participation to below-average levels, it has tended to serve as a decent signal that buyers were about to return, pushing stocks higher for the next 2-3 months.