Products
SentimenTrader Trading Tools
‍
Backtest Engine
My Trading Toolkit
Correlation Analysis
Seasonality
Market Prediction
Indicators & Data API
‍
Proprietary Indicators & Charts
Market Data API
Strategies & Scanner
‍
50+ Trading Strategies
Smart Stock Scanner
Smart Option Scanner
Research Reports
‍
Research Solutions
Reports Library
Free Resources
Simple Backtest Calculator
Simple Seasonality Calculator
The Kelly Criterion Calculator
Sentiment Geo Map
Public Research Reports
Education
Sentiment Indicators
Technical Indicators
Pricing
Company
About
In the News
Testimonials
Client Success Stories
Contact
Log inLoginSign up
< BACK TO ALL REPORTS

A Little Panicky

Jason Goepfert
2018-10-11
null

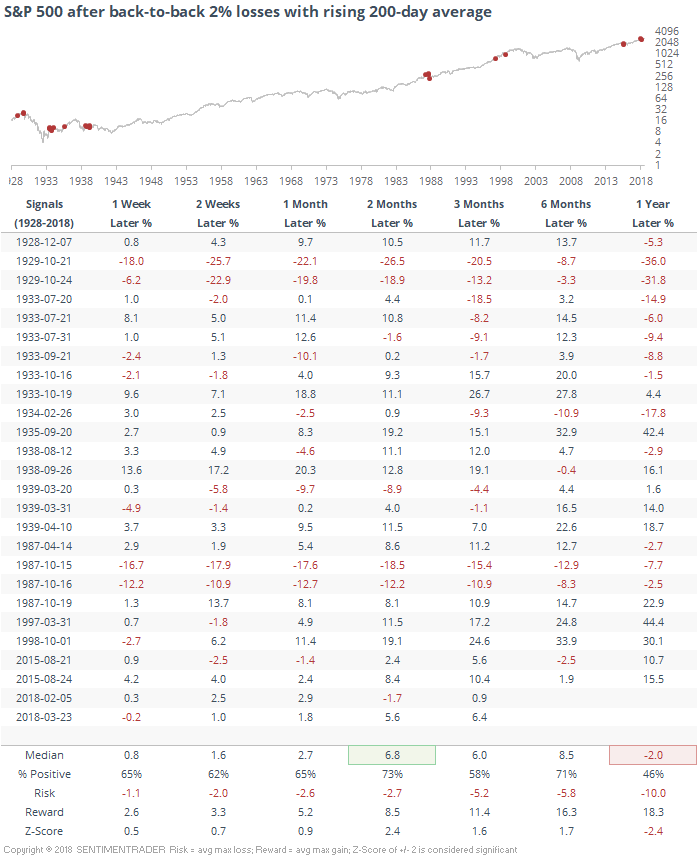
With a failed bounce attempt intraday, we're starting to register a few more signs of notable pessimism or even outright panic. It's understandable, since this would be one of the few times in modern markets when the S&P 500 suffered back-to-back 2% losses during a generally uptrending market.

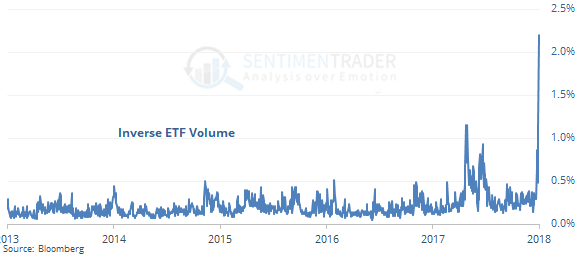
As a result of the selling, volume into inverse ETFs has exploded. Yesterday barely set a record, but today is on track to blow that out of the water. This could change quite a bit by the close, but still.


As the afternoon selling reached its climax (so far), a majority of securities on the NYSE traded on a downtick (lower than their last trade price). Nearly 1800 securities traded on a downtick vs uptick, the 2nd-most extreme reading in a decade. This suggests either outright panic on the part of investors or (more likely) a series of automated program trades.

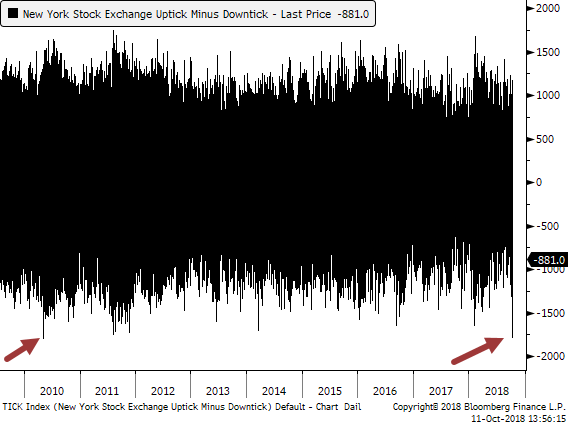
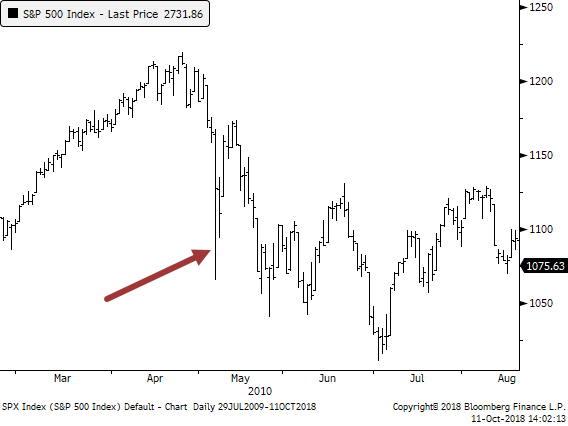
The only day with a lower TICK was May 6, 2010. The setup was fairly similar then, too, as traders panicked following what had been a steady uptrend. It led to a quick bounce, then testing of the low.

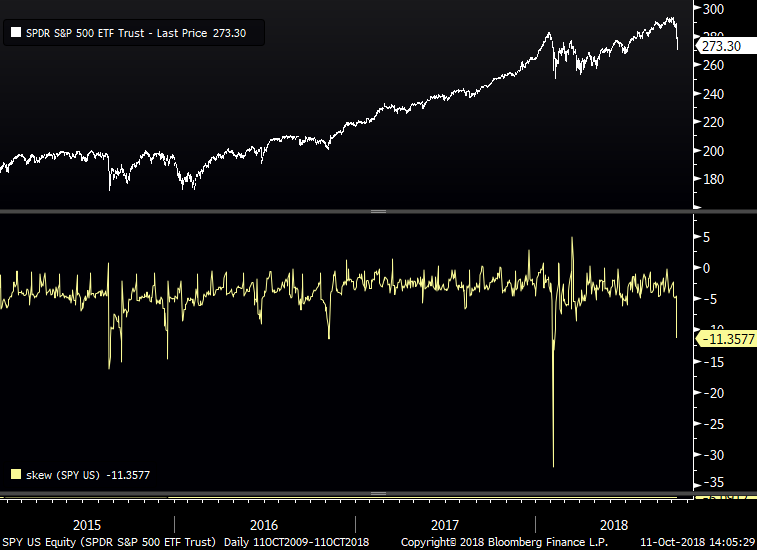
The panicky conditions are leading to a blowout in put options, with skew on SPY options widening the most since February and at one of the most extreme levels in years.

We'll have to see how the rest of the day plays out and what kinds of extremes are registered. If there is even a modest recovery, we probably won't see many. But if it picks up like yesterday, then we should be on track to record a number of historic extremes. The data yesterday suggested that another 1-2 days of selling wouldn't be unusual and would likely trigger more bullish precedents going forward, so we'll see if that's what we get today.

PRODUCTS
SentimenTrader
Trading Tools
Indicators & Data API
‍
Strategies & Scanner
‍
Research Reports
FREE
RESOUrCES
Simple Backtest
Calculator
Simple Seasonality
Calculator
The Kelly Criterion
Calculator
Sentiment Geo Map
‍
Public Research Reports
‍
Education
Sentiment Indicators
‍
Technical Indicators
‍
Pricing
Bundle pricing
‍
FAQ
‍
Announcements
‍
COMPANY
‍
About
‍
In the News
‍
Testimonials
‍
Client Success Stories
CONTACT
‍
General Inquiries
‍
Media Inquiries
‍
Financial Professionals Inquiries
‍
© 2026 Sundial Capital Research Inc. All rights reserved.
Setsail Marketing
TermsPrivacyAffiliate Program
Risk Disclosure: The information and tools provided are for research and analytical purposes only and are not intended as investment advice. Market analysis involves uncertainty, and outcomes may differ from expectations. Users should conduct their own due diligence and consider their individual circumstances before making any financial decisions. Past performance is not necessarily indicative of future results.

Hypothetical Performance Disclosure: Hypothetical performance results have many inherent limitations, some of which are described below. No representation is being made that any account will or is likely to achieve profits or losses similar to those shown; in fact, there are frequently sharp differences between hypothetical performance results and the actual results subsequently achieved by any particular trading program. One of the limitations of hypothetical performance results is that they are generally prepared with the benefit of hindsight. In addition, hypothetical trading does not involve financial risk, and no hypothetical trading record can completely account for the impact of financial risk of actual trading. for example, the ability to withstand losses or to adhere to a particular trading program in spite of trading losses are material points which can also adversely affect actual trading results. There are numerous other factors related to the markets in general or to the implementation of any specific trading program which cannot be fully accounted for in the preparation of hypothetical performance results and all which can adversely affect trading results.

Testimonial Disclosure: Testimonials appearing on this website may not be representative of other clients or customers and is not a guarantee of future performance or success.