
A leading indicator in the manufacturing sector shifts to expansion territory

Key points:
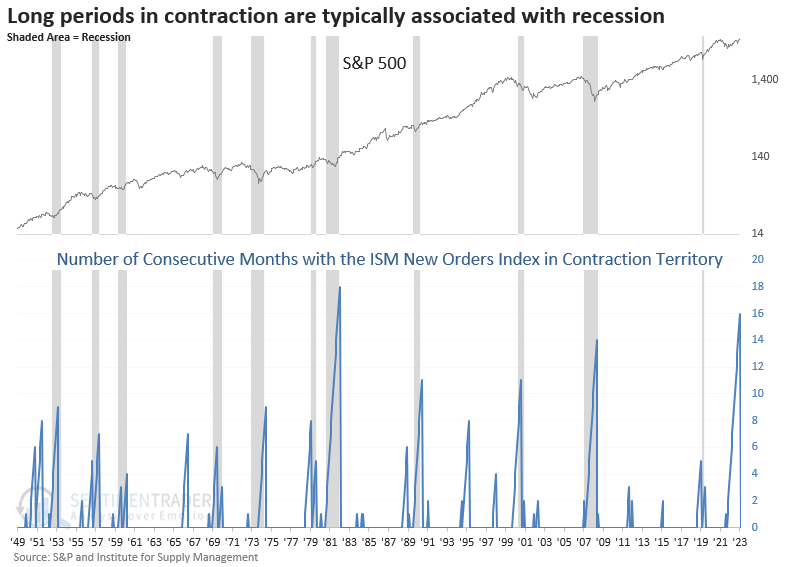
- The ISM New Orders Index rose into expansion territory after contracting for 16 months
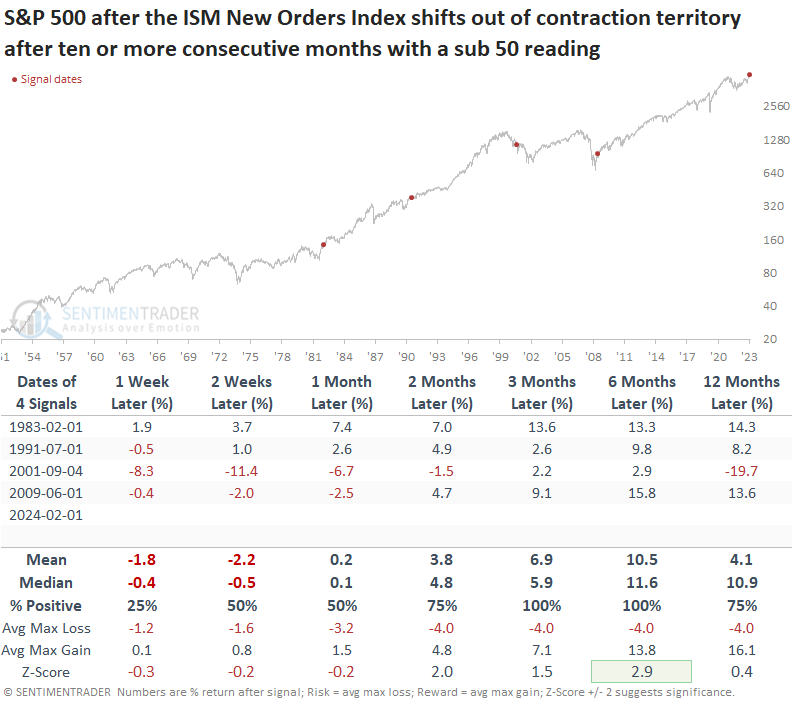
- Similar shifts from contraction to expansion preceded a bullish long-term outlook for the S&P 500
- The reversal in the new orders index suggests the overall manufacturing index trends higher
Does a shift in manufacturing suggest a soft or hard landing scenario for the economy?
Last week, the Institute for Supply Management released its manufacturing survey, with most components showing month-over-month improvement. That was especially the case for the new orders index, which jumped 5.5 points, shifting from contraction territory, a reading below 50, to expansion, a reading above 50.
New orders are one of the survey's most critical components, given that it acts as a leading indicator of economic activity. An expansion in new orders suggests growing demand for goods, which has a trickle-down effect on other industries outside of manufacturing.
Curiously, the second-longest streak in contraction territory was associated with a growth scare, not a recession.
Similar shifts in the new orders index suggest the uptrend in stocks persists
While the sample size is tiny, a shift from contraction to expansion after an extended period with a sub-50 index resulted in higher equity prices every time over the following three- and six-month horizons.
The Institute for Supply Management publishes the survey data on the first business day of each month. So, I used the release date instead of the month-end date to provide a more realistic assessment.
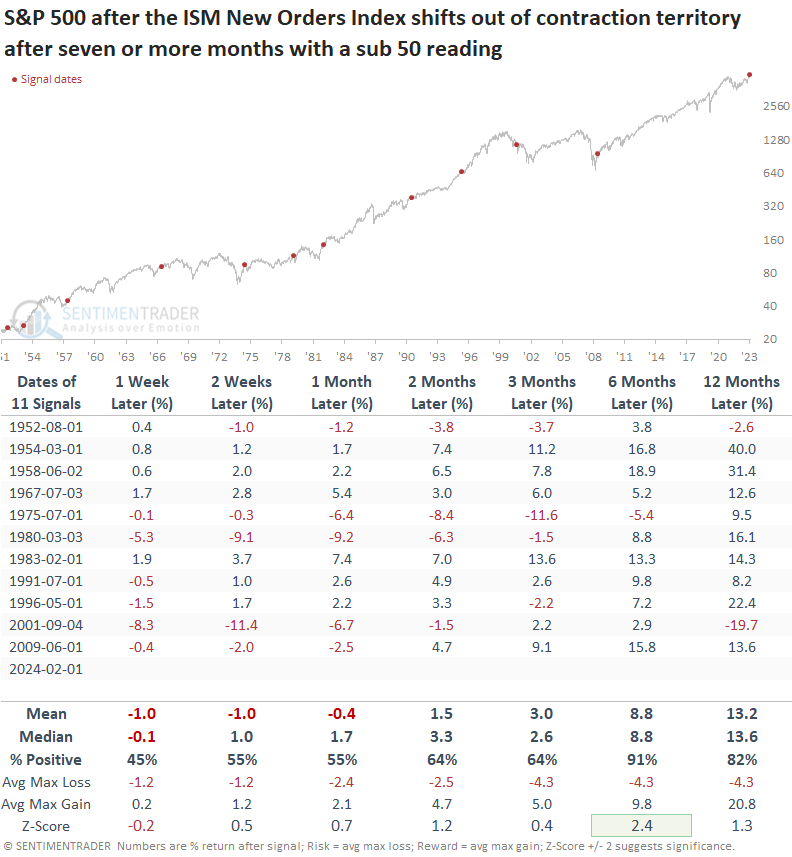
Trimming the contraction period from ten to seven months introduces a mixed outlook in the subsequent month, with variability based on whether the mean or median is utilized. However, six months later, the S&P 500 was higher 91% of the time, with a return that showed significance relative to the study period.
If I reduce the threshold to five months in contraction territory, the S&P 500 was higher six and twelve months later, 80% of the time.
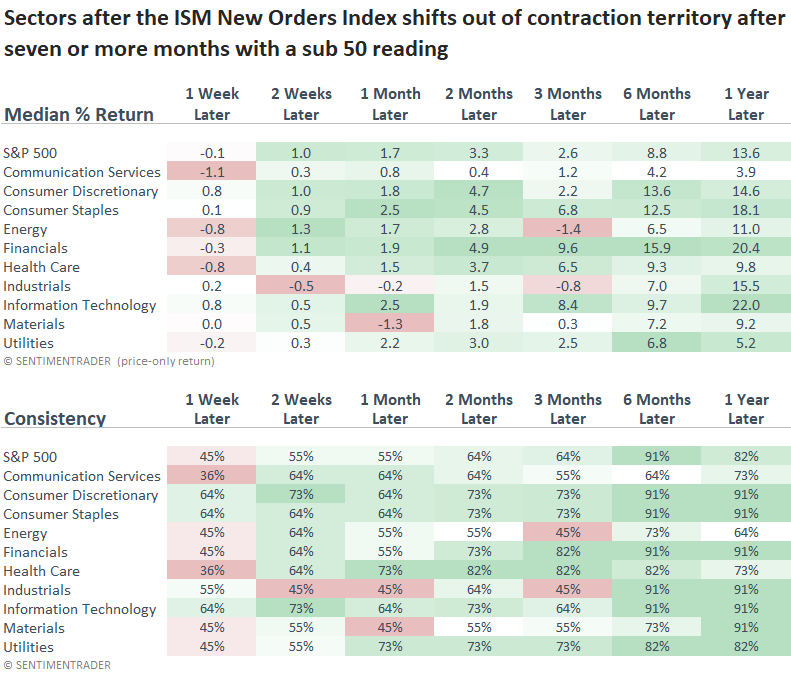
Cyclical sectors benefitted the most over the subsequent year when the new orders index shifted from contraction to expansion territory, while defensive groups lagged.
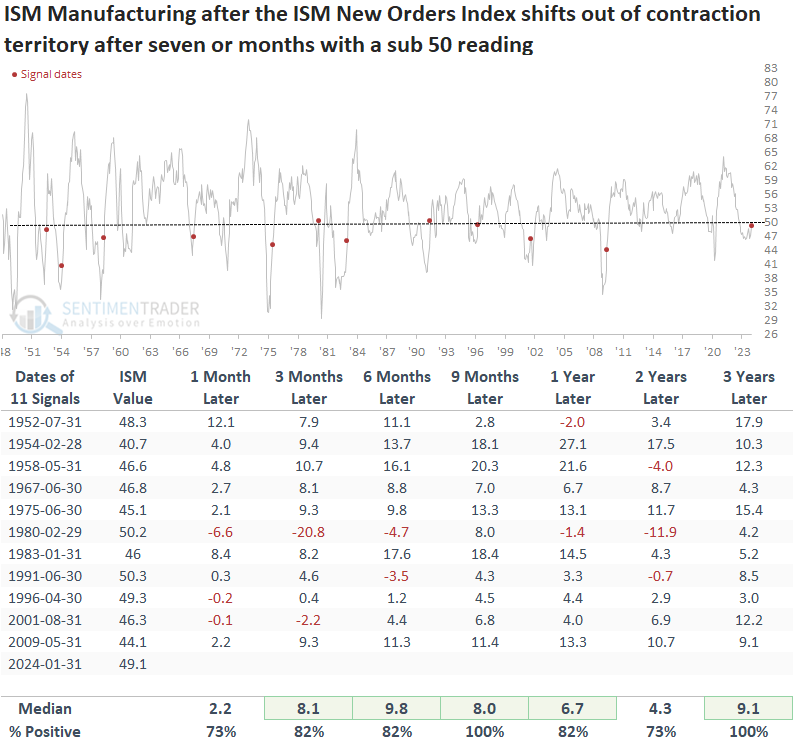
Should we expect the ISM Manufacturing survey to follow new orders higher?
Except for 1980, similar shifts in the new orders index have generally had a positive impact on the overall manufacturing index.
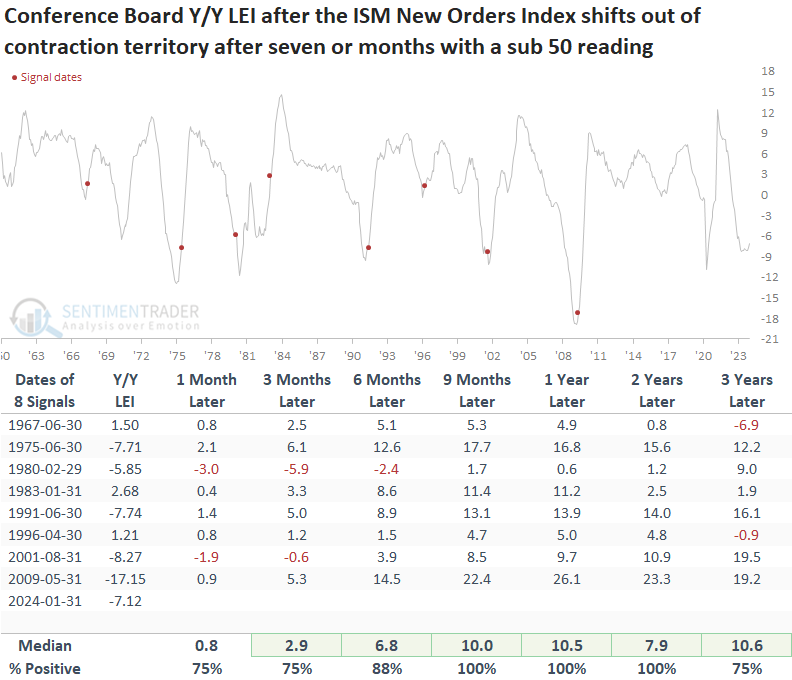
While the Conference Board's Leading Economic Indicators measured in year-over-year terms contain fewer signals due to data limitations, this widely followed economic series could turn up if history rhymes.
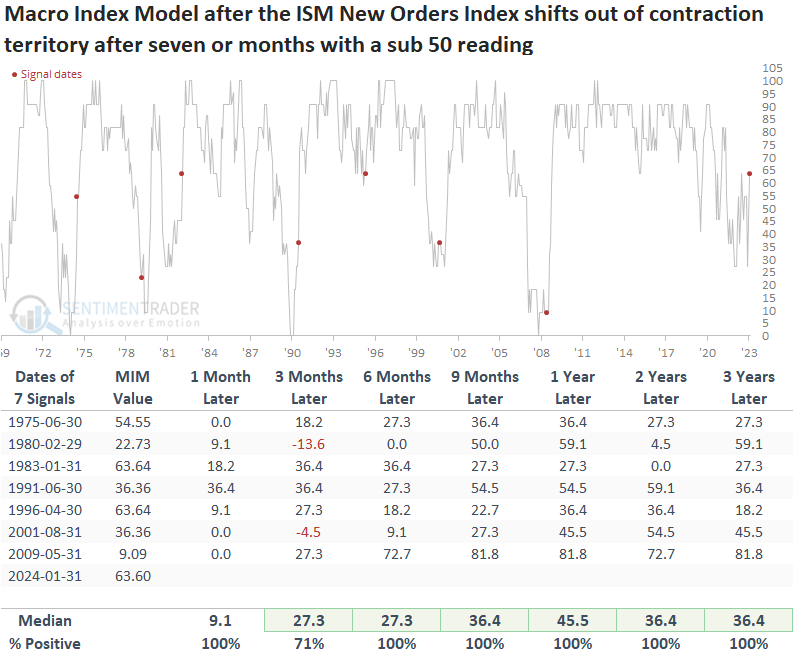
Applying the signals to the Sentimentrader Macro Index Model, which also contains fewer signals due to data limitations, suggests our proprietary macroeconomic measure could increase above 70%, a level associated with favorable S&P 500 returns.
What the research tells us...
A critical component of the ISM manufacturing survey, new orders, shifted into expansion territory after spending 16 months in contraction. Similar shifts tended to act as a positive catalyst for stocks, aligning with periods of economic recovery from either a growth scare or recession.
Economic data since the pandemic has been anything but ordinary, and manufacturing represents a smaller and smaller percentage of the overall economy. However, at the margin, the potential turn in manufacturing is a positive development confirmed by other recent economic indicators, like ISM services. Long-dated Treasury yields and the Dollar Index agree, which is why both have risen in 2024. The surge in both assets is likely impacting market breadth, a concern we've highlighted in multiple research reports.