
A Large-Cap/Small-Cap Cycle That Hides in Plain Sight

Key points:
- Small-caps are threatening to finally turn the corner versus large caps
- One cyclical tendency suggests that now is a good time for small caps to lead
- However, the same cycle suggests that large caps tend to hold an edge starting in mid-February
It's been a tough decade for small-caps, relatively speaking
The good news is that small-cap indexes have pushed back to new all-time highs in late 2025, and are threatening to break out to higher levels. The bad news is that they have significantly lagged behind large caps for several years.
The chart below displays the performance of the Russell 2000 Index (red line) and the S&P 500 (blue line) in the top clip, and the performance of the Russell relative to the S&P in the bottom clip (black line).
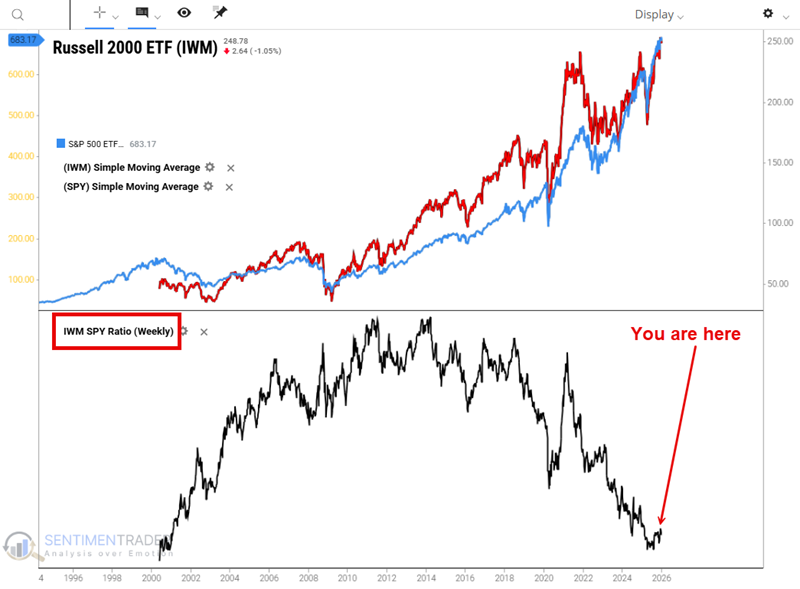
The small-cap index (tracked by ticker IWM) has gained ground in the past decade. However, it has vastly underperformed large caps. This is reflected by the black line in the lower clip of the chart above. The IWM/SPY ratio has been trending lower for roughly ten years. Many are suggesting that the tide is about to turn. In reality, no one knows for sure. Rather than trying to "predict" when the relationship will change decisively, we are going to look at a particular annual cycle that essentially "hides in plain sight."
A cyclical trend worth knowing about
Let's cut to the chase: During the post-World War II era, small-cap stocks have consistently shown a tendency to outperform large-cap stocks from mid-December to mid-February. The rest of the year? Not so much.
Let's define the cyclical periods:
Period 1: The 12th trading day of December through the 11th trading day of February. Period 1 tends to favor small-cap stocks.
Period 2: The 12th trading day of February through the 11th trading day of December. Period 2 tends to favor large-cap stocks.
Let's take a closer look at the history. For testing purposes, we will use total return data for the S&P 500 Small-Cap Index and the S&P 500 Large-Cap Index, starting on December 13, 1945 (the 11th trading day of December 1945), through January 6, 2026.
Period 1: December trading day #11 to February trading day #11
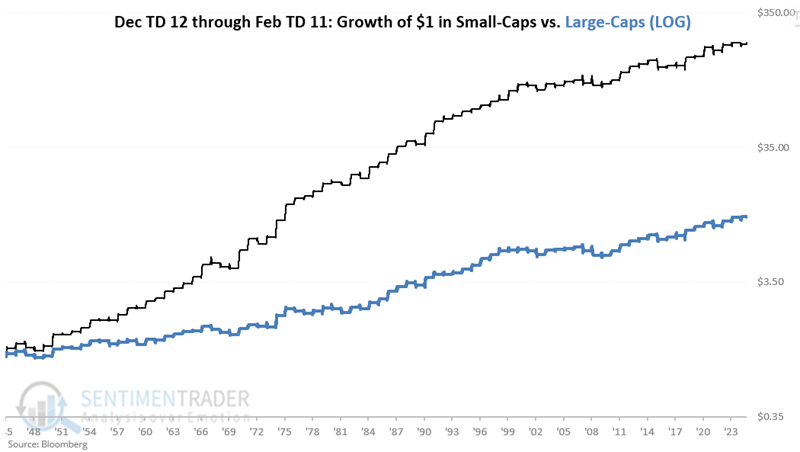
The chart below illustrates the hypothetical growth of $1 invested in the Small-Cap index (black line) and the Large-Cap index (blue line) only from the close of December Trading Day of the month #11 through February Trading Day #11 the following year.
A hypothetical $1 invested:
- Solely in Small Caps during this period grew to $209.16
- Solely in Large Caps during this period rose to $10.91
The chart below displays the return for Small-Caps relative to returns for Large-Caps during this two-month period every year since 1945.
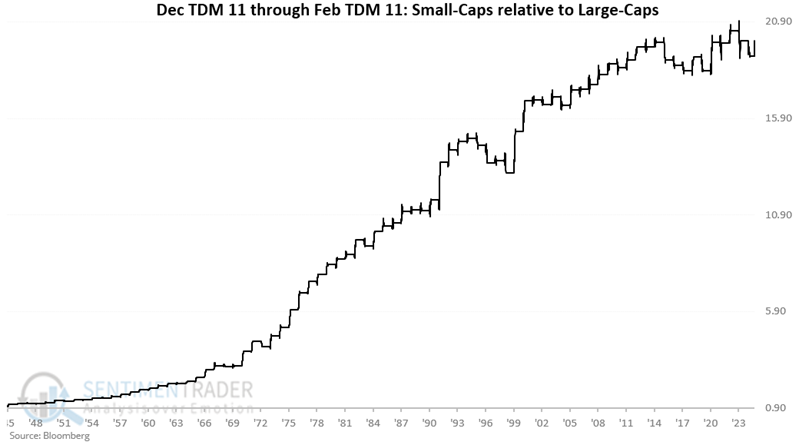
There are two key things to note:
- Small-Caps have enjoyed a considerable advantage during this period over the long-term
- There has been no advantage to speak of since 2013
Period 2: February trading day #11 to December trading day #11
Small-Caps have clearly enjoyed a significant performance advantage between mid-December and mid-February. But for the rest of the year, things tend to be significantly different.
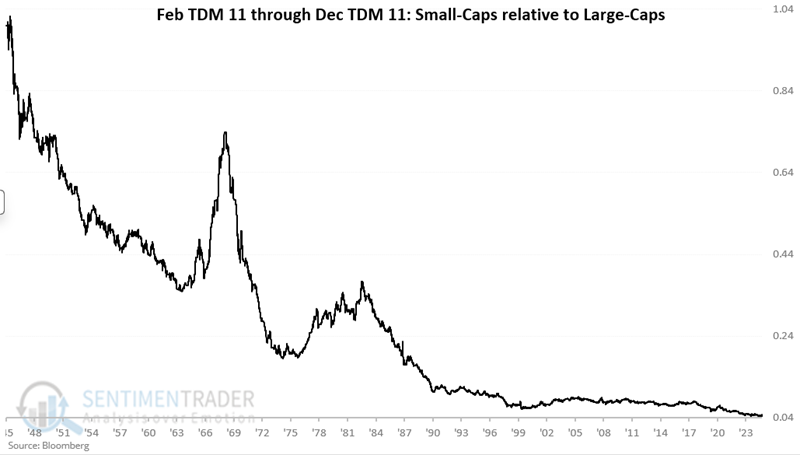
The chart below illustrates the hypothetical growth of $1 invested in the Small-Cap index (black line) and the Large-Cap index (blue line) only from the close of February Trading Day of the month #11 through December Trading Day of the month #11 each year.
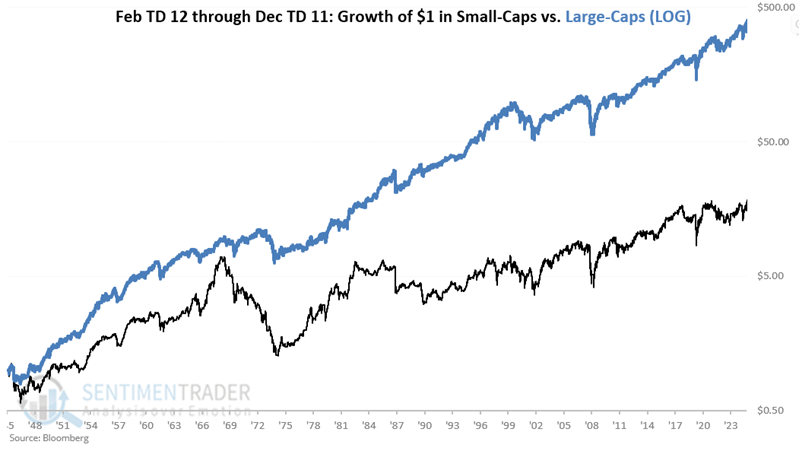
While Small-Caps held a huge long-term advantage during the mid-December to mid-February period, the opposite is true here. A hypothetical $1 invested:
- Solely in Small Caps during this period grew to $18.85
- Solely in Large Caps during this period rose to $403.03
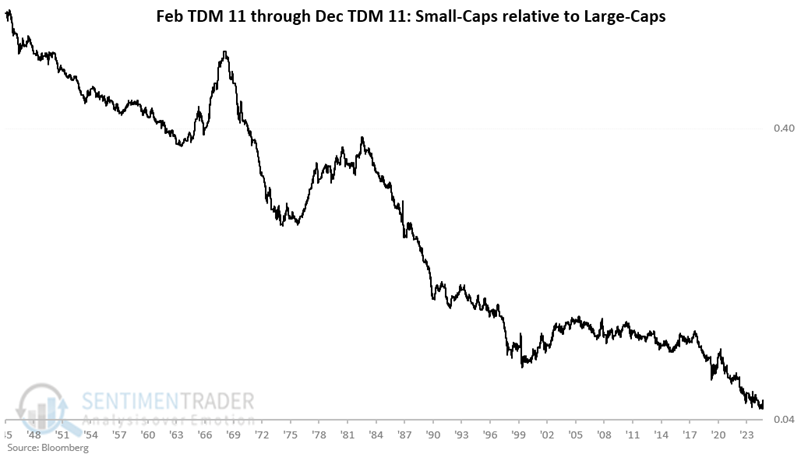
The chart below displays the return for Small-Caps relative to returns for Large-Caps during this ten-month period. The tendency for relative weakness is apparent.
The chart below displays the same results as the chart above on a logarithmic scale,
The table below summarizes the difference in index performance during the two distinct periods. In analyzing "yearly" performance, we measure results from the end of December trading day #11 this year versus December trading day #11 of last year.
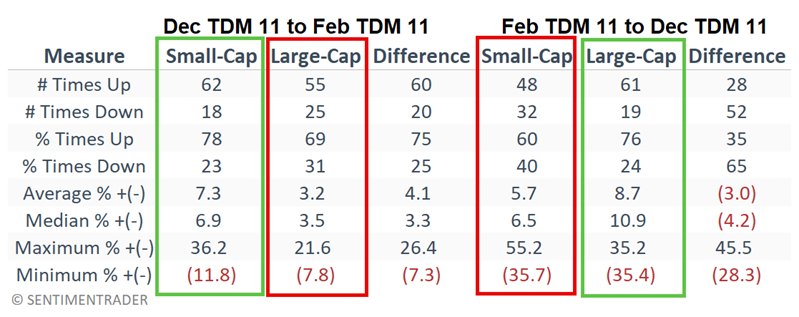
From the table above, note that the "Difference" columns measure the outperformance or underperformance of small-cap stocks relative to large-cap stocks during the two distinct periods. So what the numbers tell us is this:
- During the Dec TDM 11 to Feb TDM 11 periods, small caps outperformed large caps 75% of the time (60 out of 80 years), by an average of 4.1% per year
- During the Feb TDM 11 to Dec TDM 11periods, large caps outperformed small caps 65% of the time (65 out of 80 years), by an average of 3.0% per year
Creating a Switching Strategy
It's pretty simple. The hypothetical strategy here involves:
- Buying a small-cap index fund (for example, ticker IWM) at the close of the 11th trading day of December, then
- Switching to a large-cap index fund (for example, ticker SPY) at the close of the 11th trading day of February
The chart below illustrates the hypothetical growth of $1 invested using the "Switching Strategy" versus $1 invested using the exact inverse of this strategy (i.e., buying Large-Caps on December trading day 11 and Small-Caps on February trading day 11). $1 invested using the Switching Strategy, starting in 1945, grew to $84,297 through January 6, 2026. $1 invested using the inverse strategy grew to $206.
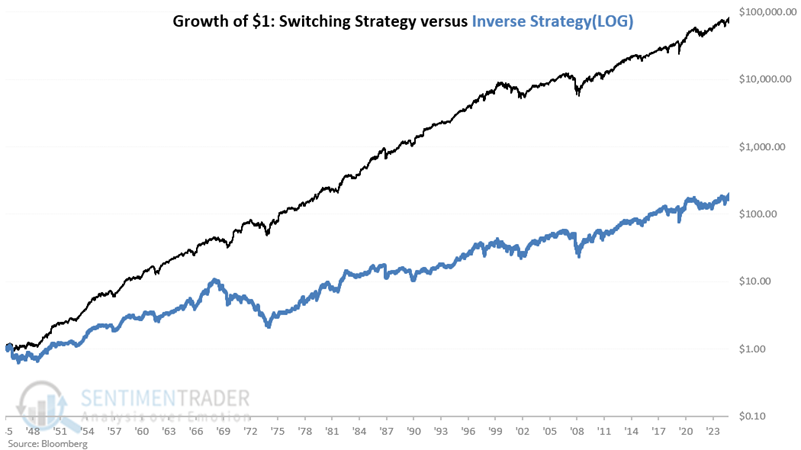
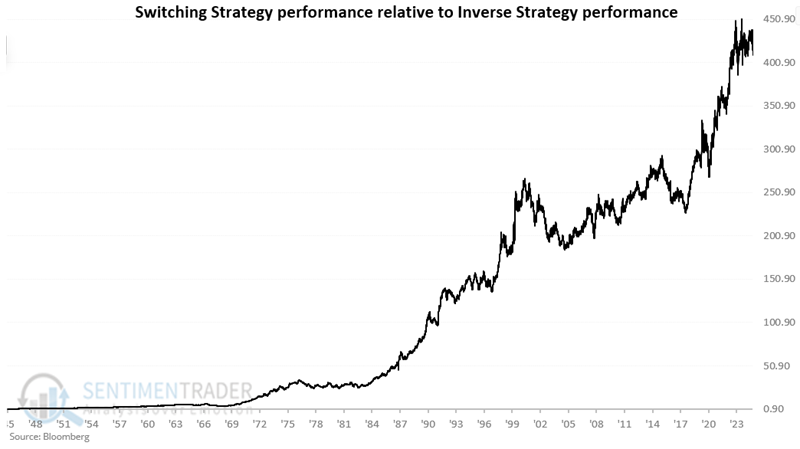
The chart below displays the performance of the Switching Strategy relative to the Inverse Strategy. While the long-term uptrend is unmistakable, note also that the line can move sideways to lower for years at a time.
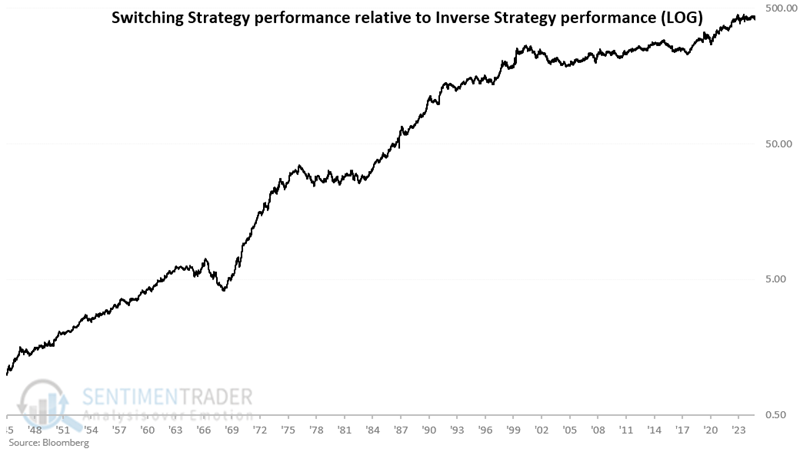
The chart below shows the same results on a logarithmic scale.
The table below summarizes the performance of the Switching Strategy versus the Inverse (i.e., Opposite) strategy.
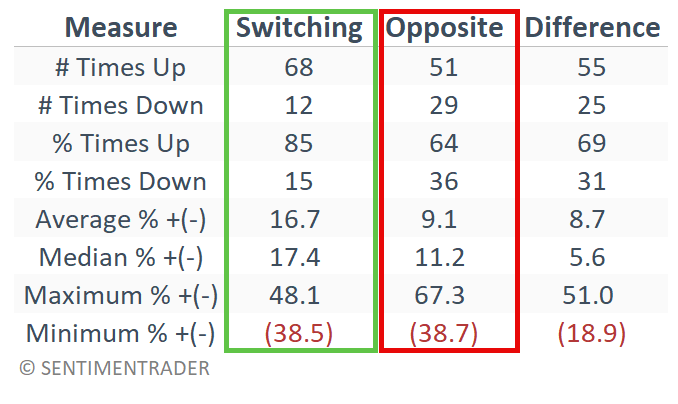
Looking once again at the "Difference" column, this indicates that holding small caps from mid-December to mid-February outperformed the opposite strategy during 69% of the years (55 out of 80) by an average of 8.7% per year.
What's next?
The Switching Strategy will hold Small-Caps through February 17th, at which time it will switch into Large-Caps. They would be held until December 15th, at which time the strategy would switch back into Small-Caps.
What the research tells us…
On a long-term basis, this "strategy" (such as it is) is technically a "market-beating winner." However, from year to year, and even decade to decade, there are no guarantees. The Switching Strategy has enjoyed a positive twelve-month period (recorded from December Trading Day #11 one year to December Trading Day #11 the following year) 85% of the time, which suggests good reliability. So, should investors throw out whatever method(s) they are currently using and adopt this as their only approach to investing? That is not the suggestion being made here. The point being made is that there appears to be an "edge" available to investors who consider weighting small caps more heavily from mid-December to mid-February and large caps the rest of the year.