
A key time of year in two key ag markets

Key points
- Trading commodity spreads isn't for everyone; still, opportunity is where you find it
- Due to their planting and harvesting cycles, soybeans and wheat typically operate on different cycles
- One of the most pronounced periods of inverse behavior is starting now
Soybean weakness and wheat strength are common in September/October
The charts below display the annual seasonal trend for soybean and wheat futures.
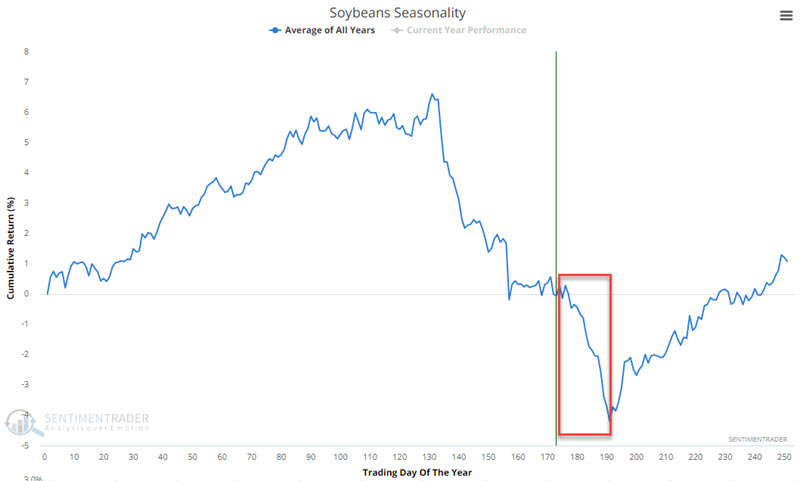
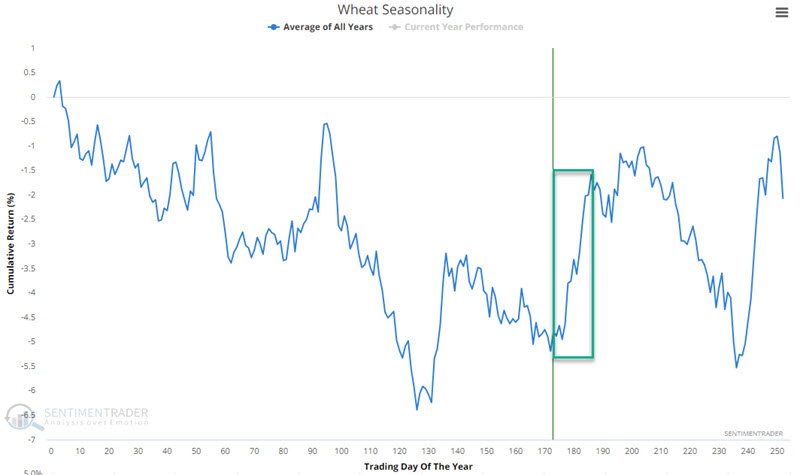
As you can see, the tendency for both is almost inverse in the very near term. Soybeans tend to show significant weakness, while wheat tends to show strength. This creates an opportunity to trade an "Intermarket futures spread" involving selling short a November 2023 soybean futures contract and buying long a December 2023 wheat futures contract.
A short lesson on futures trading
If you have never traded futures contracts, it is NOT recommended that you immediately jump into the position discussed here. Take some time to learn more of the ins and outs of simple long and short positions first. Also, examine closely the double-edged sword of the relatively low margin requirements involved in futures trading. Only then should you consider the slightly arcane world of intermarket commodity spreads. In the meantime, consider this piece as a "lesson."
A quoted price of 1,350 for November 2023 soybean futures implies a cost of $13.50 a bushel. Each contract is for 5,000 bushels. Therefore, the total dollar value of the contract, priced at 1,350, is $67,500. If the price rises to 1,400, the value increases to $70,000; if it falls to 1,300, the value decreases to $65,000. Yet to buy or sell short one contract of soybean futures, a trader need only put up the "maintenance margin" of $3,900 (note that this amount can be raised or lowered by the exchange itself and can also be raised by an individual brokerage firm).
So, at a price of 1,350, a trader presently needs only to put up 5.8% of the value of the contract ($3,900 margin requirement divided by $67,500 contract value) to enter a long or short position. This is equivalent to putting up only $5,800 to buy $100,000 worth of TSLA stock. The good news is that if the price moves in the right direction for the trader, their profit will be huge on a percentage basis. The bad news is that margin money can get eaten up very quickly if the price goes in the wrong direction.
It is essential to note that any margin requirement amount DOES NOT equal actual risk. All losses incurred are the responsibility of the account holder.
Let's look at wheat futures. With wheat futures at a price of 600, the futures contract value is $30,000. As this is written, the maintenance margin for a long or short position in a single wheat futures contract is $3,000, or 10% of the contract value. Again, this margin requirement can and will fluctuate to some degree over time based on the raw price level and recent price volatility, and this is essentially the cost of entry but not the actual risk - which is unlimited.
When trading intermarket spreads, the exchanges (and most brokerages) require a reduced margin amount. Before entering any commodity spread, you should check with your commodity broker regarding the exact margin requirement. But the following discussion will give a reasonable approximation.
Currently, the "credit" percentage from the CME for trading soybeans against wheat is 65%. So, to buy one wheat contract and sell short one soybean contract, the calculation is as follows:
- Soybean margin requirement = $3,900
- Wheat margin requirement = $3,000
- Total = $6,900
- Spread requirement after 65% credit = $6,900 x (1 - 0.65) = $2,415
So, in theory (again, inquire with your broker regarding exact margin requirements), a trader might initially have to put up this amount to enter a long wheat/short soybeans position. Note that if the trade goes the wrong way, the brokerage firm will demand more money be put up immediately to maintain the trade, or else they may close the position. Also, at this point, it should not surprise you to learn that this amount does not equal the maximum risk, which remains unlimited as with any commodity futures position.
With that basic understanding in mind, let's take a closer look at the current potential opportunity in trading soybeans against wheat.
Long wheat and short soybeans in early fall
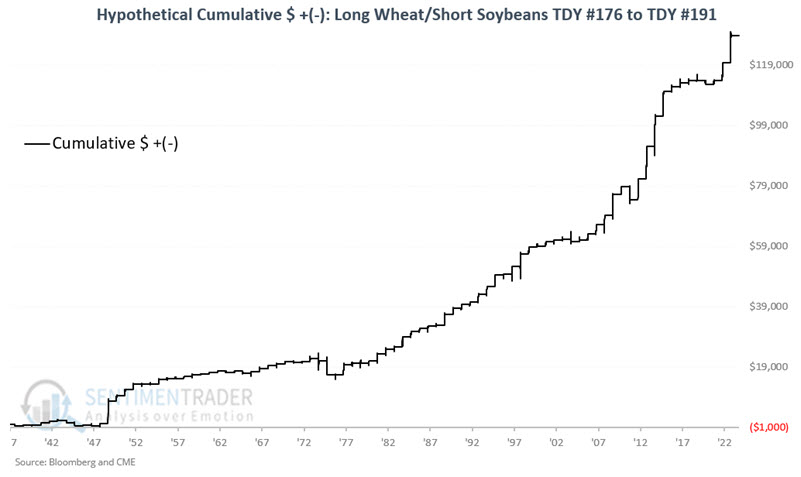
We will examine the period from the close on Trading Day of the Year #176 through TDY #191. For 2023, this period extends from the close on 2023-09-14 through 2023-10-05. We start our hypothetical test back in 1937. Each year, at the close of TDY #176, we buy a wheat futures contract and simultaneously sell short a soybean futures contract. Fifteen trading days later, we exit both positions. For the sake of this test, no stop-loss is entered. We are simply measuring hypothetical results during this 15-trading day period.
The chart below displays the cumulative hypothetical $ gain/loss from holding long wheat/short soybeans for these 15 trading days each year.
The table below summarizes annual results.
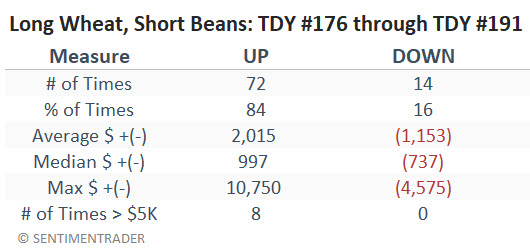
The results are pretty compelling for a trader comfortable trading commodity futures spreads. The historical Win Rate over 86 years is 84%, the average and median winner is significantly greater than the average and median loser, and returns over $5,000 are skewed 8 to 0 in favor of winners. The bad news is that there are no guarantees, and futures trading involves exposure to unlimited risk, even when trading spreads. A trader wishing to pursue this strategy must develop some stop-loss criteria and maintain the resolve to stick to it.
What the research tells us…
Commodity spread trading is definitely not for everyone. That said, for those inclined, the persistent seasonality of the grain markets can offer some compelling opportunities.