
A In-Depth Look at the TCTM Long-Term Trend Model

Key points
- The TCTM Long-Term Trend Model is a composite indicator designed to measure the primary trend of the S&P 500.
- The model combines multiple price momentum inputs (from two to twelve months) with the slope of the 180-day moving average.
- Historically, buy signals from the model have preceded positive returns for the S&P 500, with an 81% win rate over the subsequent year.
The Long-Term Trend Model Components
Identifying the primary market trend is one of the most critical tasks for any trader or investor. The Tactical Composite Trend Model (TCTM) is the culmination of decades of professional trading and financial market research, designed to aid in this process. The TCTM utilizes a weight-of-the-evidence approach, combining seven critical, time-tested components to identify major market turning points. This report will focus on one of those key components: The TCTM Long-Term Trend Model.
The Long-Term Trend Model is itself a composite, designed to provide a robust and reliable measure of the S&P 500's primary trend. It achieves this by combining two different but complementary types of analysis: trend and momentum.
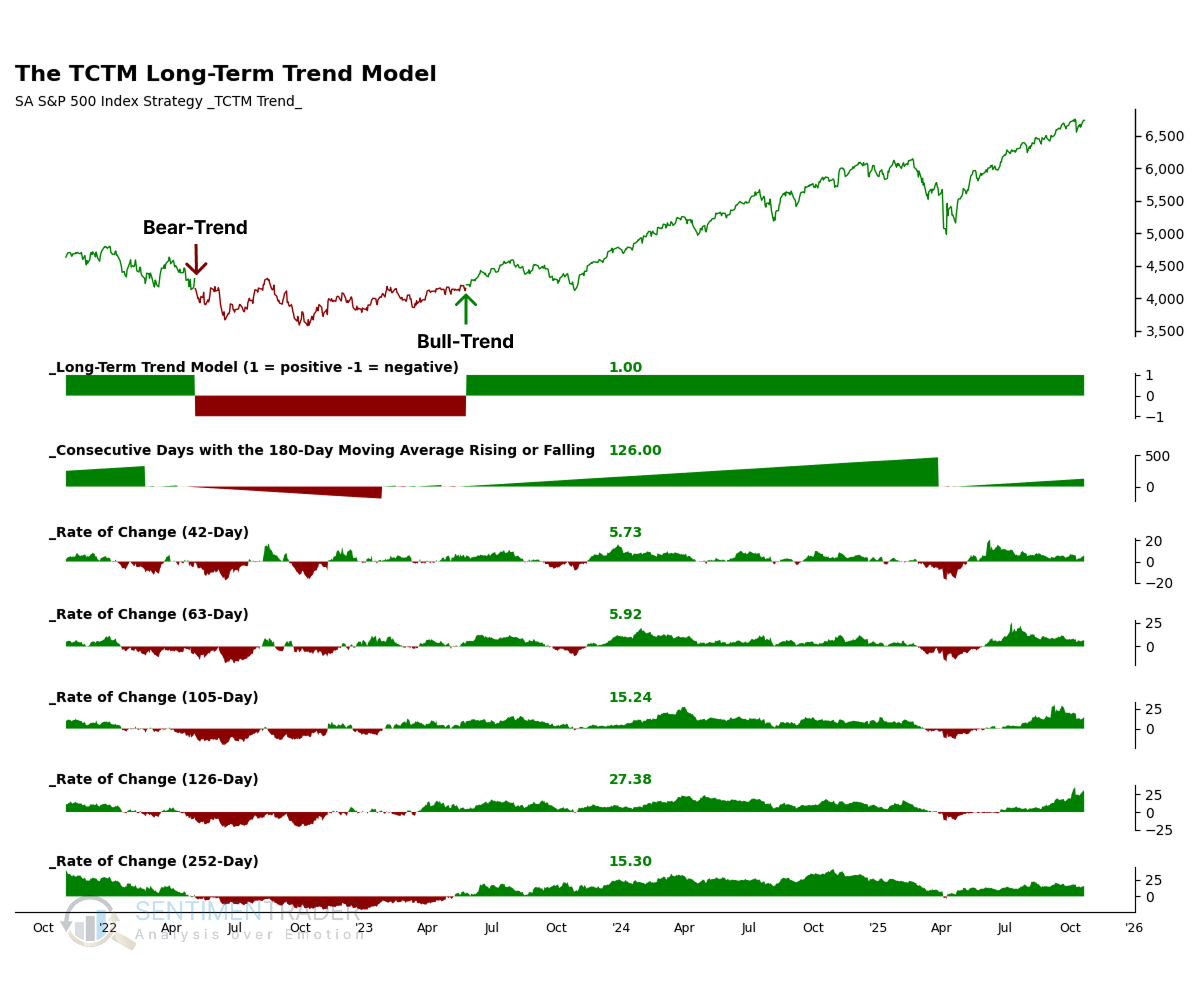
- Trend: The model measures the underlying trend by tracking the slope of the 180-day moving average. A rising average indicates a positive long-term trend, while a falling average indicates a negative one.
- Momentum: To measure the strength and persistence of the trend, the model incorporates several price momentum inputs, using the rate of change (ROC) over various time frames ranging from two months (42 days) to twelve months (252 days).
As the new chart below illustrates, these individual components are combined into a single composite indicator-the Long-Term Trend Model-which registers a +1 for a positive trend and a -1 for a negative trend. Currently, the model shows a reading of +1.00, indicating a bull trend.
Utilizing the TCTM Long-Term Trend Model
The model's binary output provides a clear, rules-based approach to trend identification. Instead of subjective interpretation, we can define a market environment as either "Favorable" or "Unfavorable" based on the model's reading. In other words:
- When the Long-Term Trend Model equals +1, the primary trend is considered Favorable for stocks.
- When the Long-Term Trend Model equals -1, the primary trend is considered Unfavorable for stocks.
With this framework, we can construct a systematic trend-following strategy to see how this approach has performed historically.
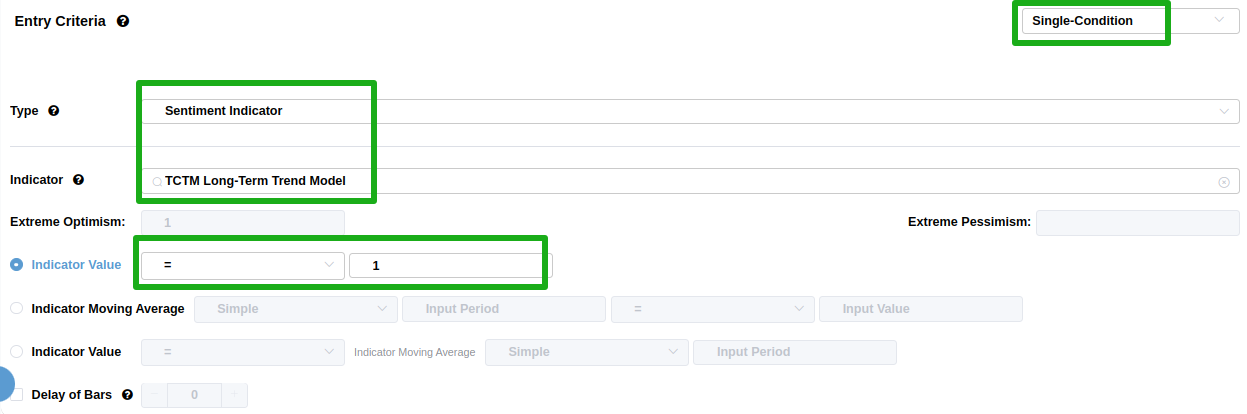
Using the Backtest Edge engine, we can set up the entry and exit criteria to follow the model's signals. The setup is straightforward:
The Entry Criteria are set for when the TCTM Long-Term Trend Model equals 1, initiating a long position when the trend is favorable.
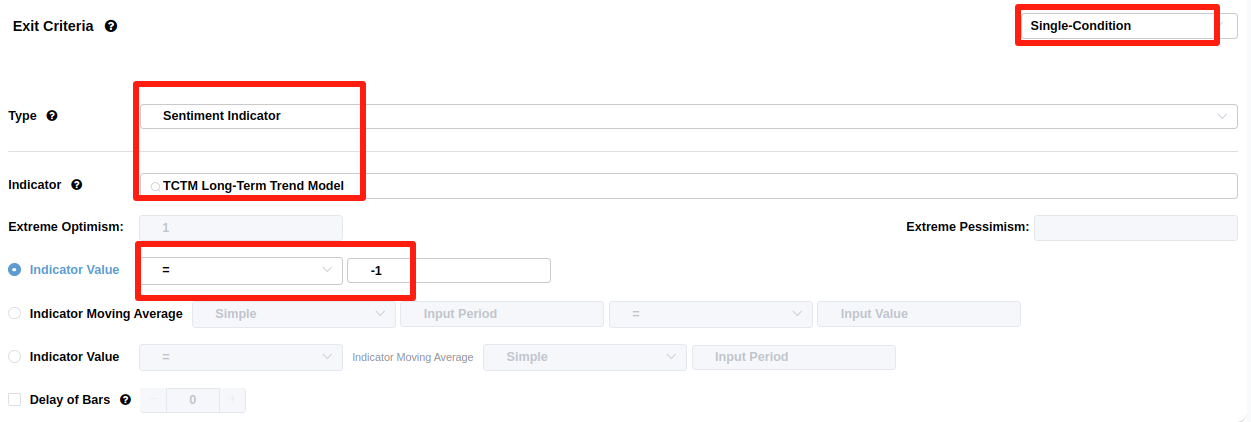
Conversely, the Exit Criteria are set for when the model equals -1, closing the position when the trend turns unfavorable.
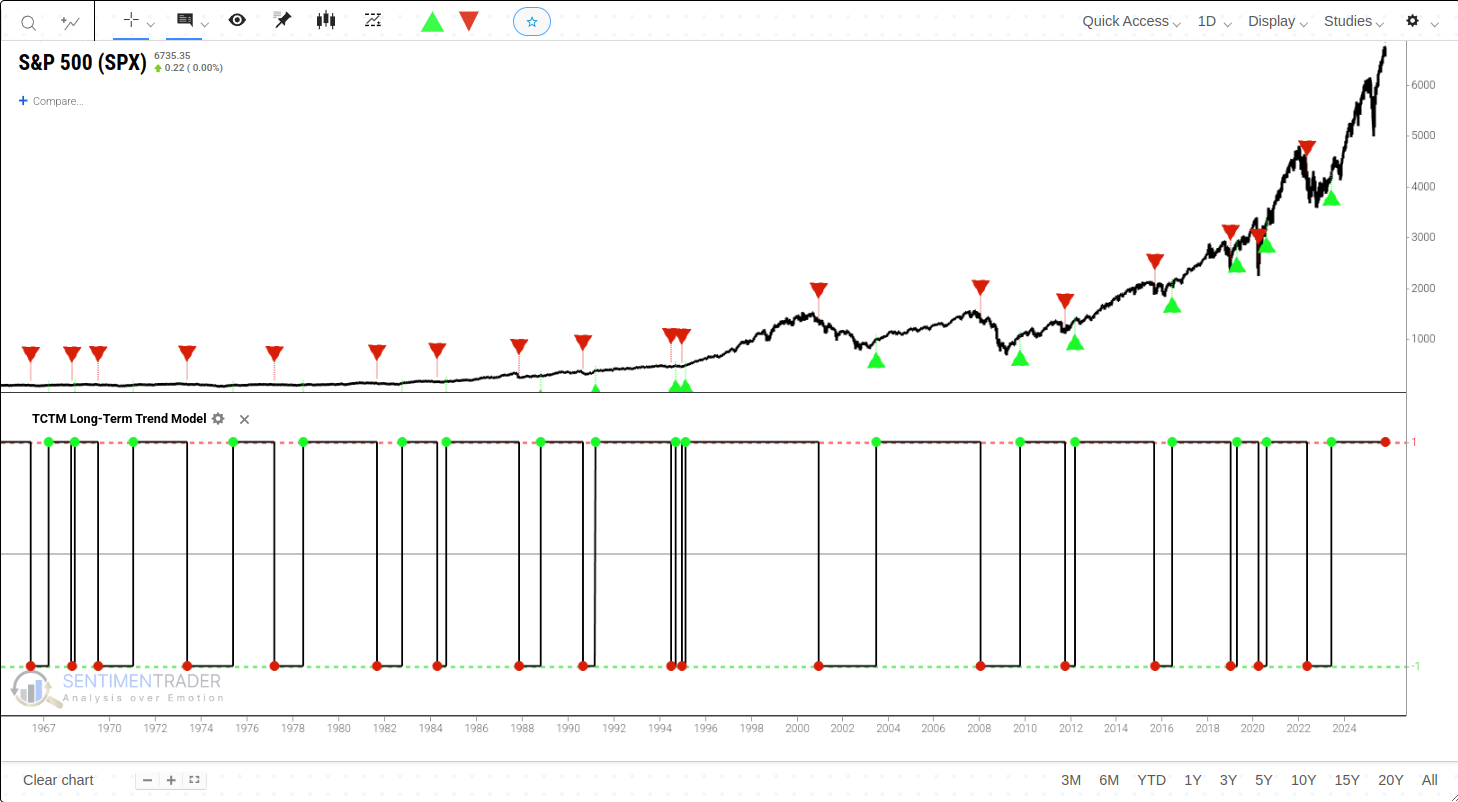
The chart below illustrates the signal changes of this indicator relative to the S&P 500 Index. The most recent signal was a buy signal issued on May 26, 2023. As of this writing, the indicator value stands at 1, maintaining a "favorable" stance toward the stock market (which will persist until it falls to -1).
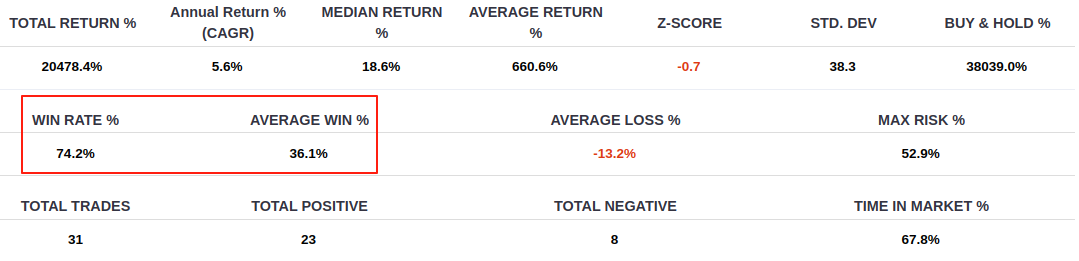
The table below summarizes S&P 500 performance during the favorable periods between buy and sell signals. The strategy has shown a solid Win Rate of 74.2%. A key feature is the positive asymmetry between the average win and the average loss; the Average Win % of 36.1% is substantially larger than the Average Loss % of -13.2%, indicating that the gains during favorable periods have historically outweighed the losses during unfavorable ones. For related backtest, click here.
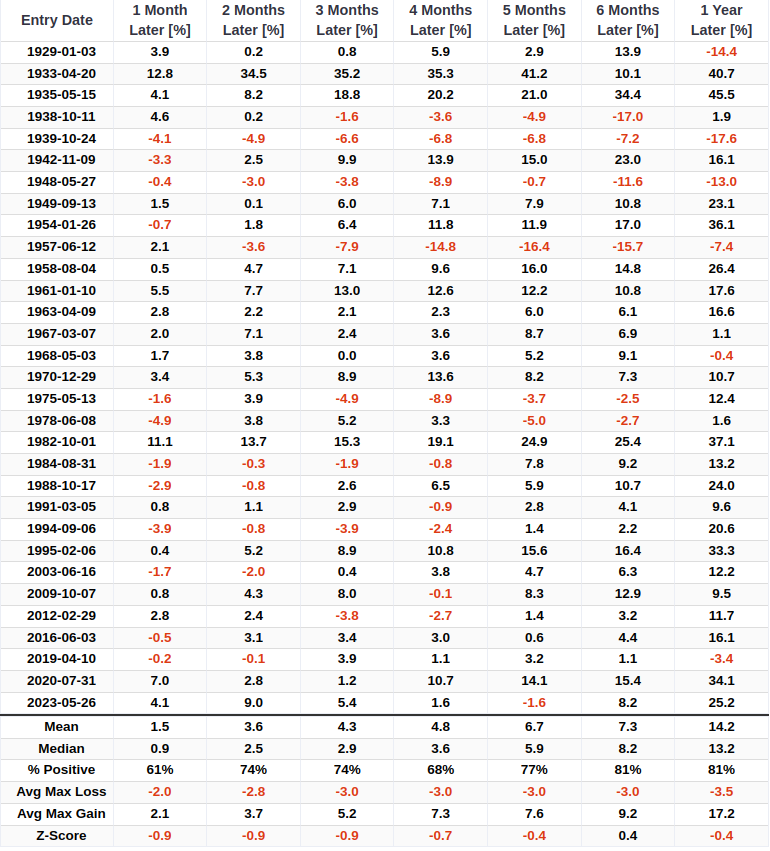
While the first month is a bit of a coin-flip (61% win rate), the model's edge becomes much clearer over time. A year after a buy signal, the S&P 500 was higher 81% of the time with a median gain of +13.2%.
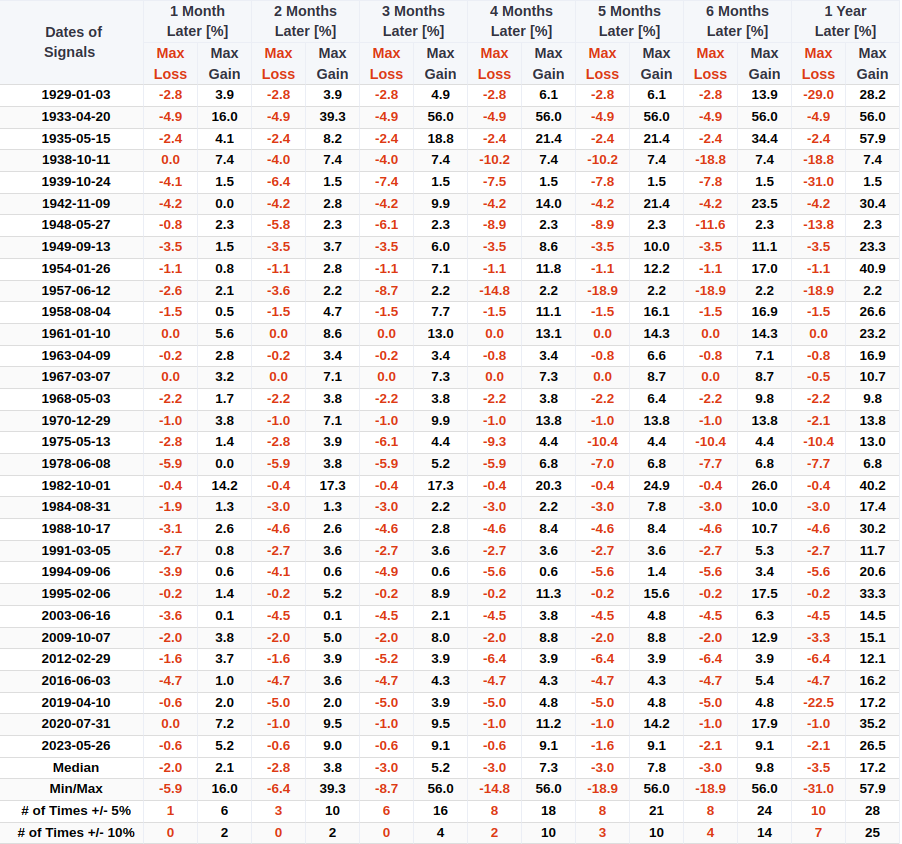
The median maximum loss over the year following a buy signal was only -3.5%. In all the historical signals, a drawdown exceeding -10% occurred in only 7 instances. This suggests the model has been excellent at identifying periods of stable, positive market drift.
What the research tells us...
The TCTM Long-Term Trend Model combines a variety of trend and momentum inputs into one overarching indicator, which typically tracks closely with the primary trend of the S&P 500. When the indicator is rising and/or at a high level (+1), it has tended to bode well for stocks. When the indicator falls to a low level (-1), it has historically signaled a period of heightened risk.
This model serves as an excellent, objective gauge of the market's long-term health and can be a valuable tool to help in deciding on broad stock market allocations. This is just one of the several components that make up the broader TCTM framework, and our research team is continuously developing and testing new models to enhance this weight-of-the-evidence approach. We appreciate your patience as this work progresses and look forward to rolling out new components in the future.