
A In-Depth Look at the Sentimentrader's New TCTM Composite Washout Model - Part II

Key points
- This report is Part II of our deep dive into the S-TCTM Composite Washout Model, a key component of our broader Tactical Composite Trend Model.
- We continue to deconstruct the model's logic, focusing on components that measure extreme oversold conditions, volume capitulation, and volatility stabilization.
- These individual components act as "washout" signals, identifying moments when selling pressure reaches a climax and begins to recede.
- Historically, these signals have often marked significant market bottoms, preceding strong returns over the medium-to-long term.
The Composite Washout Model Components
Identifying the primary market trend is one of the most critical tasks for any trader or investor. The Tactical Composite Trend Model (TCTM) is the culmination of decades of professional trading and financial market research, designed to aid in this process. The TCTM utilizes a weight-of-the-evidence approach, combining seven key time-tested components to identify major market turning points. This report will focus on one of those key components: the Sentimentrader's New TCTM (S-TCTM) Composite Washout Model .
Bullish divergence signals play a crucial role in the Composite Washout Model. The model is designed to issue alerts when an index makes a new low, but participation in the decline-the number of stocks making new lows along with it-diminishes. This "non-confirmation" is a classic sign of seller exhaustion.
Please note that we are still in the process of developing the S-TCTM program for the website. Currently, we will continue to update subscribers with any new developments.
Component Descriptions
- 252-day Low Divergence
- 63-Day Low Divergence
- Breadth Washout
- Volume Washout
- Oversold Extreme
- Oversold Divergence
- 21-Day Low Divergence
- Bollinger Band Washout Reversal
- 10-Day Avg Return
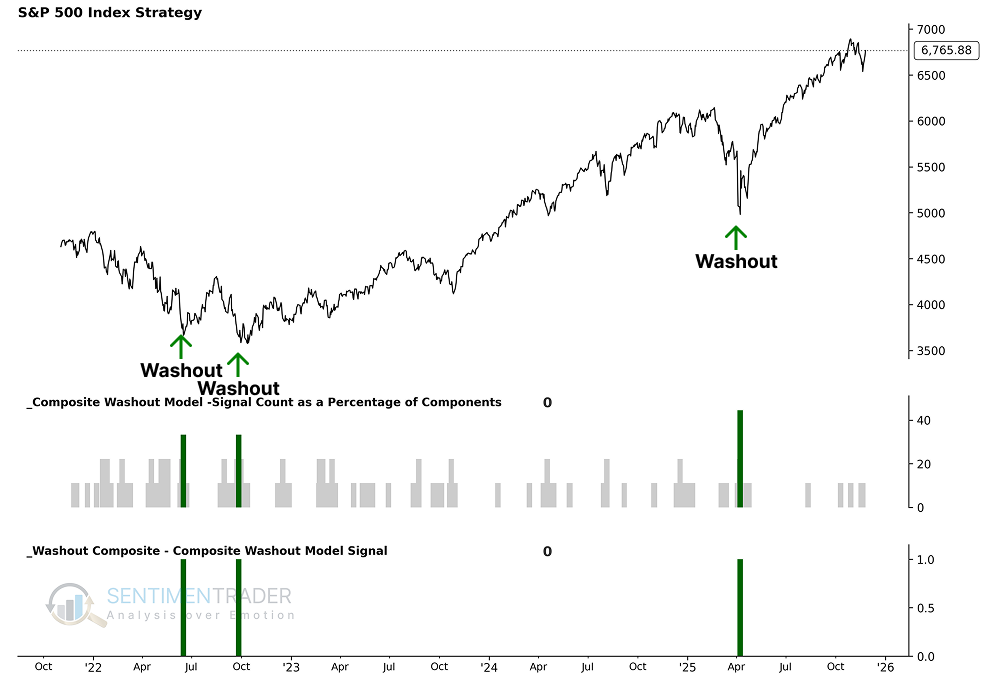
Composite Washout Model Signal Criteria
- Condition = Composite Signal Count >= 33%.
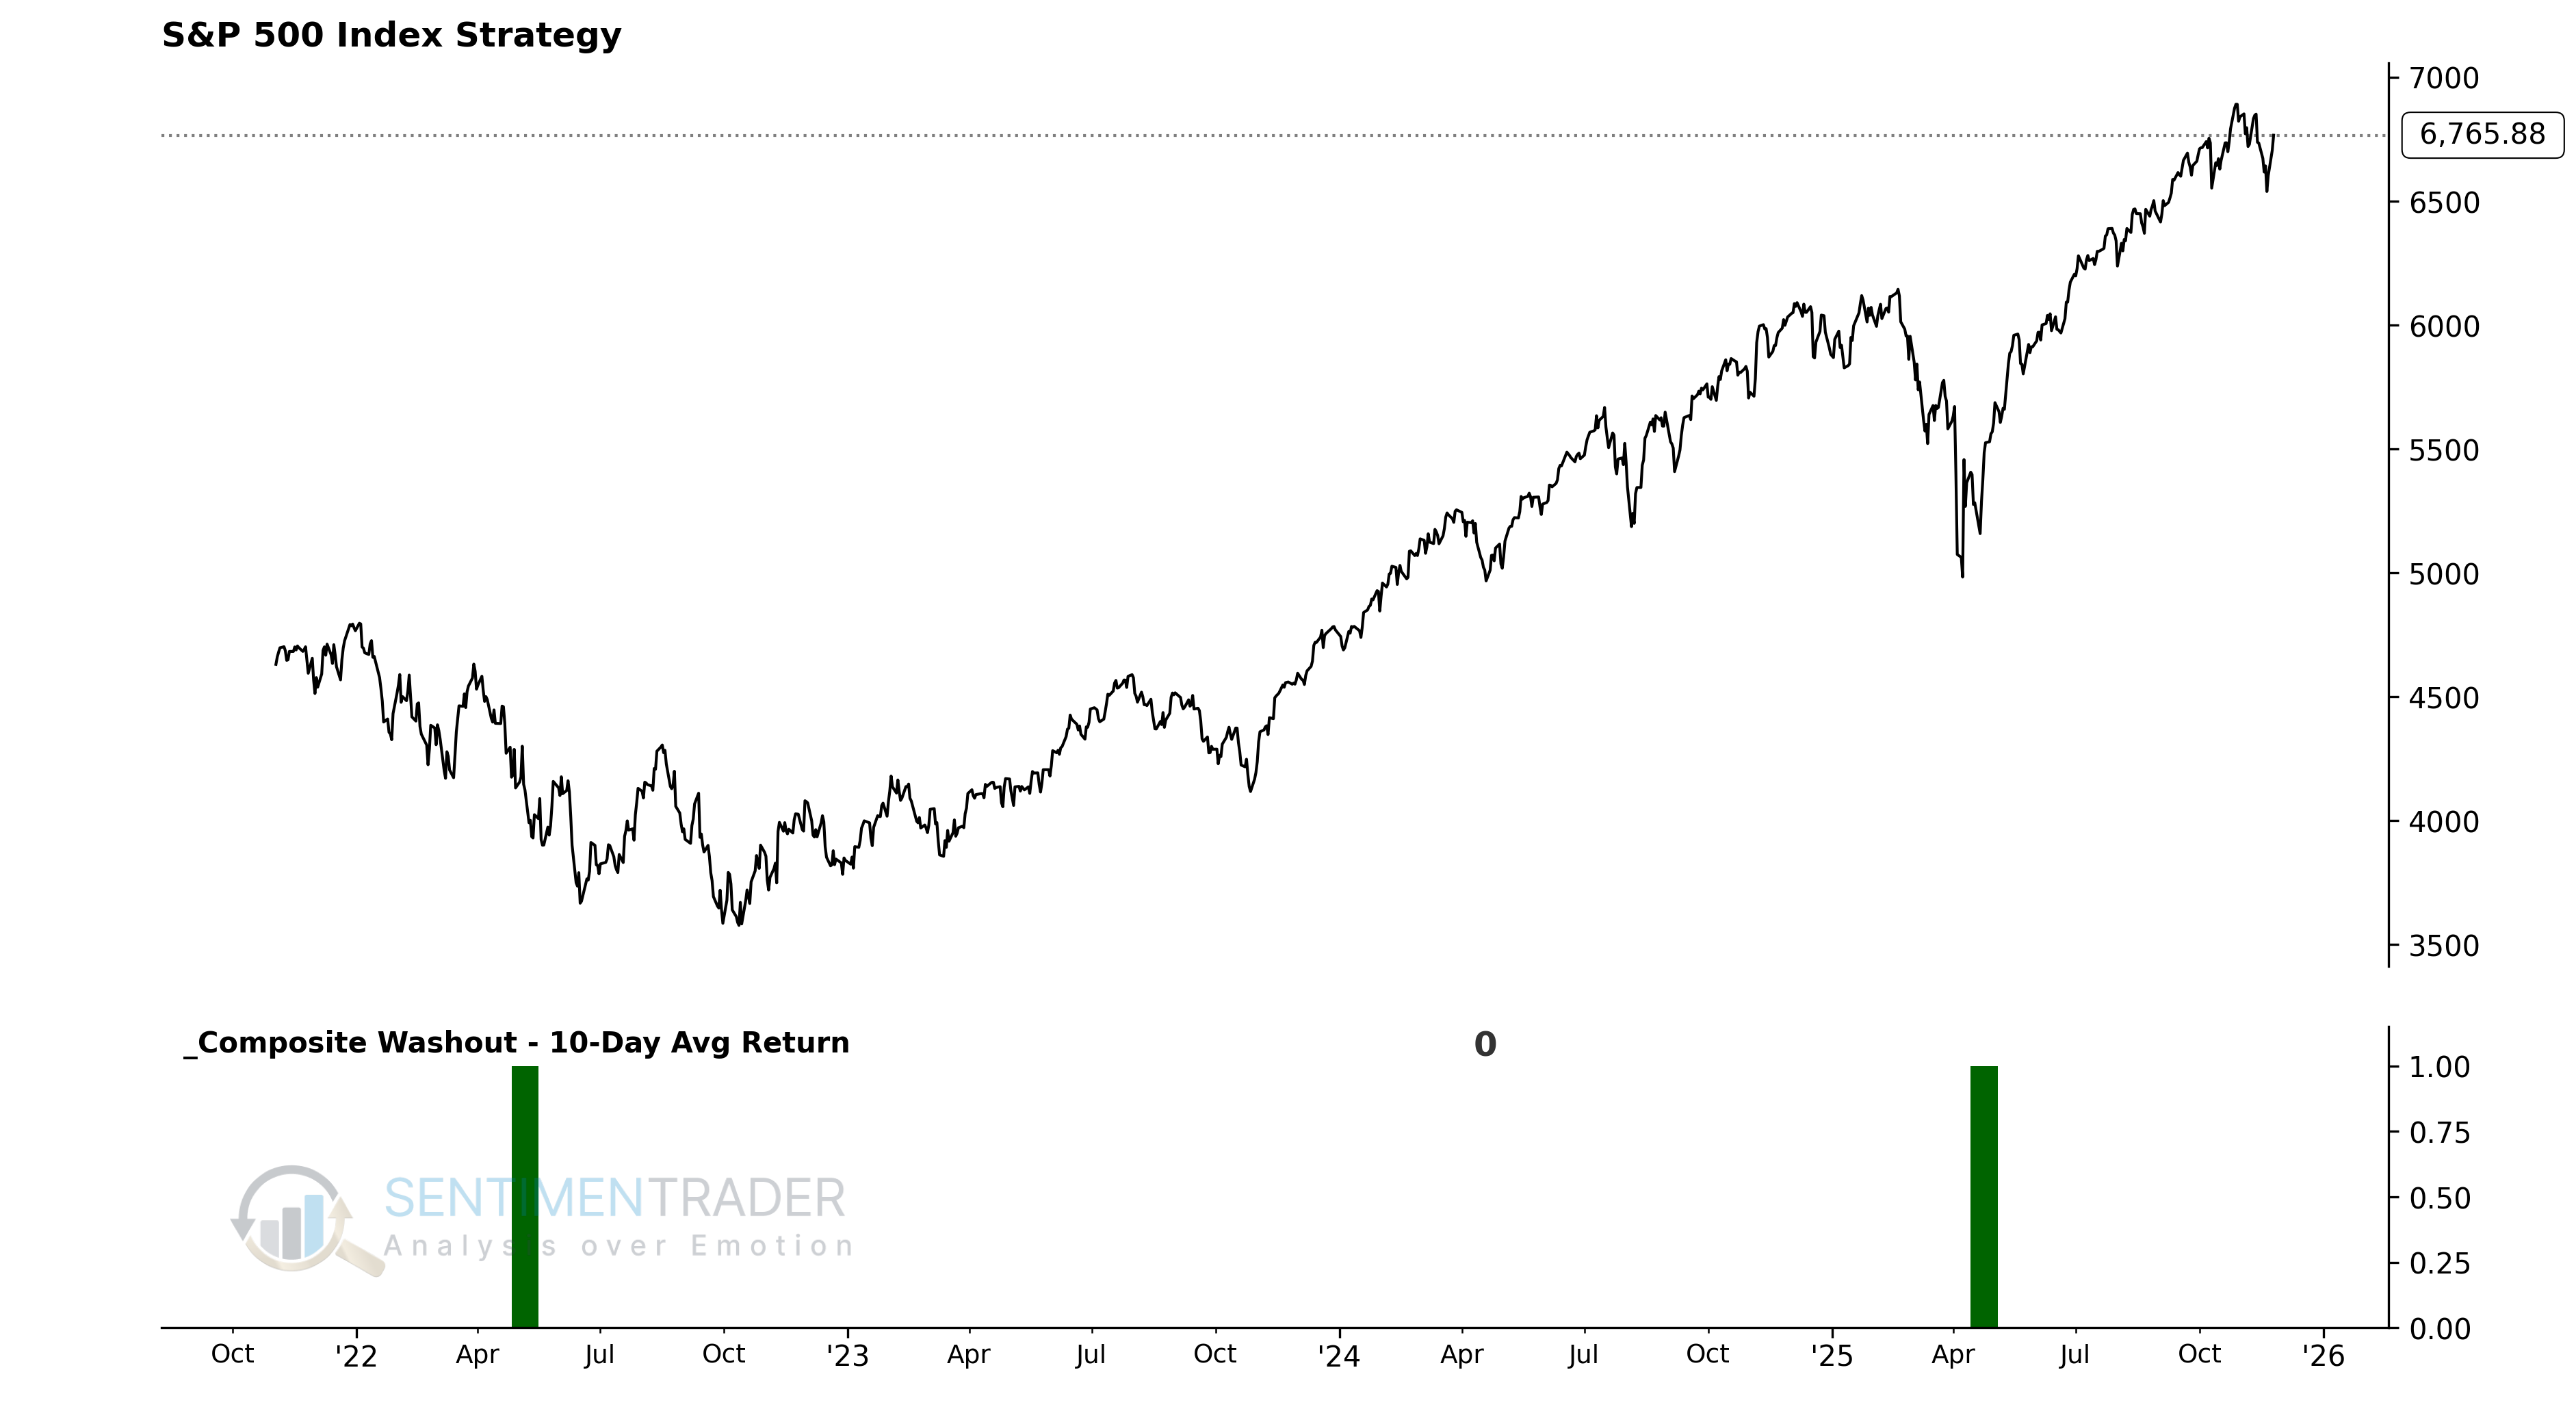
As the chart below illustrates, these individual components are combined into a single composite indicator-the Composite Washout Model-which uses a 0 or 1 value to issue alerts. Currently, the model shows a reading of 0, indicating no washout signal is active.
Component Deep Dive (Part II)
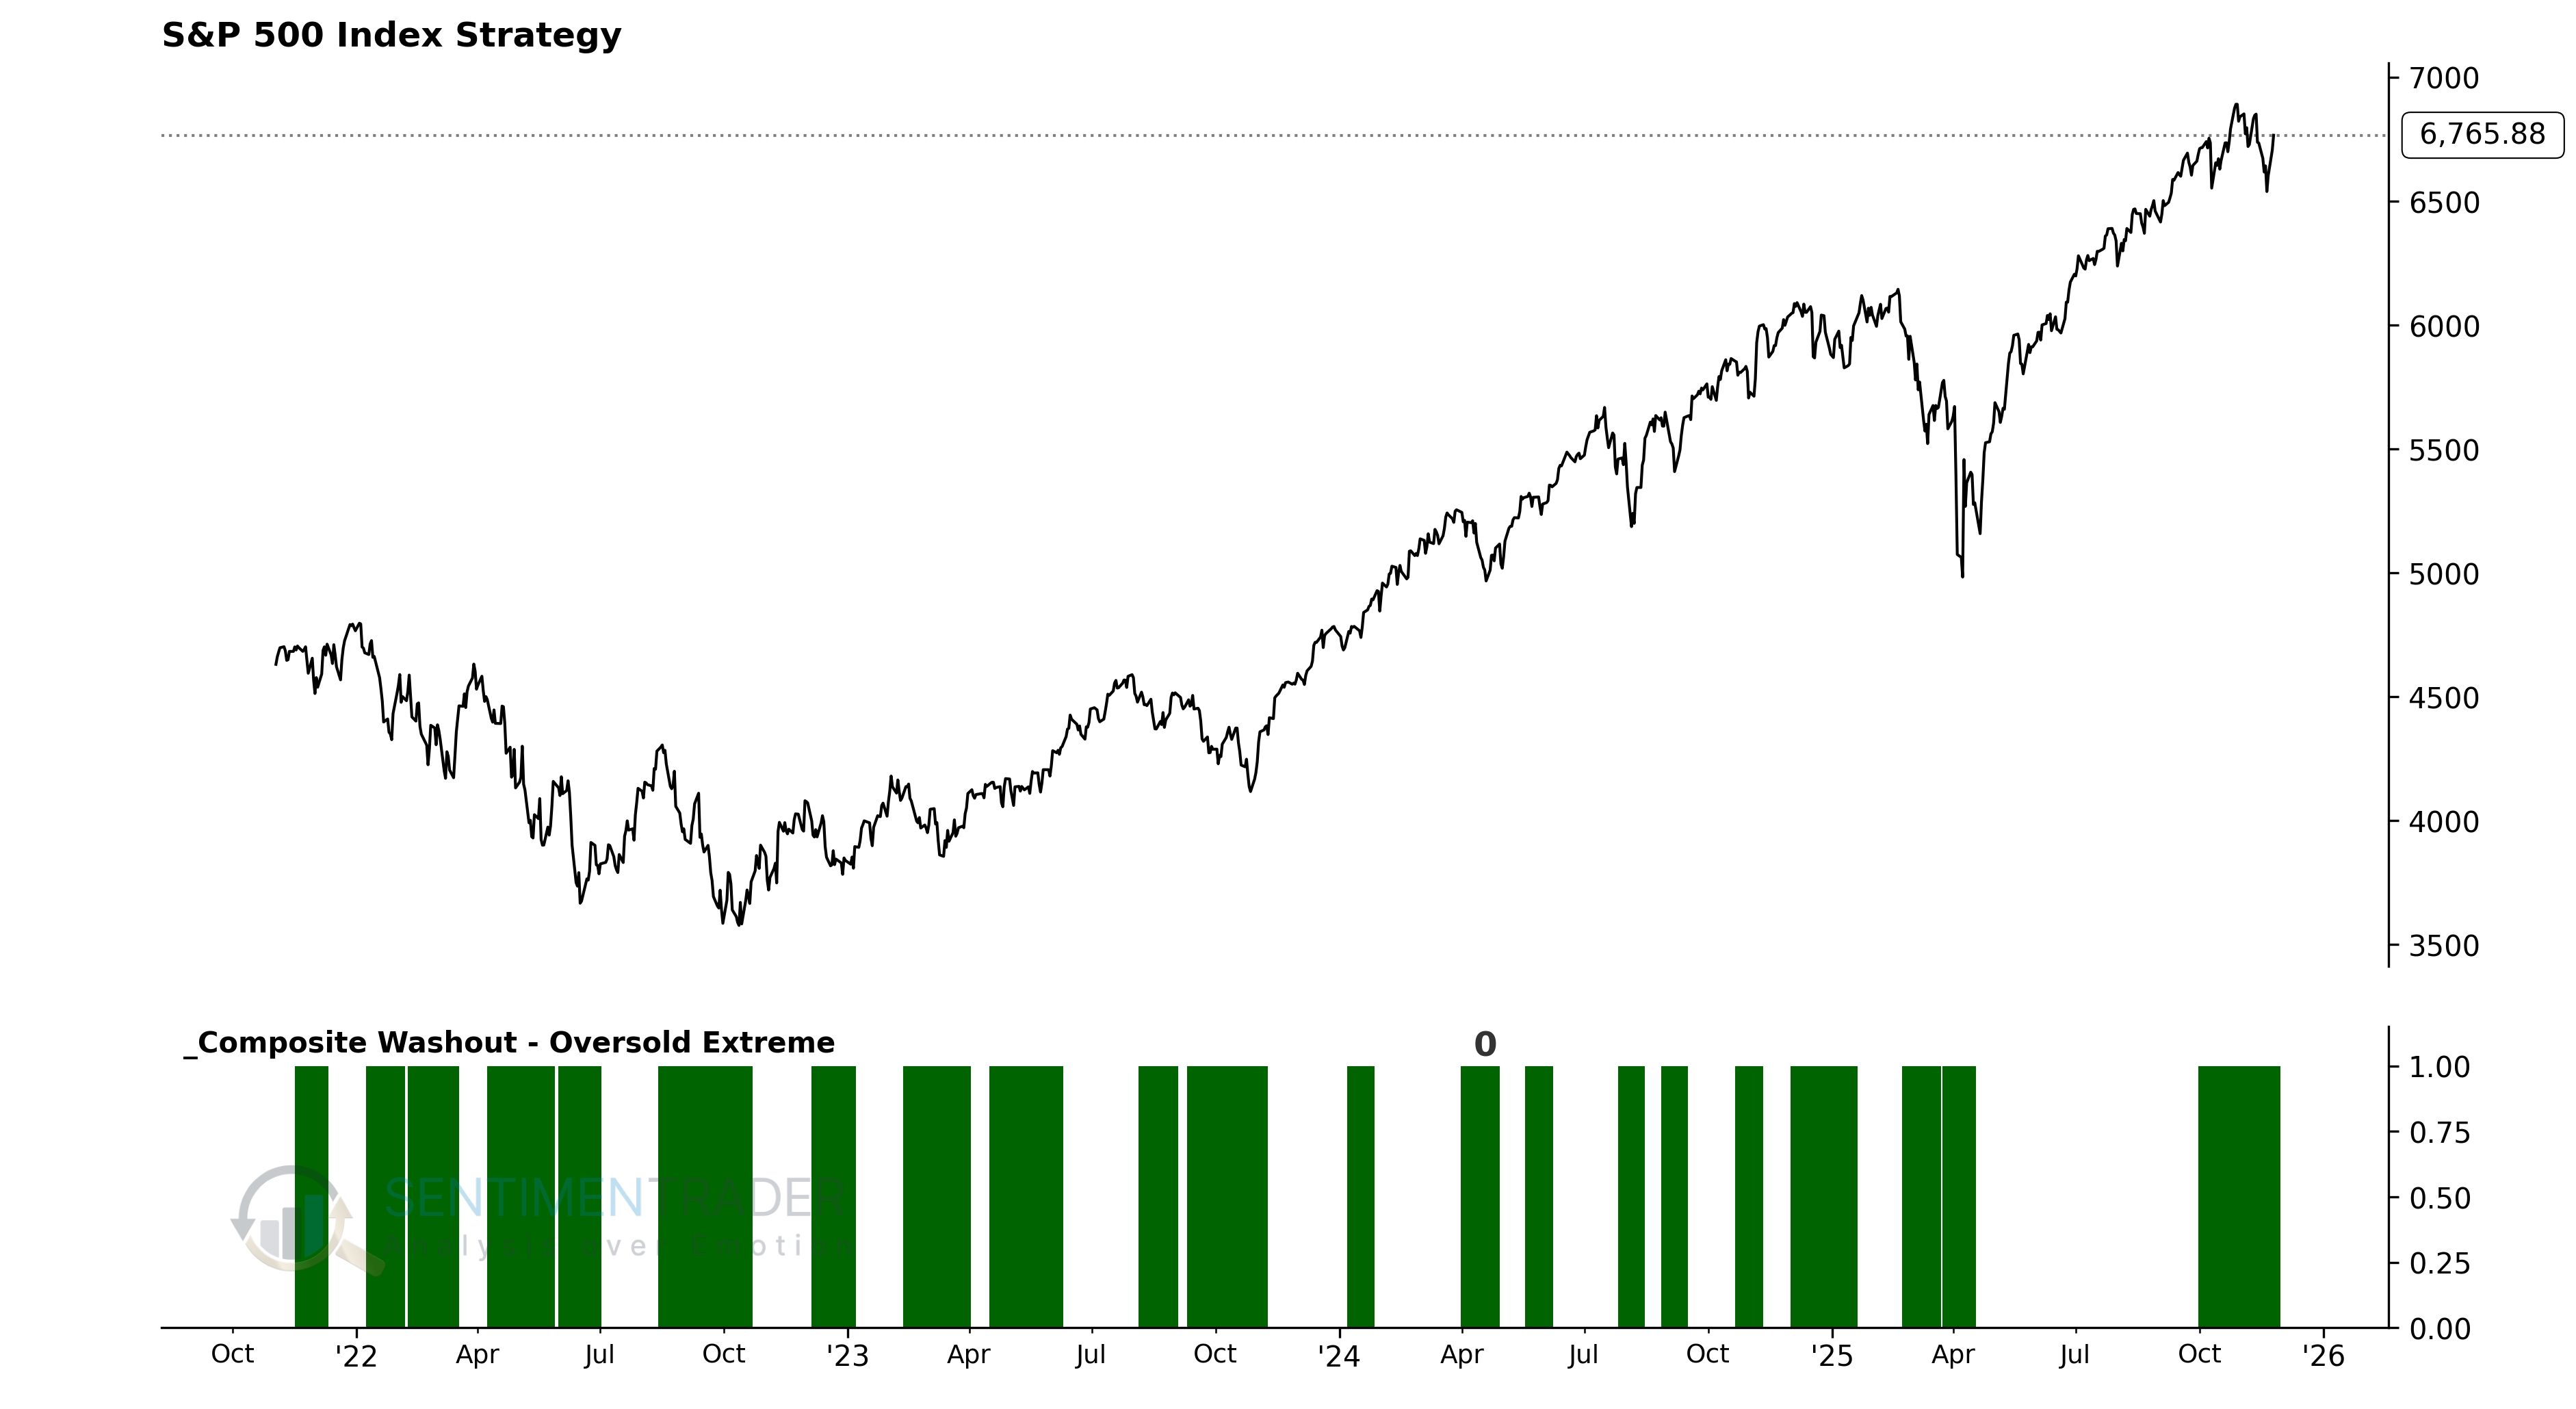
Oversold Extreme
The Oversold Extreme indicator measures the overall oversold condition of the market by aggregating the 14-day Stochastic Oscillator status of all S&P 500 component stocks. It is used to identify moments when a massive number of stocks are being sold off simultaneously.
Components
- 14-day Stochastic Oscillator values (%K) for all S&P 500 component stocks.
- Oversold threshold (Stochastic %K < 20).
Stochastic Oversold Extreme Model
This model aims to quantify market panic by calculating the proportion of "overextended" stocks. The Stochastic indicator measures where the current price is relative to its price range over the past 14 days. A value below 20 is typically defined as technically oversold. Instead of looking at the index itself, this model looks at what percentage of individual stocks have fallen into this oversold zone. When this percentage exceeds a critical threshold, it indicates that selling pressure has spread from individual stocks to the broad market, often a precursor to a short-term bounce. I use it as an "early warning" or "watch zone" signal.
Signal Criteria
- Condition 1 = Calculate the 14-day Stochastic Oscillator (%K) for all component stocks.
- Condition 2 = Count the number of stocks with a %K value below 20 and calculate it as a percentage of the total number of stocks (Oversold Extreme %).
- Condition 3 = This percentage is greater than 40% (i.e., more than 40% of stocks are in a technical oversold state).
- If Condition 3 is met, an Oversold Extreme signal is issued.
Current Day Chart
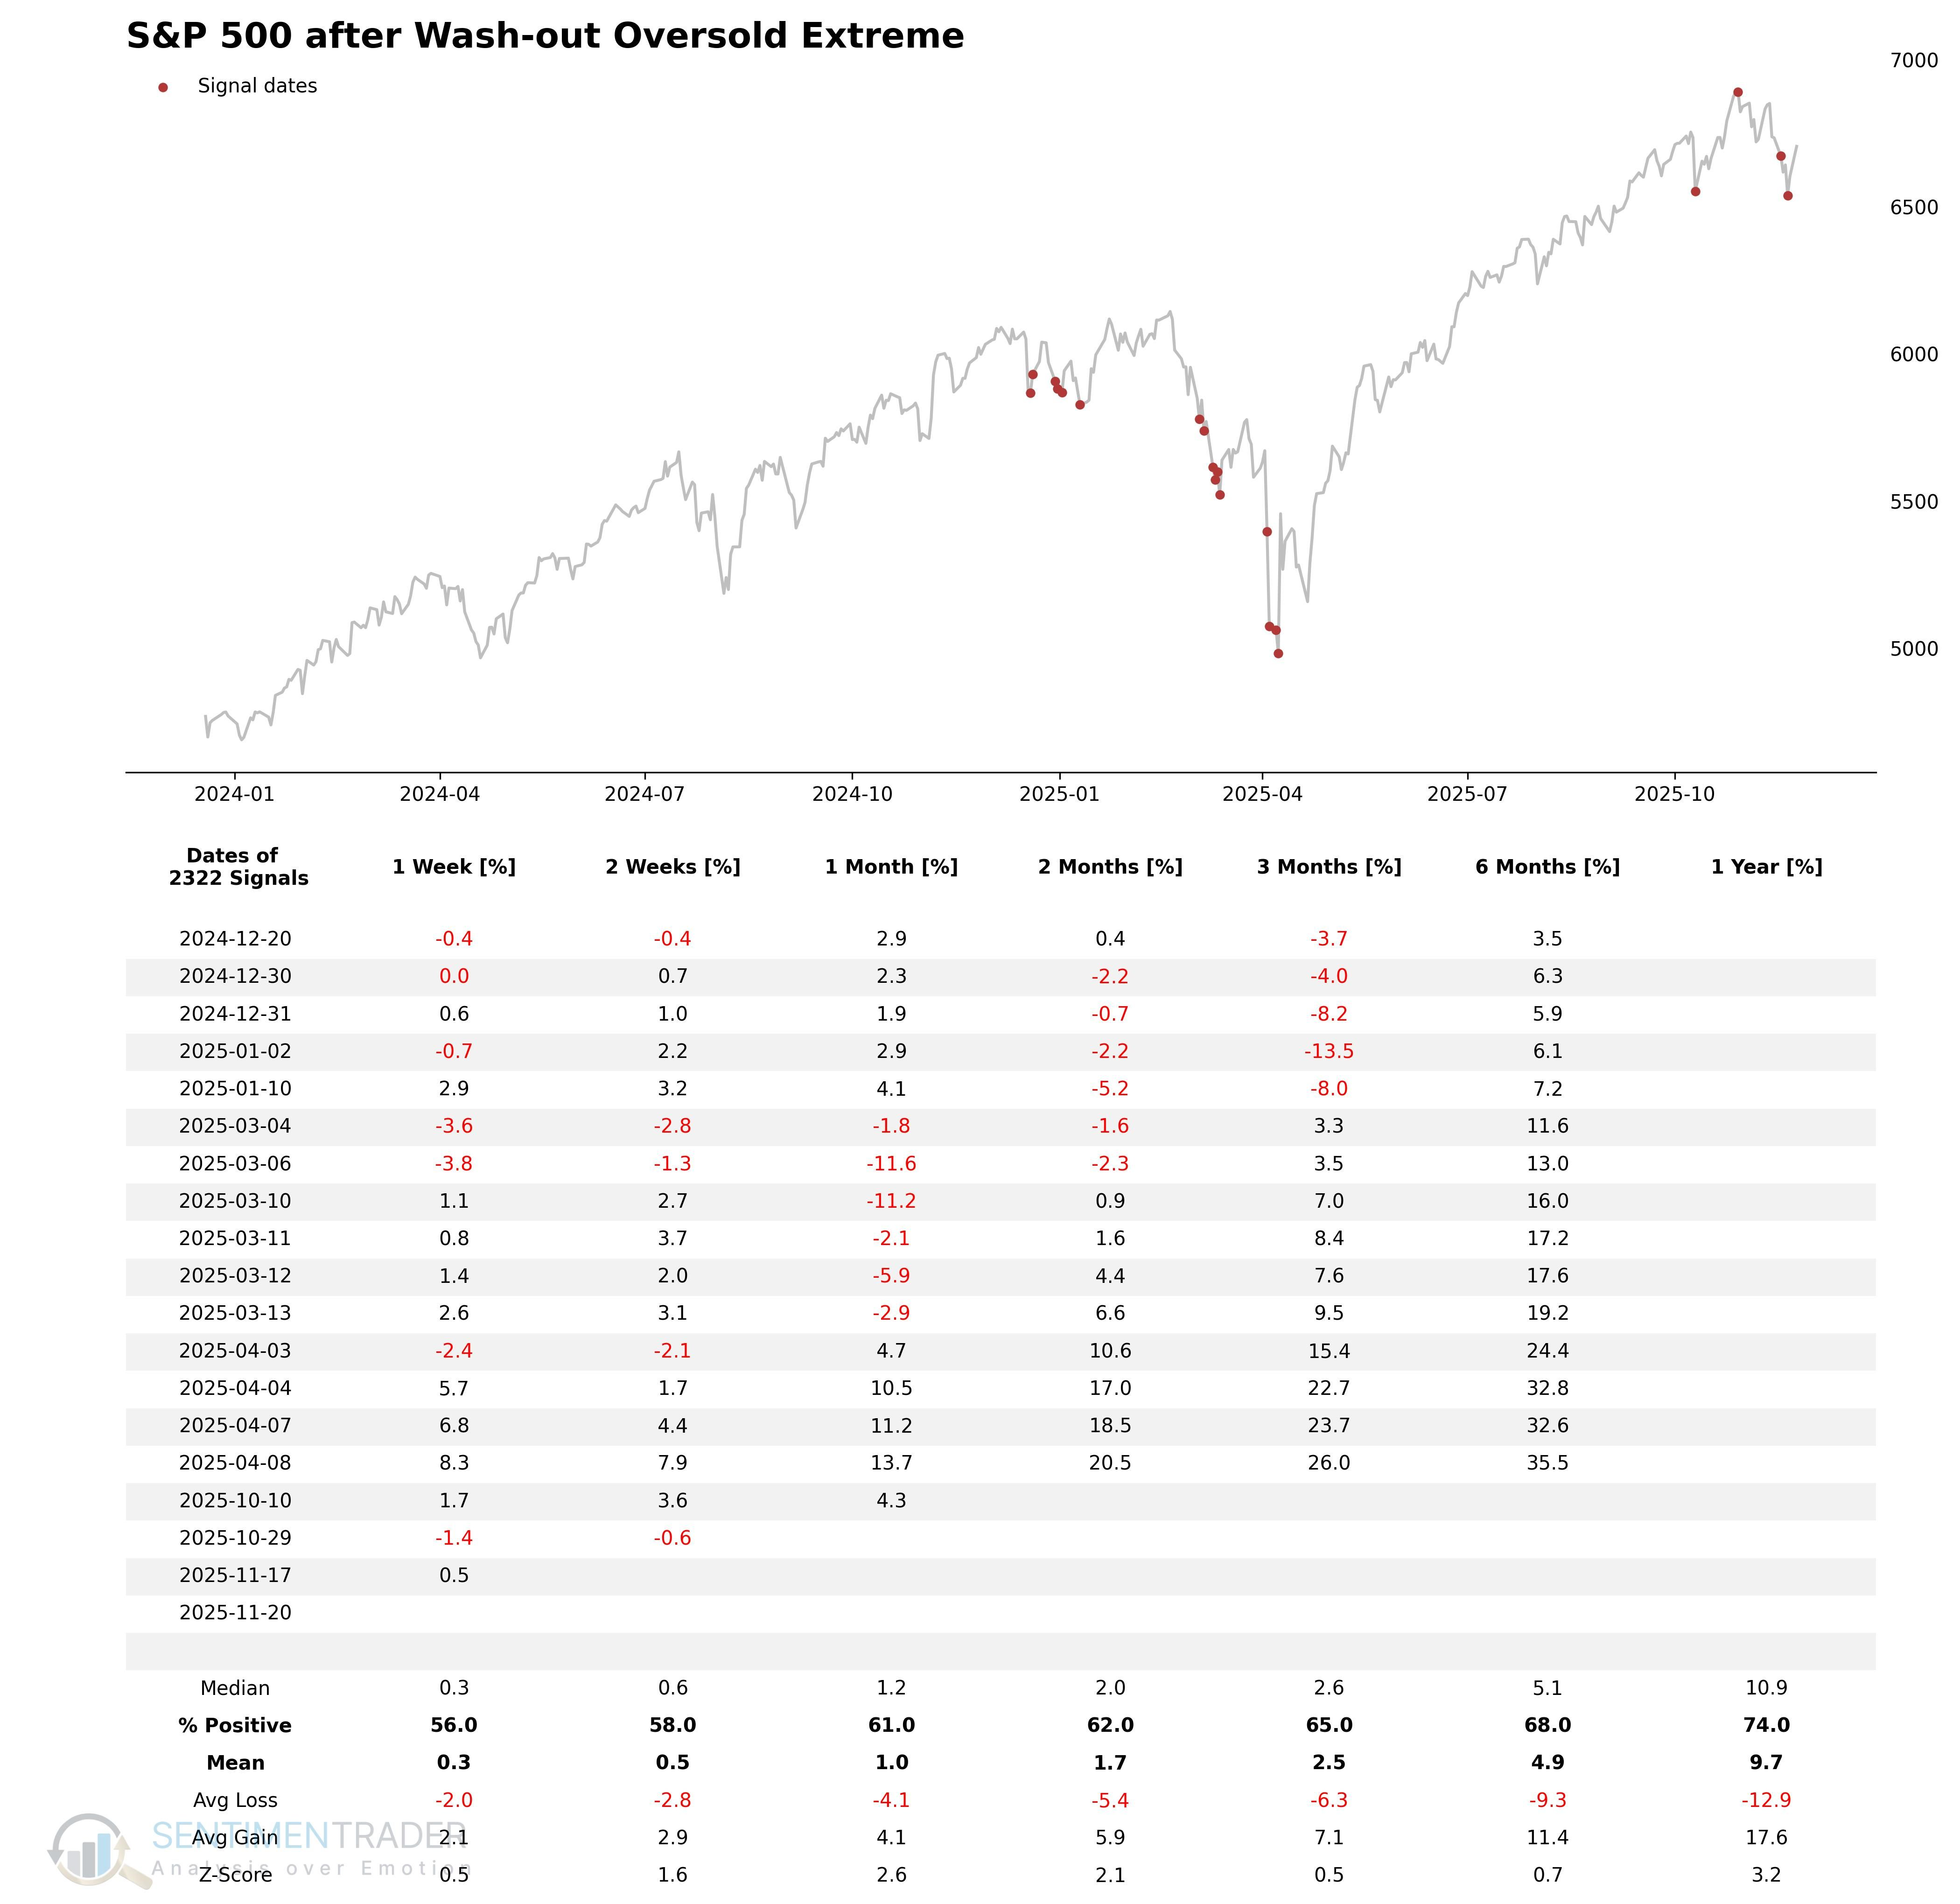
Signal Performance
As can be seen, positive performance was demonstrated for the majority of the time period.
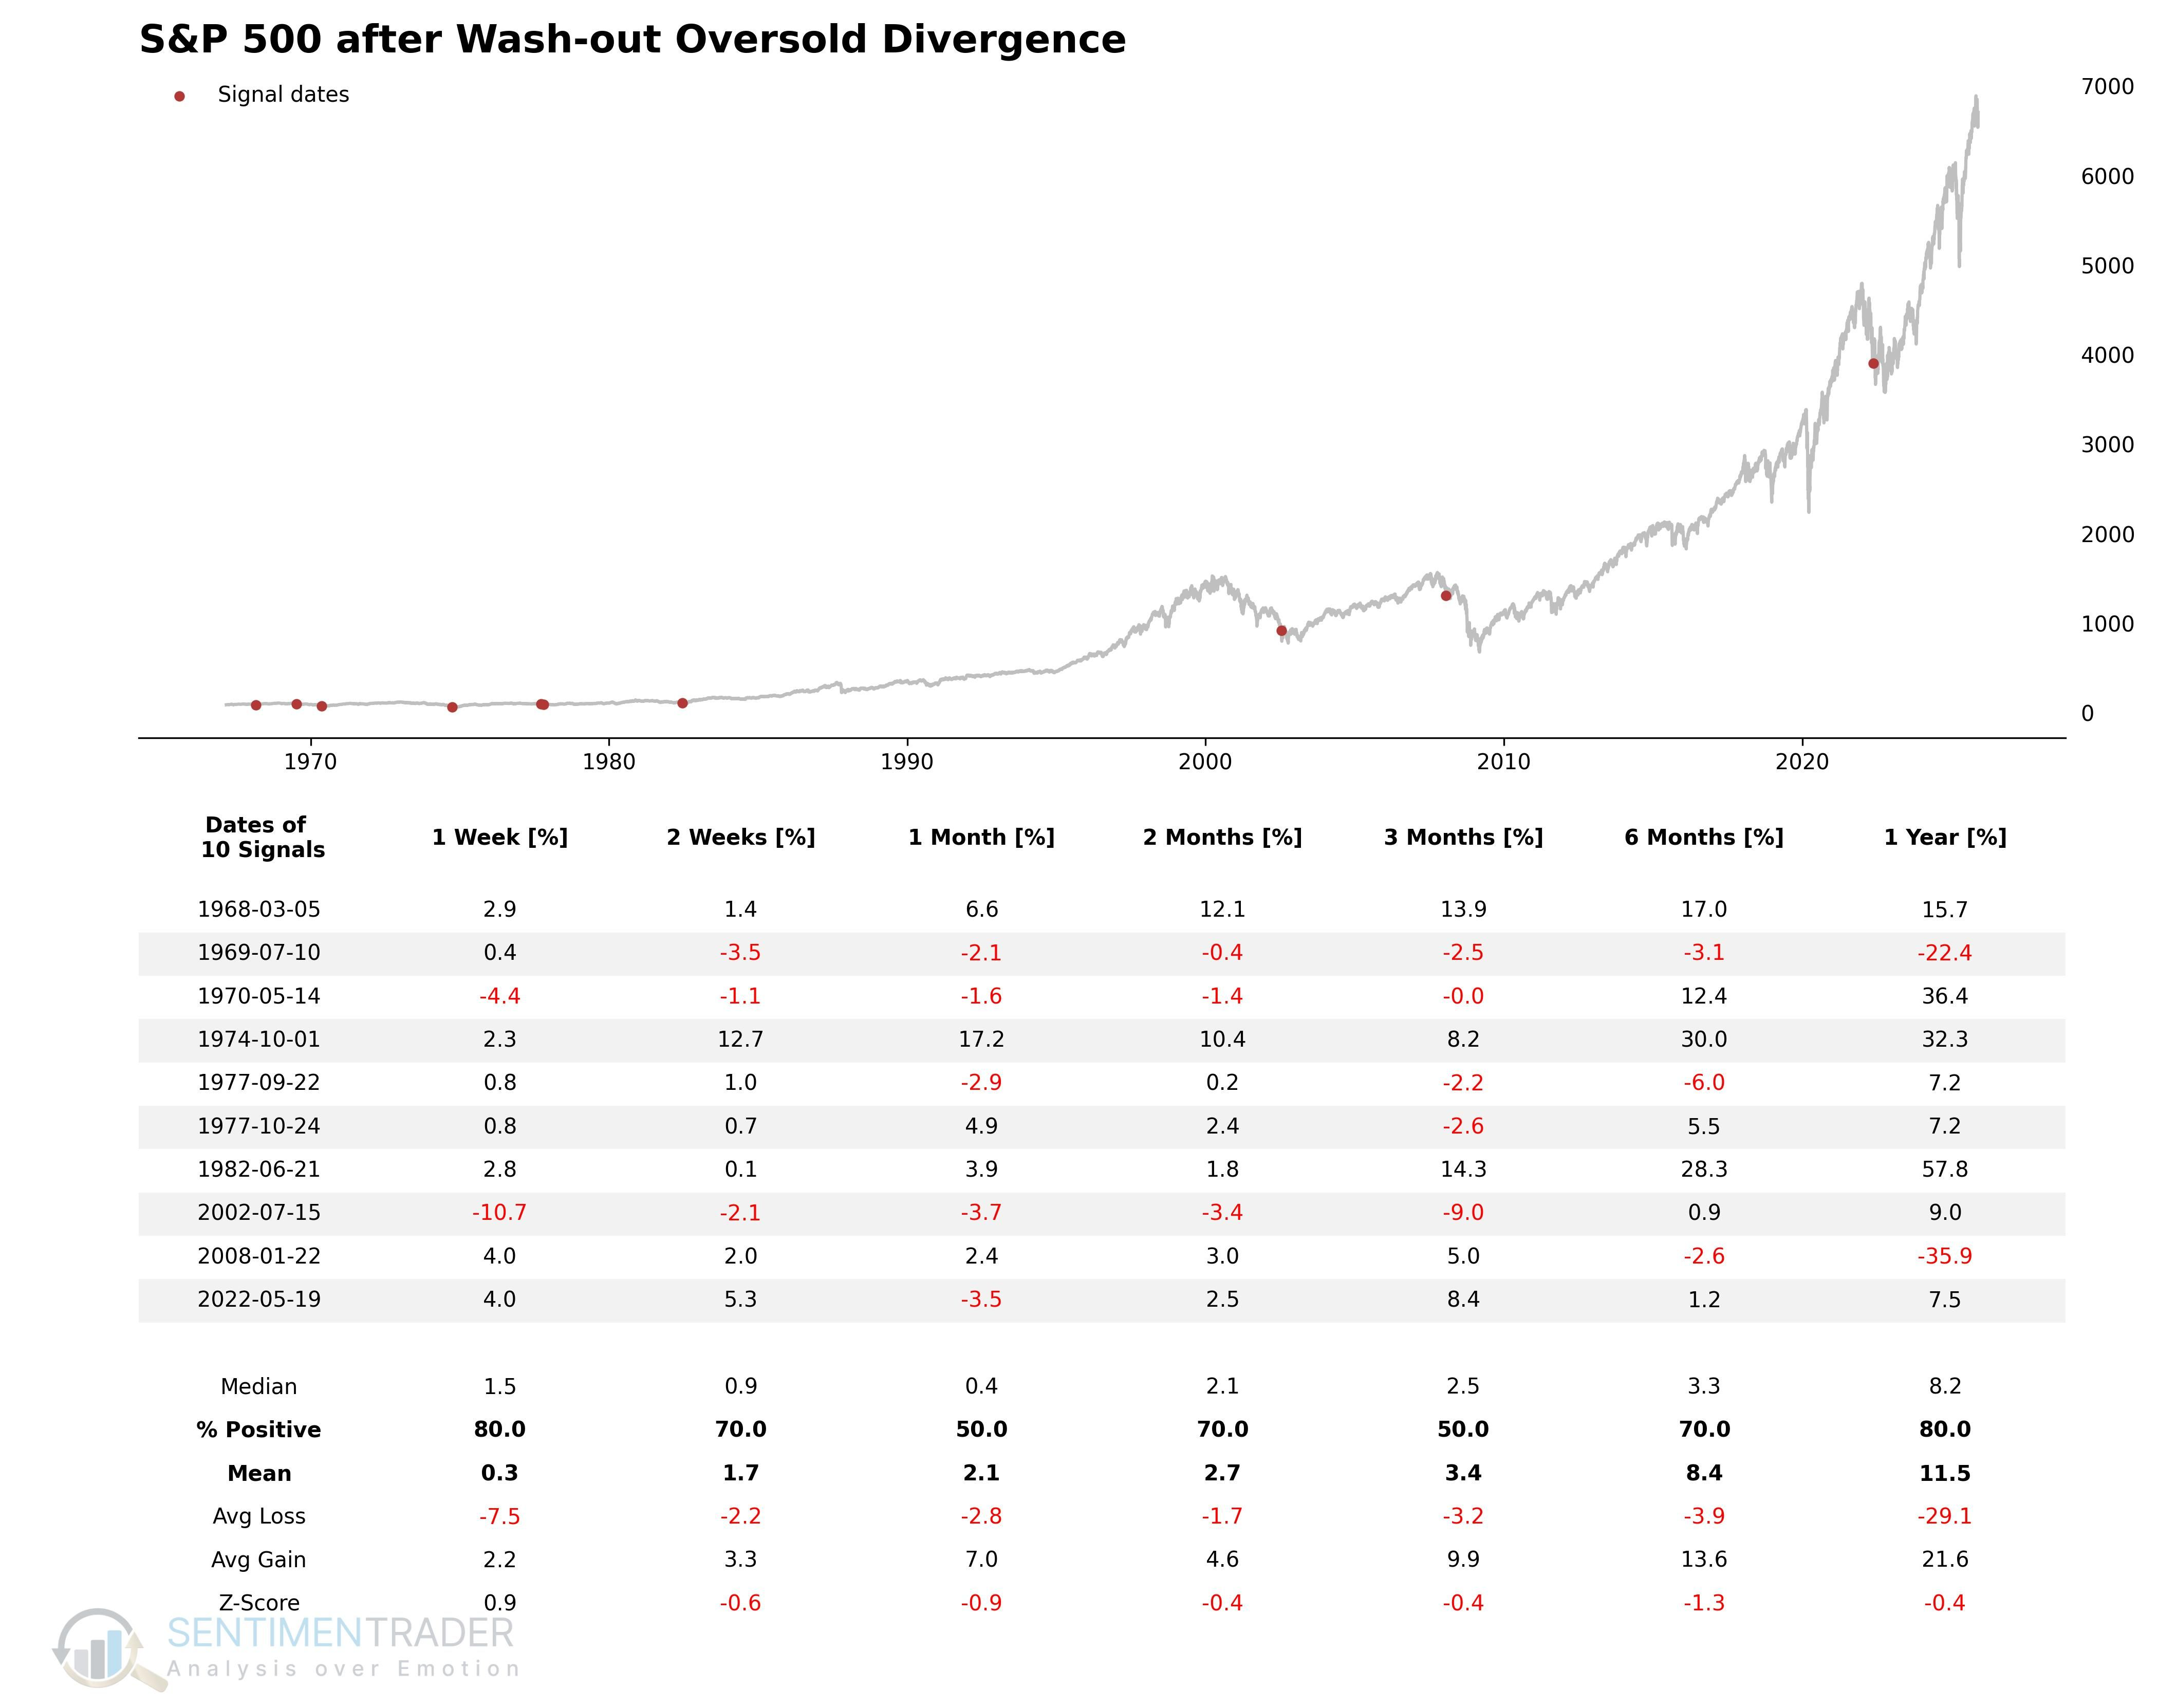
Oversold Divergence
The Oversold Divergence indicator utilizes the divergence relationship between the percentage of stocks oversold (based on Stochastics) and new lows in the underlying index to identify market bottoms. It captures the key reversal characteristic: "The index is falling, but the number of stocks that are technically oversold is decreasing."
Components
- Oversold Extreme % (Percentage of stocks with Stochastic < 20).
- Whether the underlying asset has hit a new 252-day (52-week) low.
Oversold Divergence Model
This model aims to identify the final stages of a market washout process. The model first detects if the market has experienced high panic (more than 40% of stocks in the oversold zone), and then waits for the internal structure to improve (oversold percentage retreats), but on the same day, the underlying price hits a new one-year low due to inertia. This phenomenon of "price making a new low, but oversold breadth not making a new high" triggers a buy signal.
Signal Criteria
- Condition 1 = Oversold Extreme % was previously in a high-stress zone (> 40).
- Condition 2 = Oversold Extreme % falls back to the observation zone (< 40).
- Condition 3 = S&P 500 closes at a 252-day low.
- If Conditions 1-3 are met, an Oversold Divergence Model signal is issued.
Current Day Chart
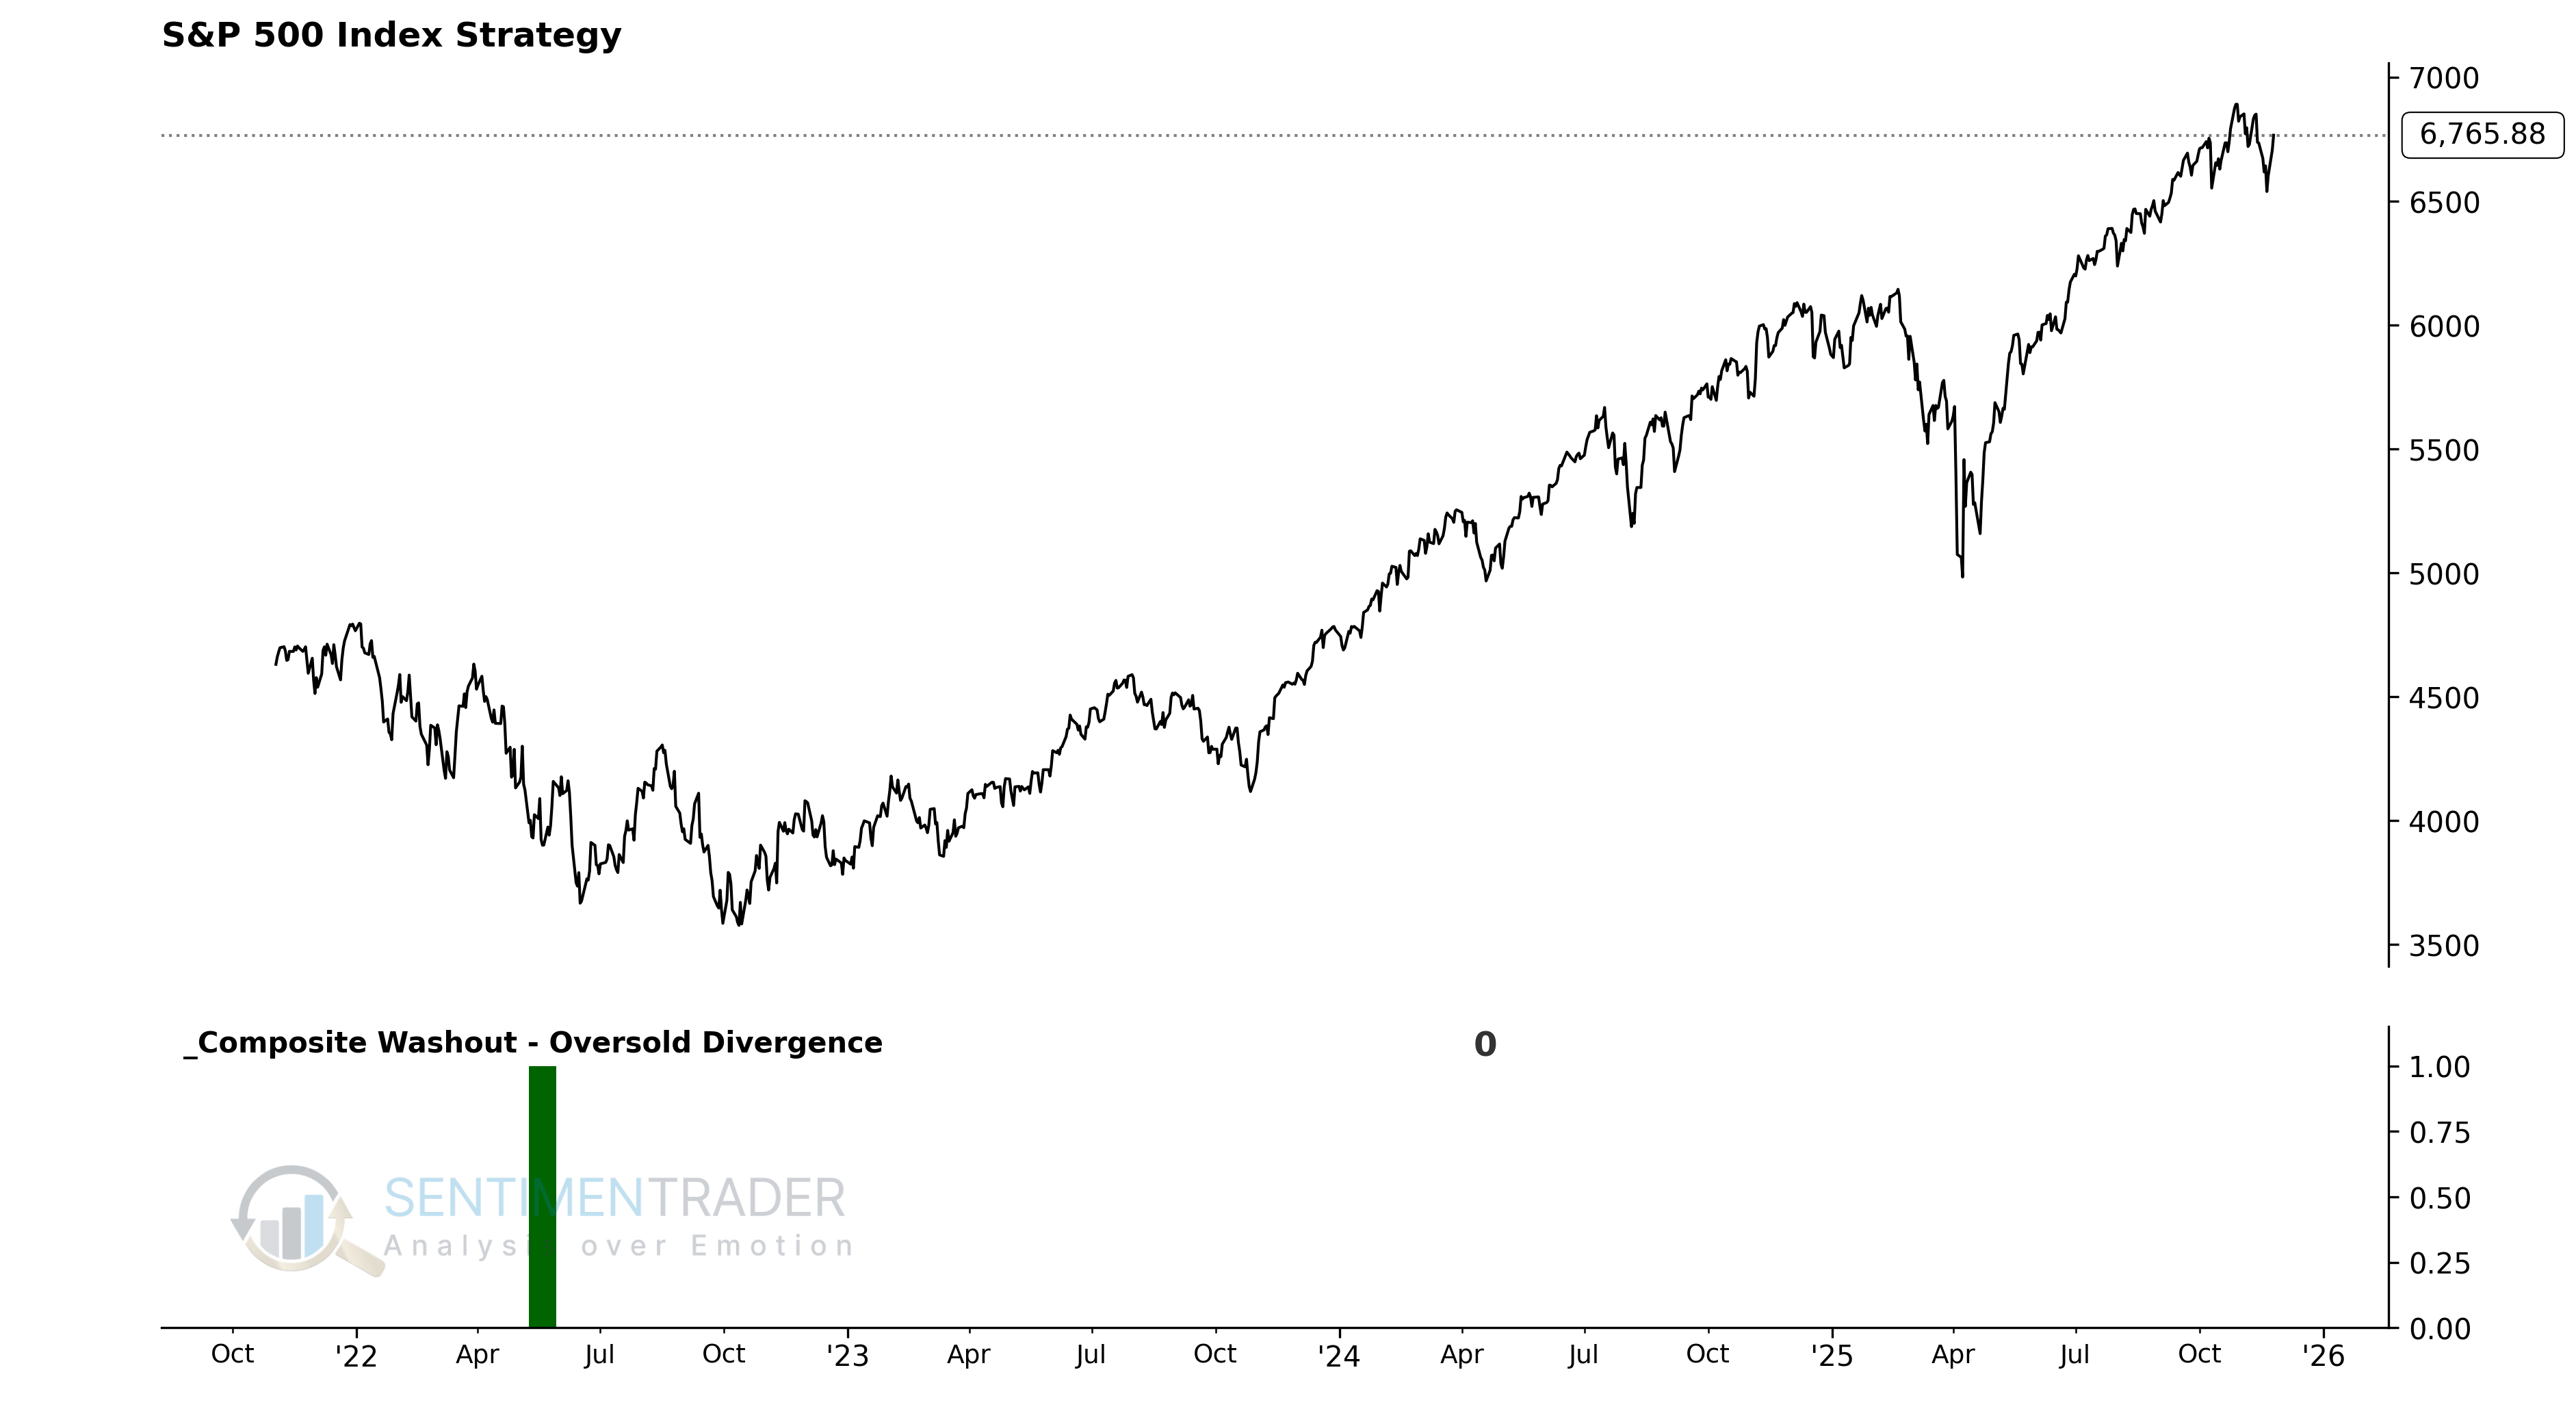
Signal Performance
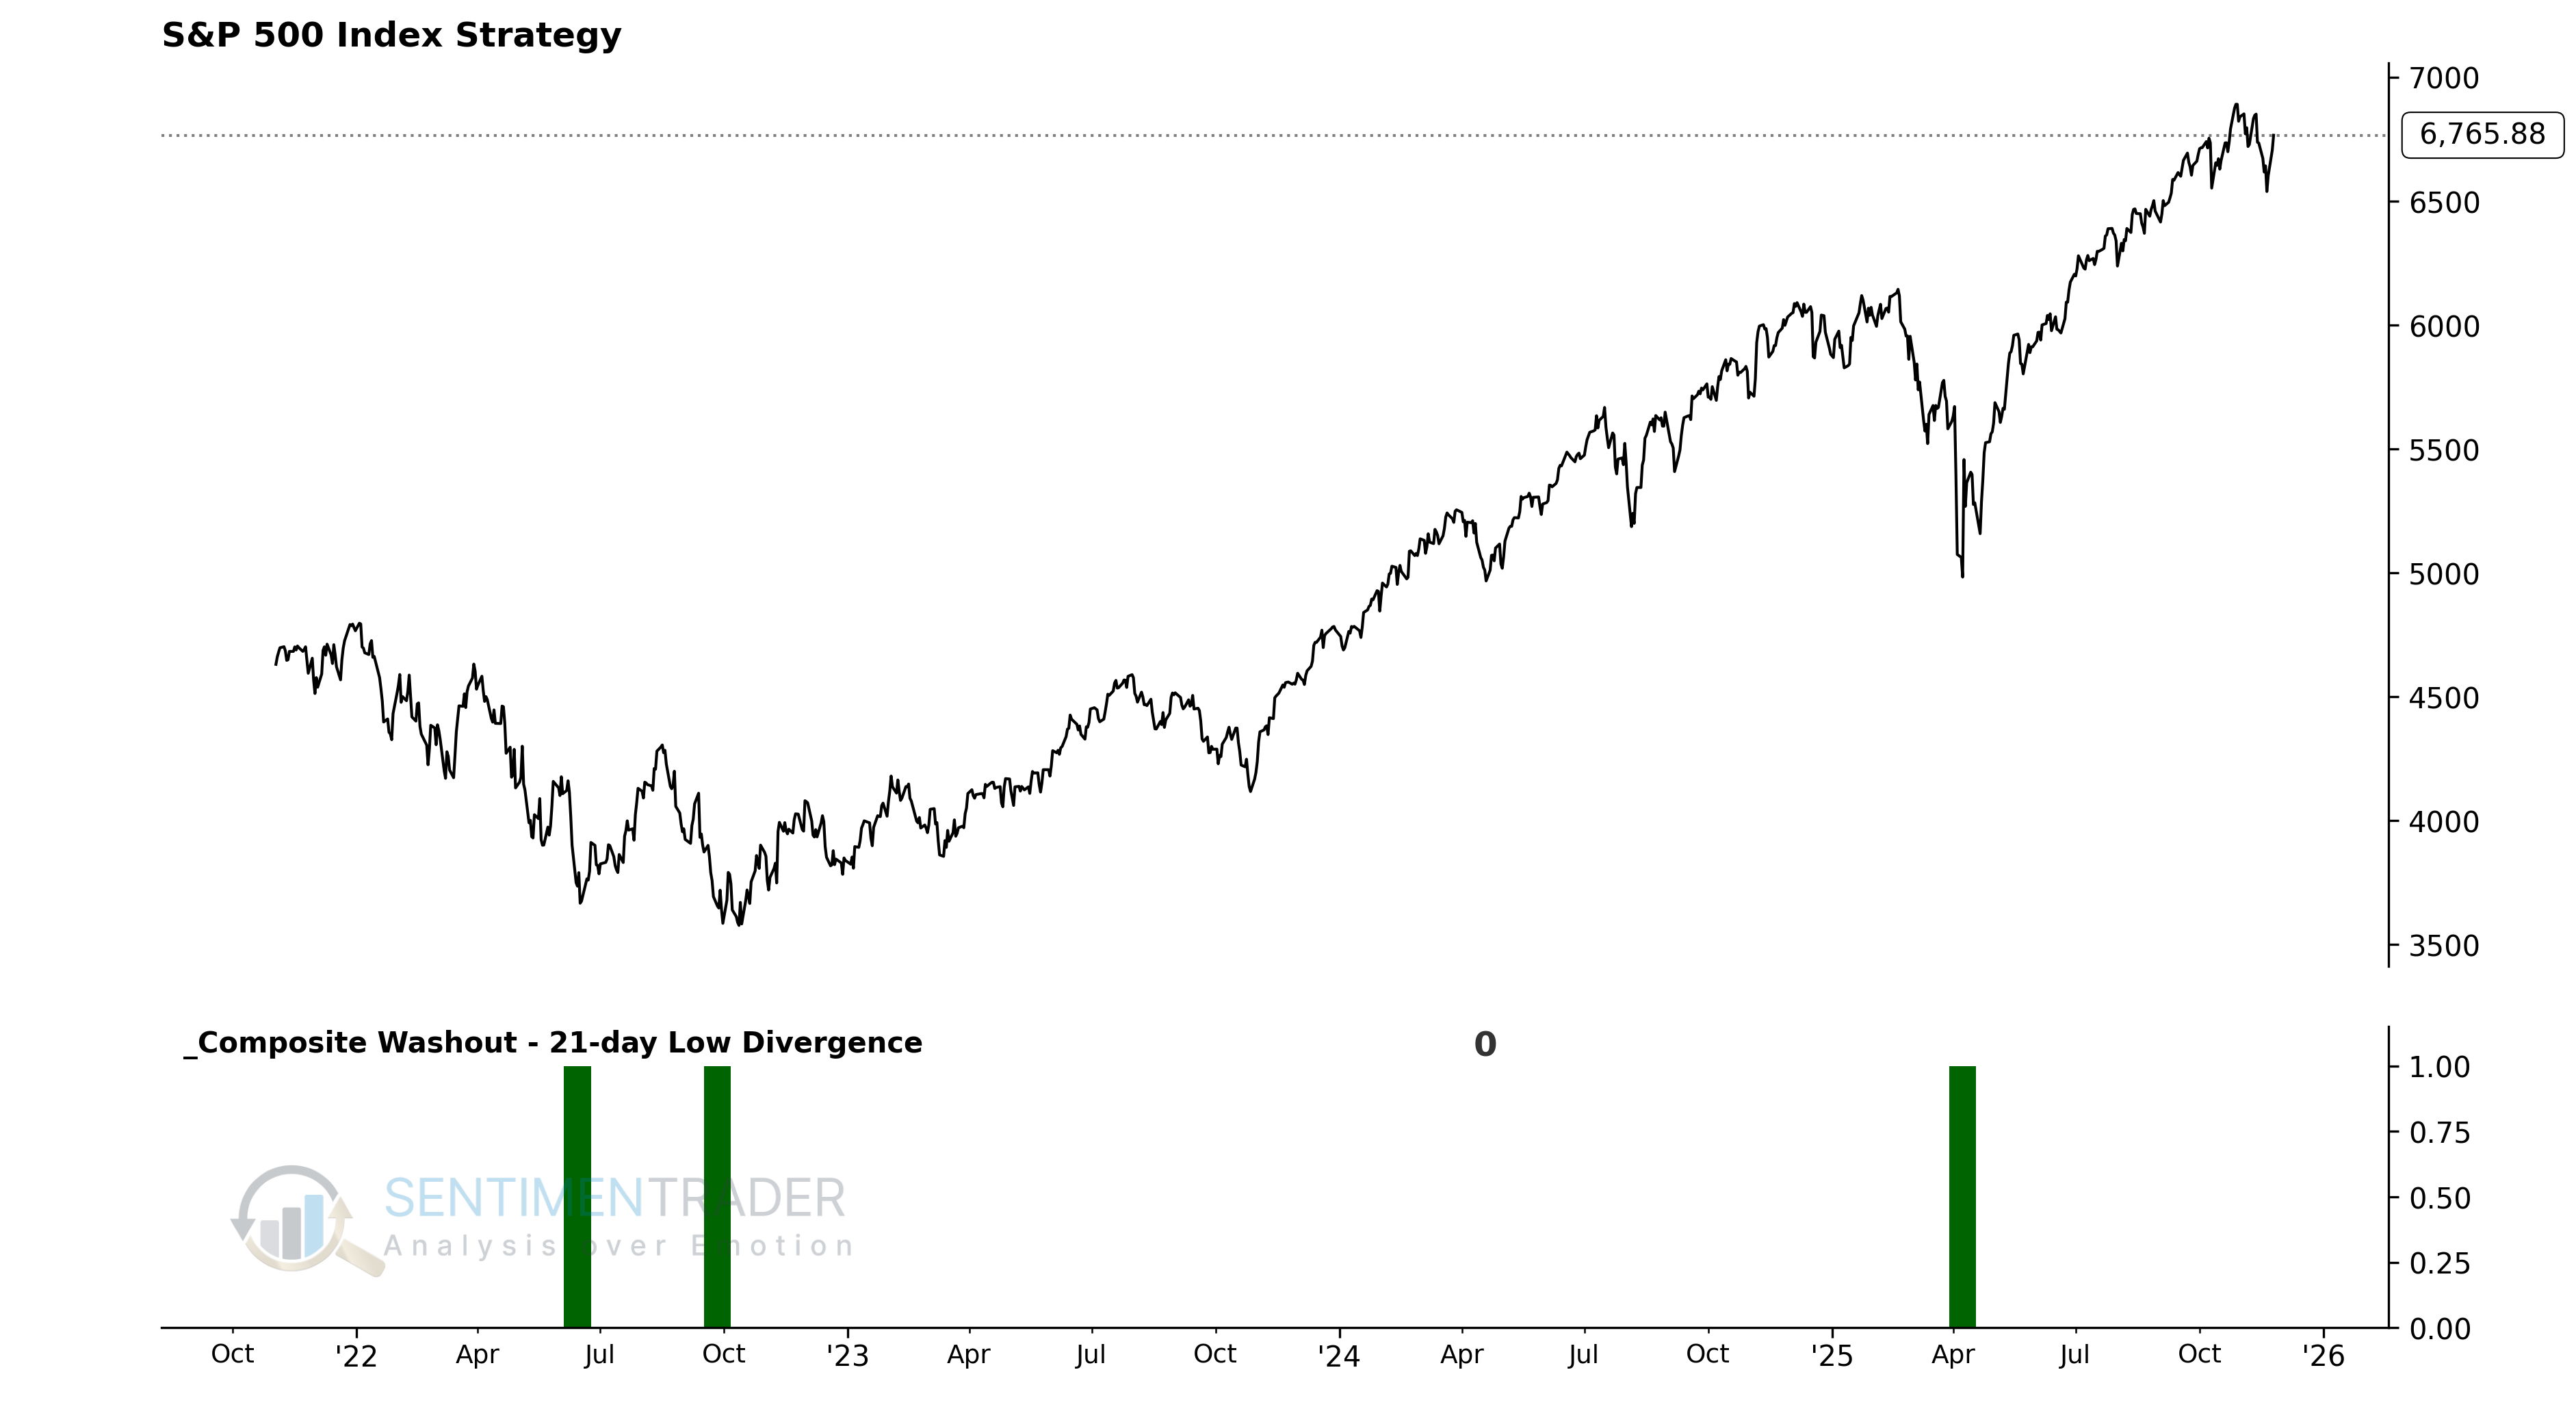
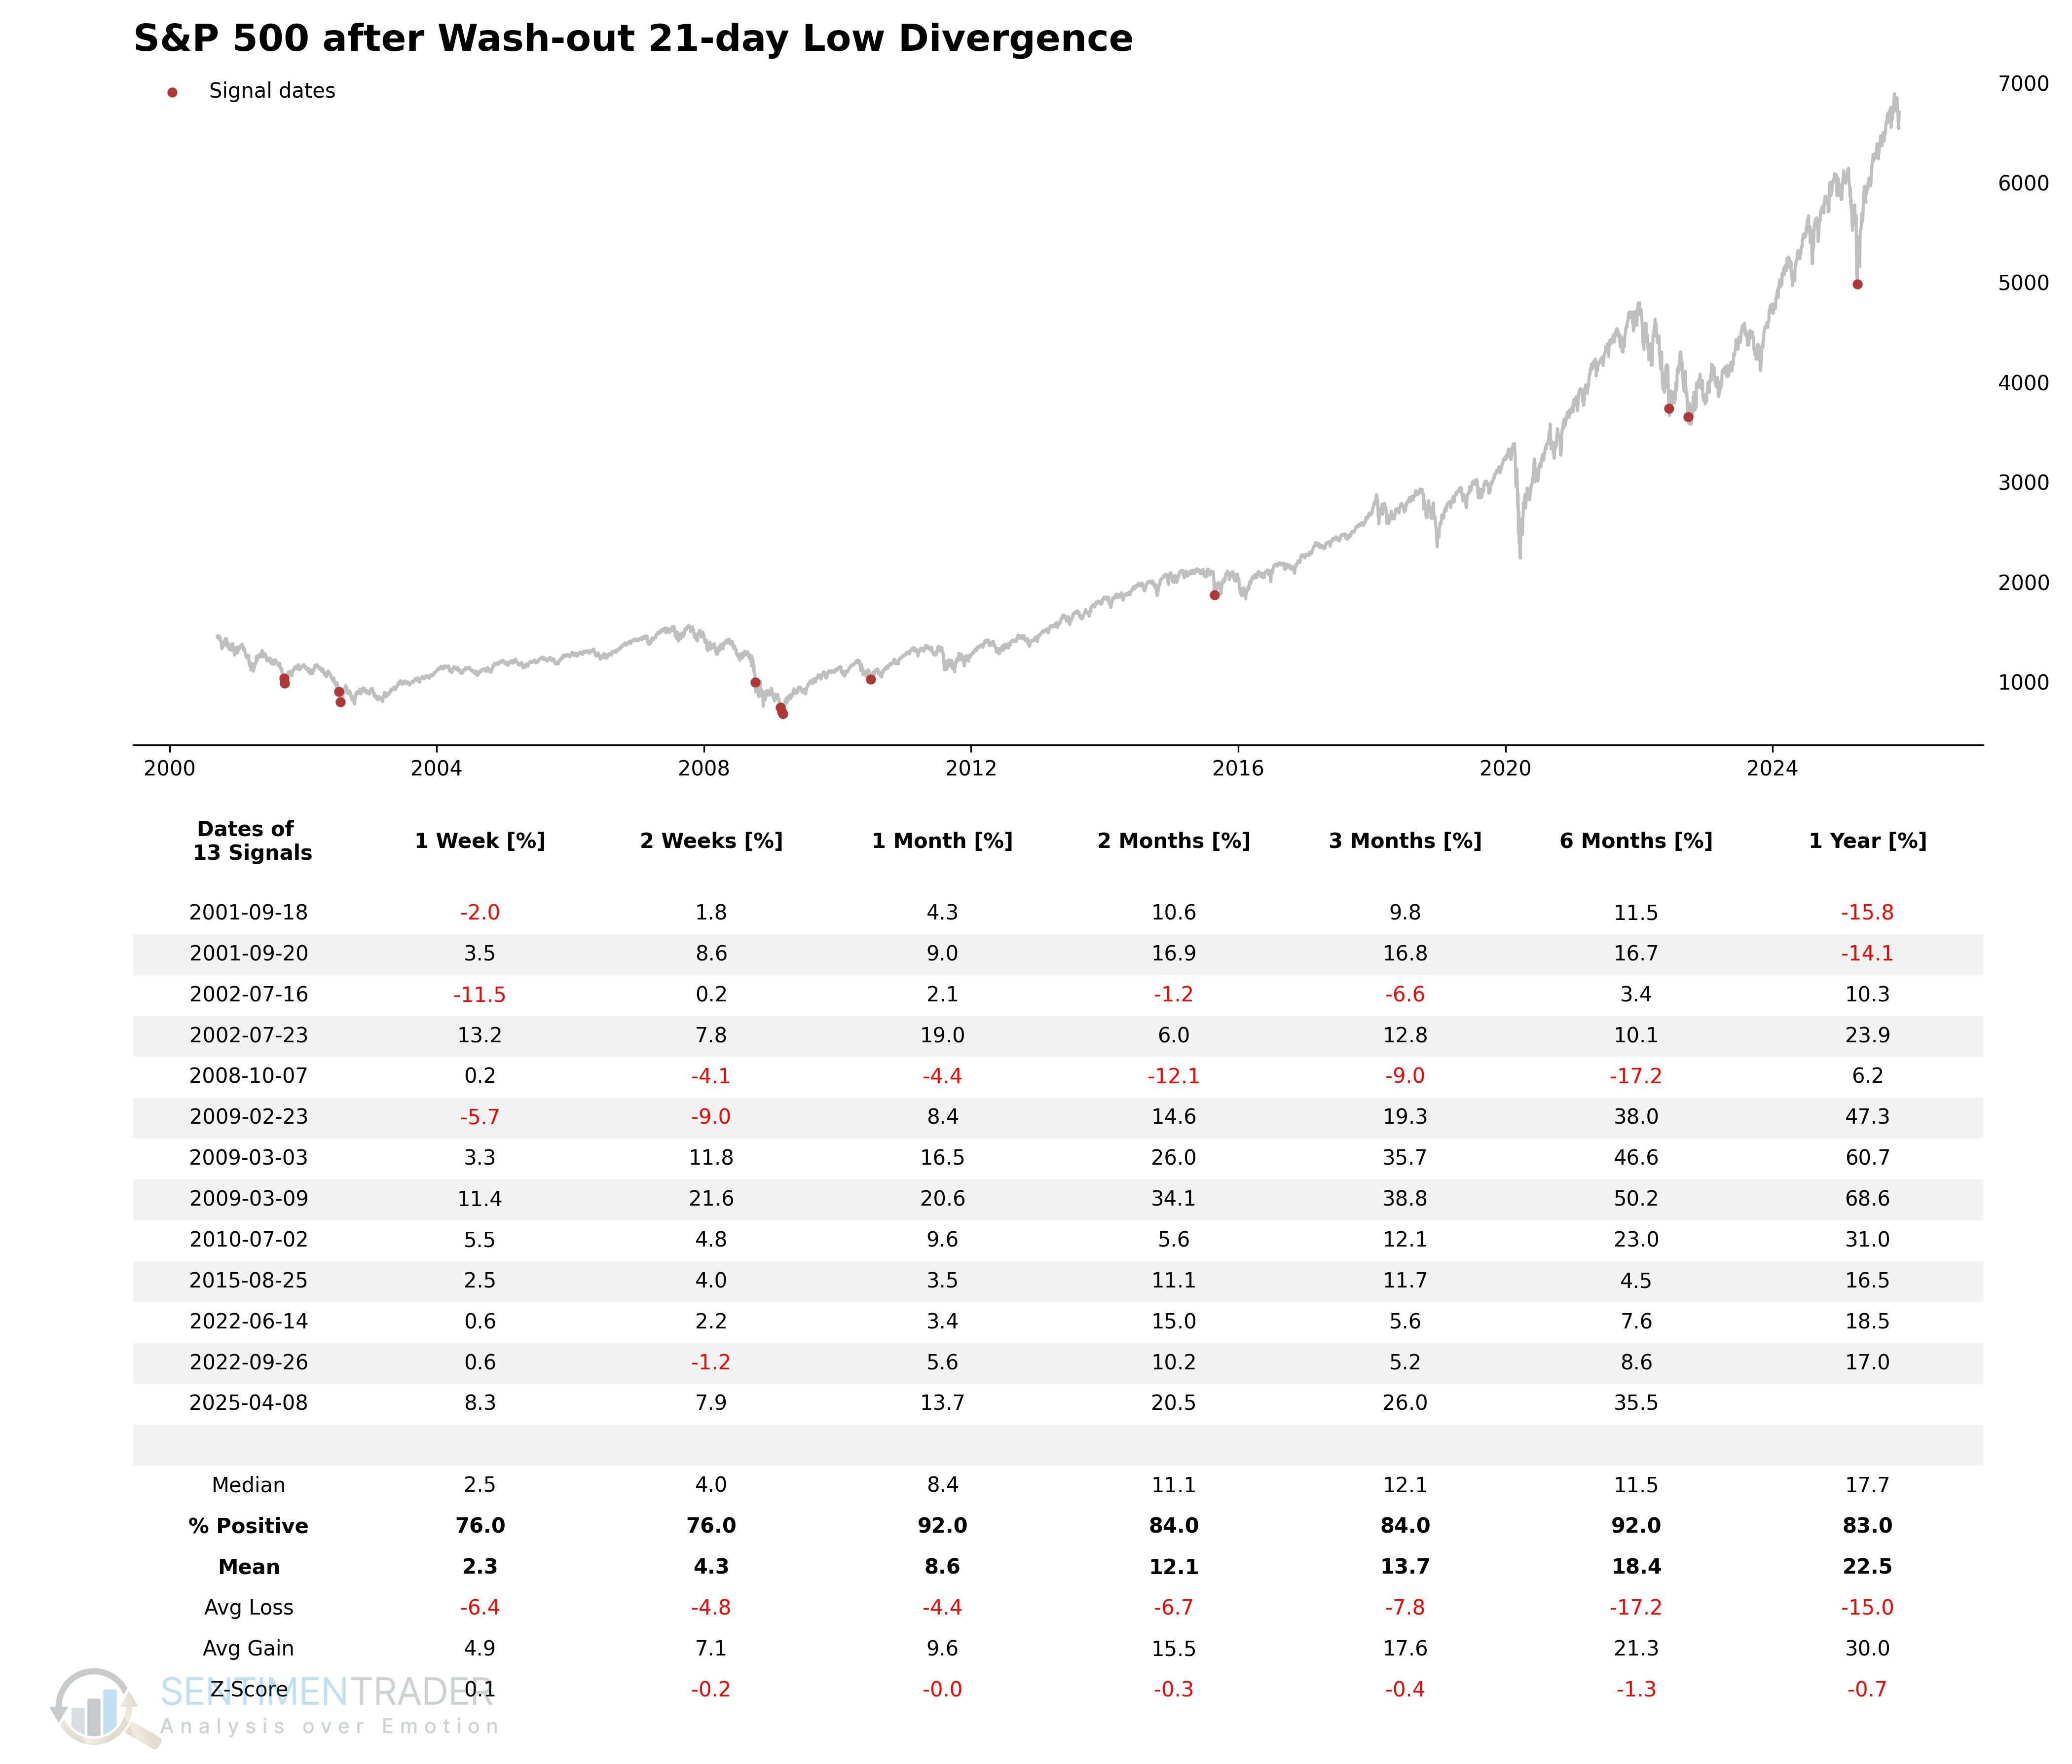
21-Day Low Divergence
The 21-Day Low Divergence indicator compares short-term (4-week) market breadth data with medium-term (100-day) price action. It aims to identify reversal opportunities when short-term internal selling pressure (21-day new lows) begins to abate, but the underlying price still makes a medium-term (100-day) low due to inertia.
Components
- Percentage of SPY stocks making 4-week lows.
- Whether the underlying asset has hit a new 100-day low.
21-Day Low Divergence Model
This model aims to capture "exhaustion after short-term extreme panic." The model first detects if short-term market breadth has entered a high-stress zone (Short-term New Lows indicator > 62), then waits for that indicator to retreat (short-term selling pressure eases), but on the same day, the underlying price hits a new 100-day (medium-term) low. This divergence between improving short-term internal structure and a new low in medium-term price often implies that the final flush has been completed.
Signal Criteria
- Condition 1 = Short-term Market Breadth Indicator was previously in a high-stress zone (> 62).
- Condition 2 = Short-term Market Breadth Indicator falls back to the observation zone (< 62).
- Condition 3 = S&P 500 closes at a 100-day low.
- If Conditions 1-3 are met, a 21-Day Low Divergence signal is issued.
Current Day Chart
Signal Performance
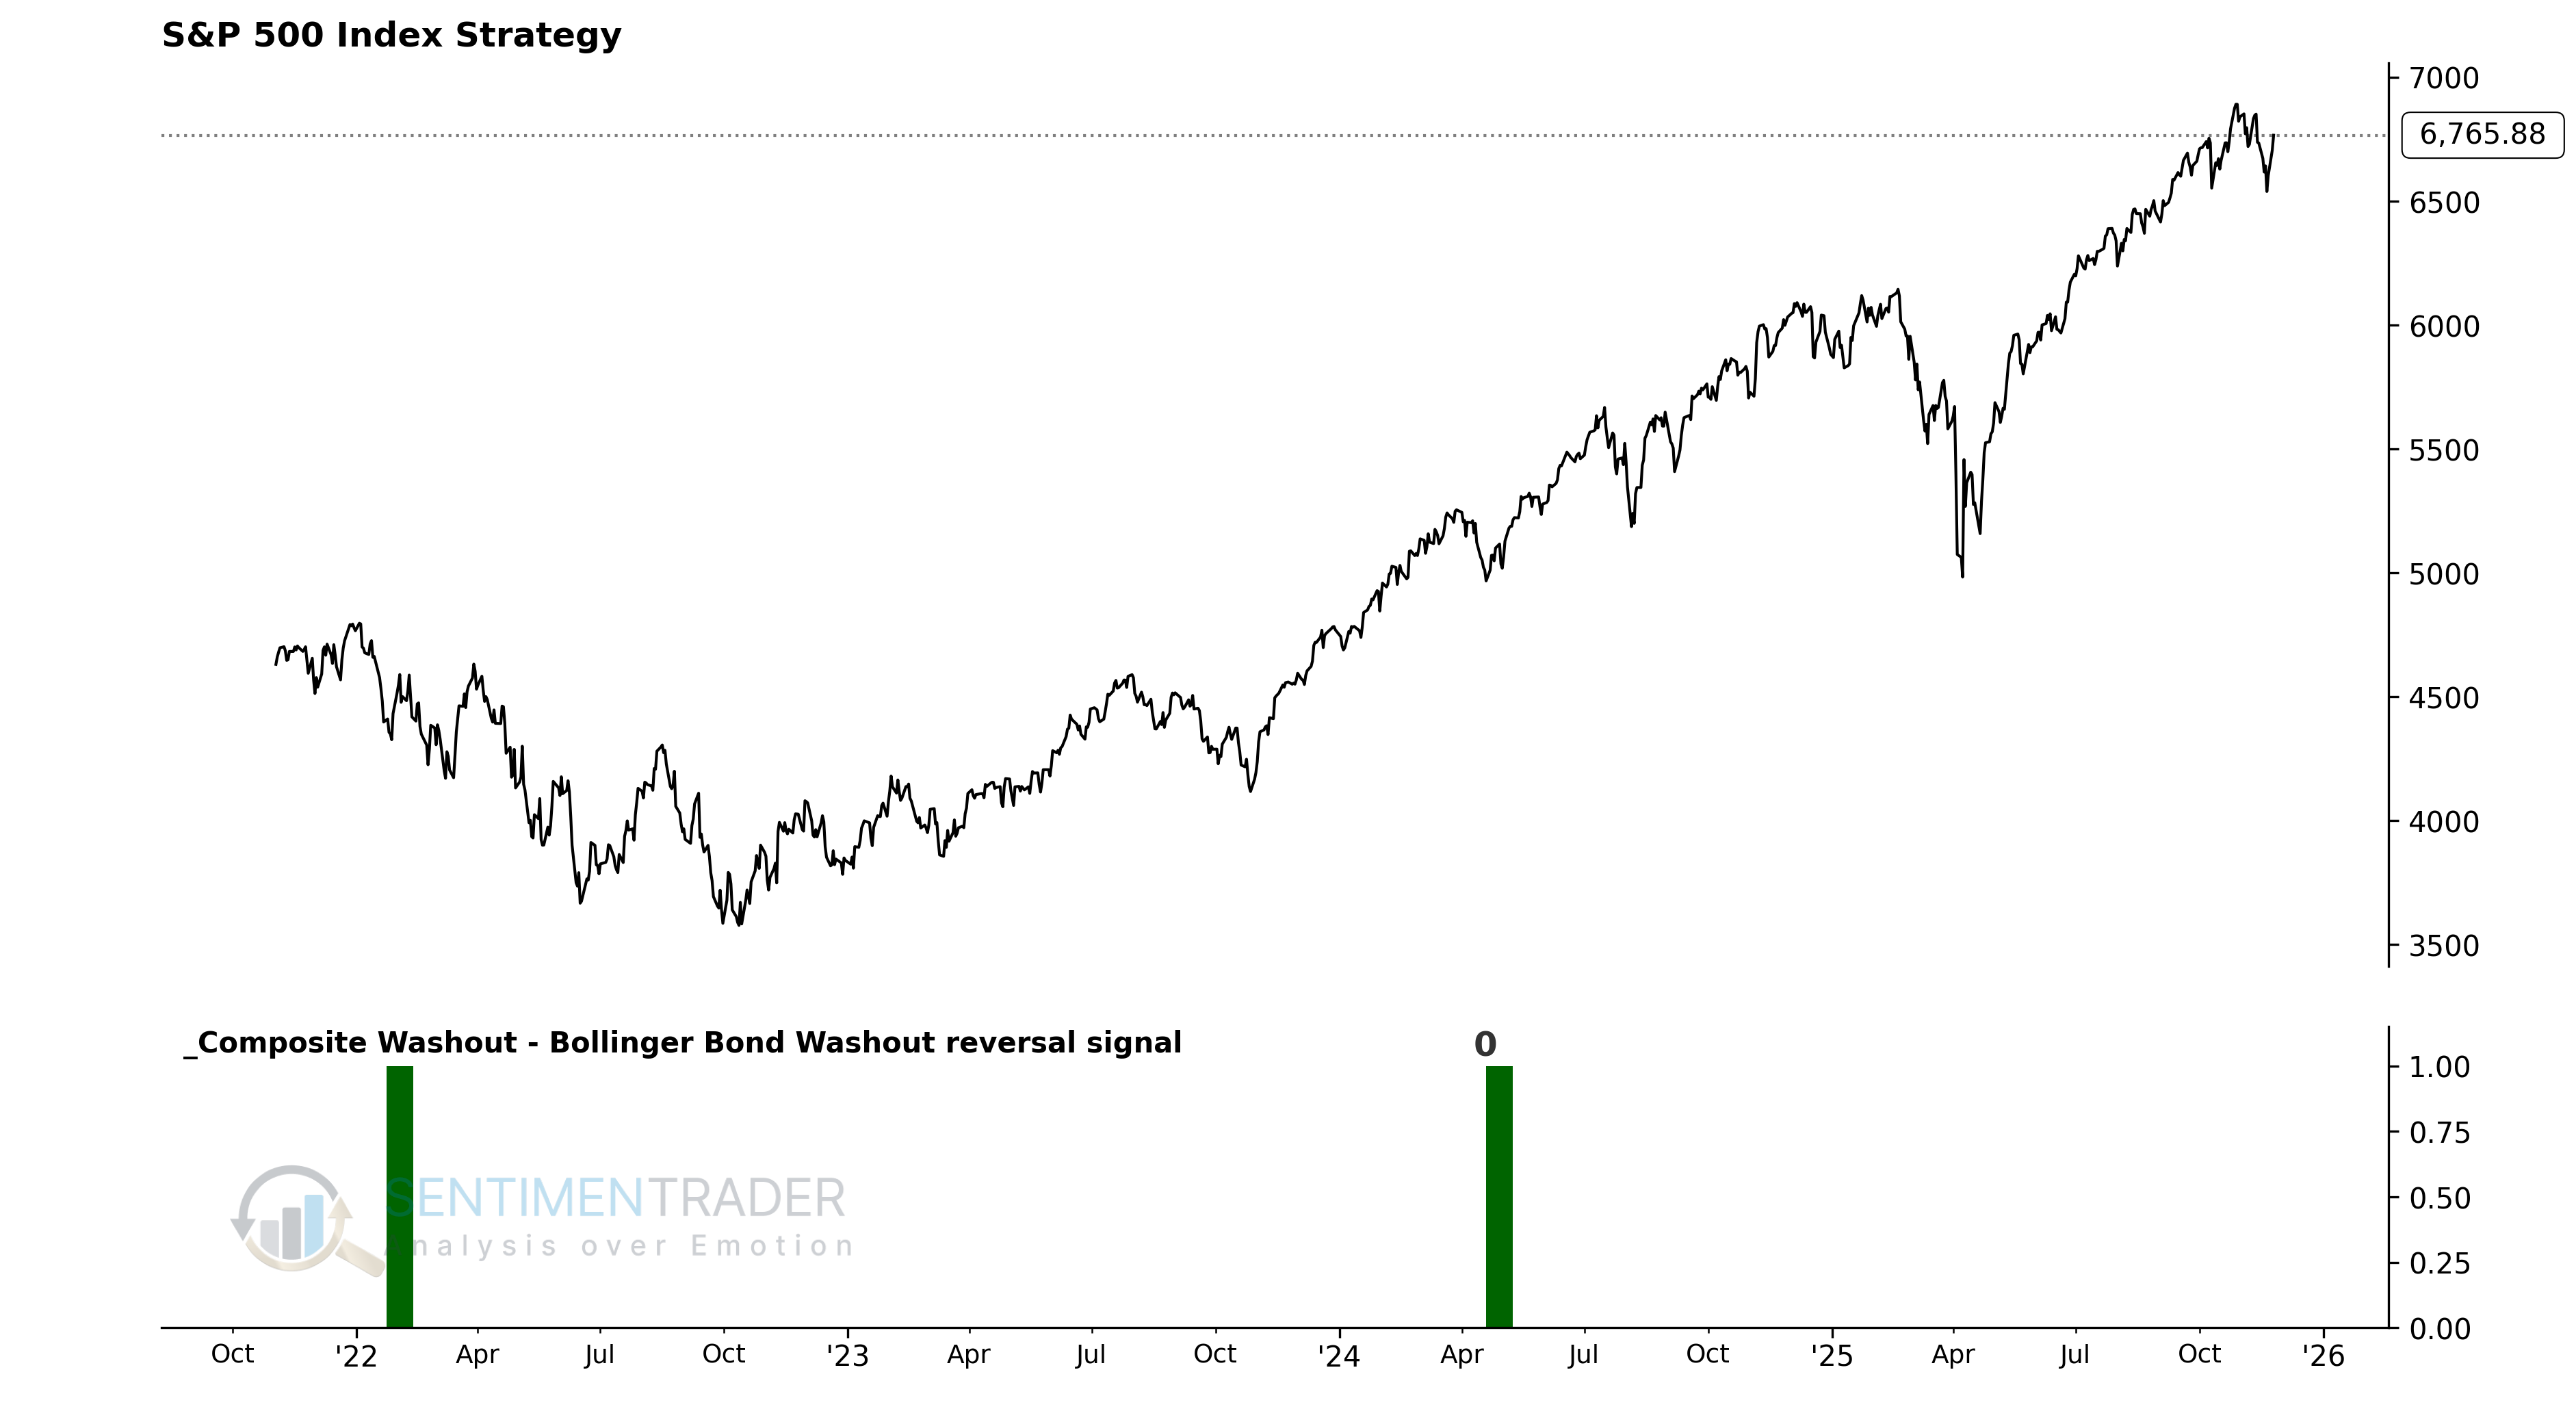
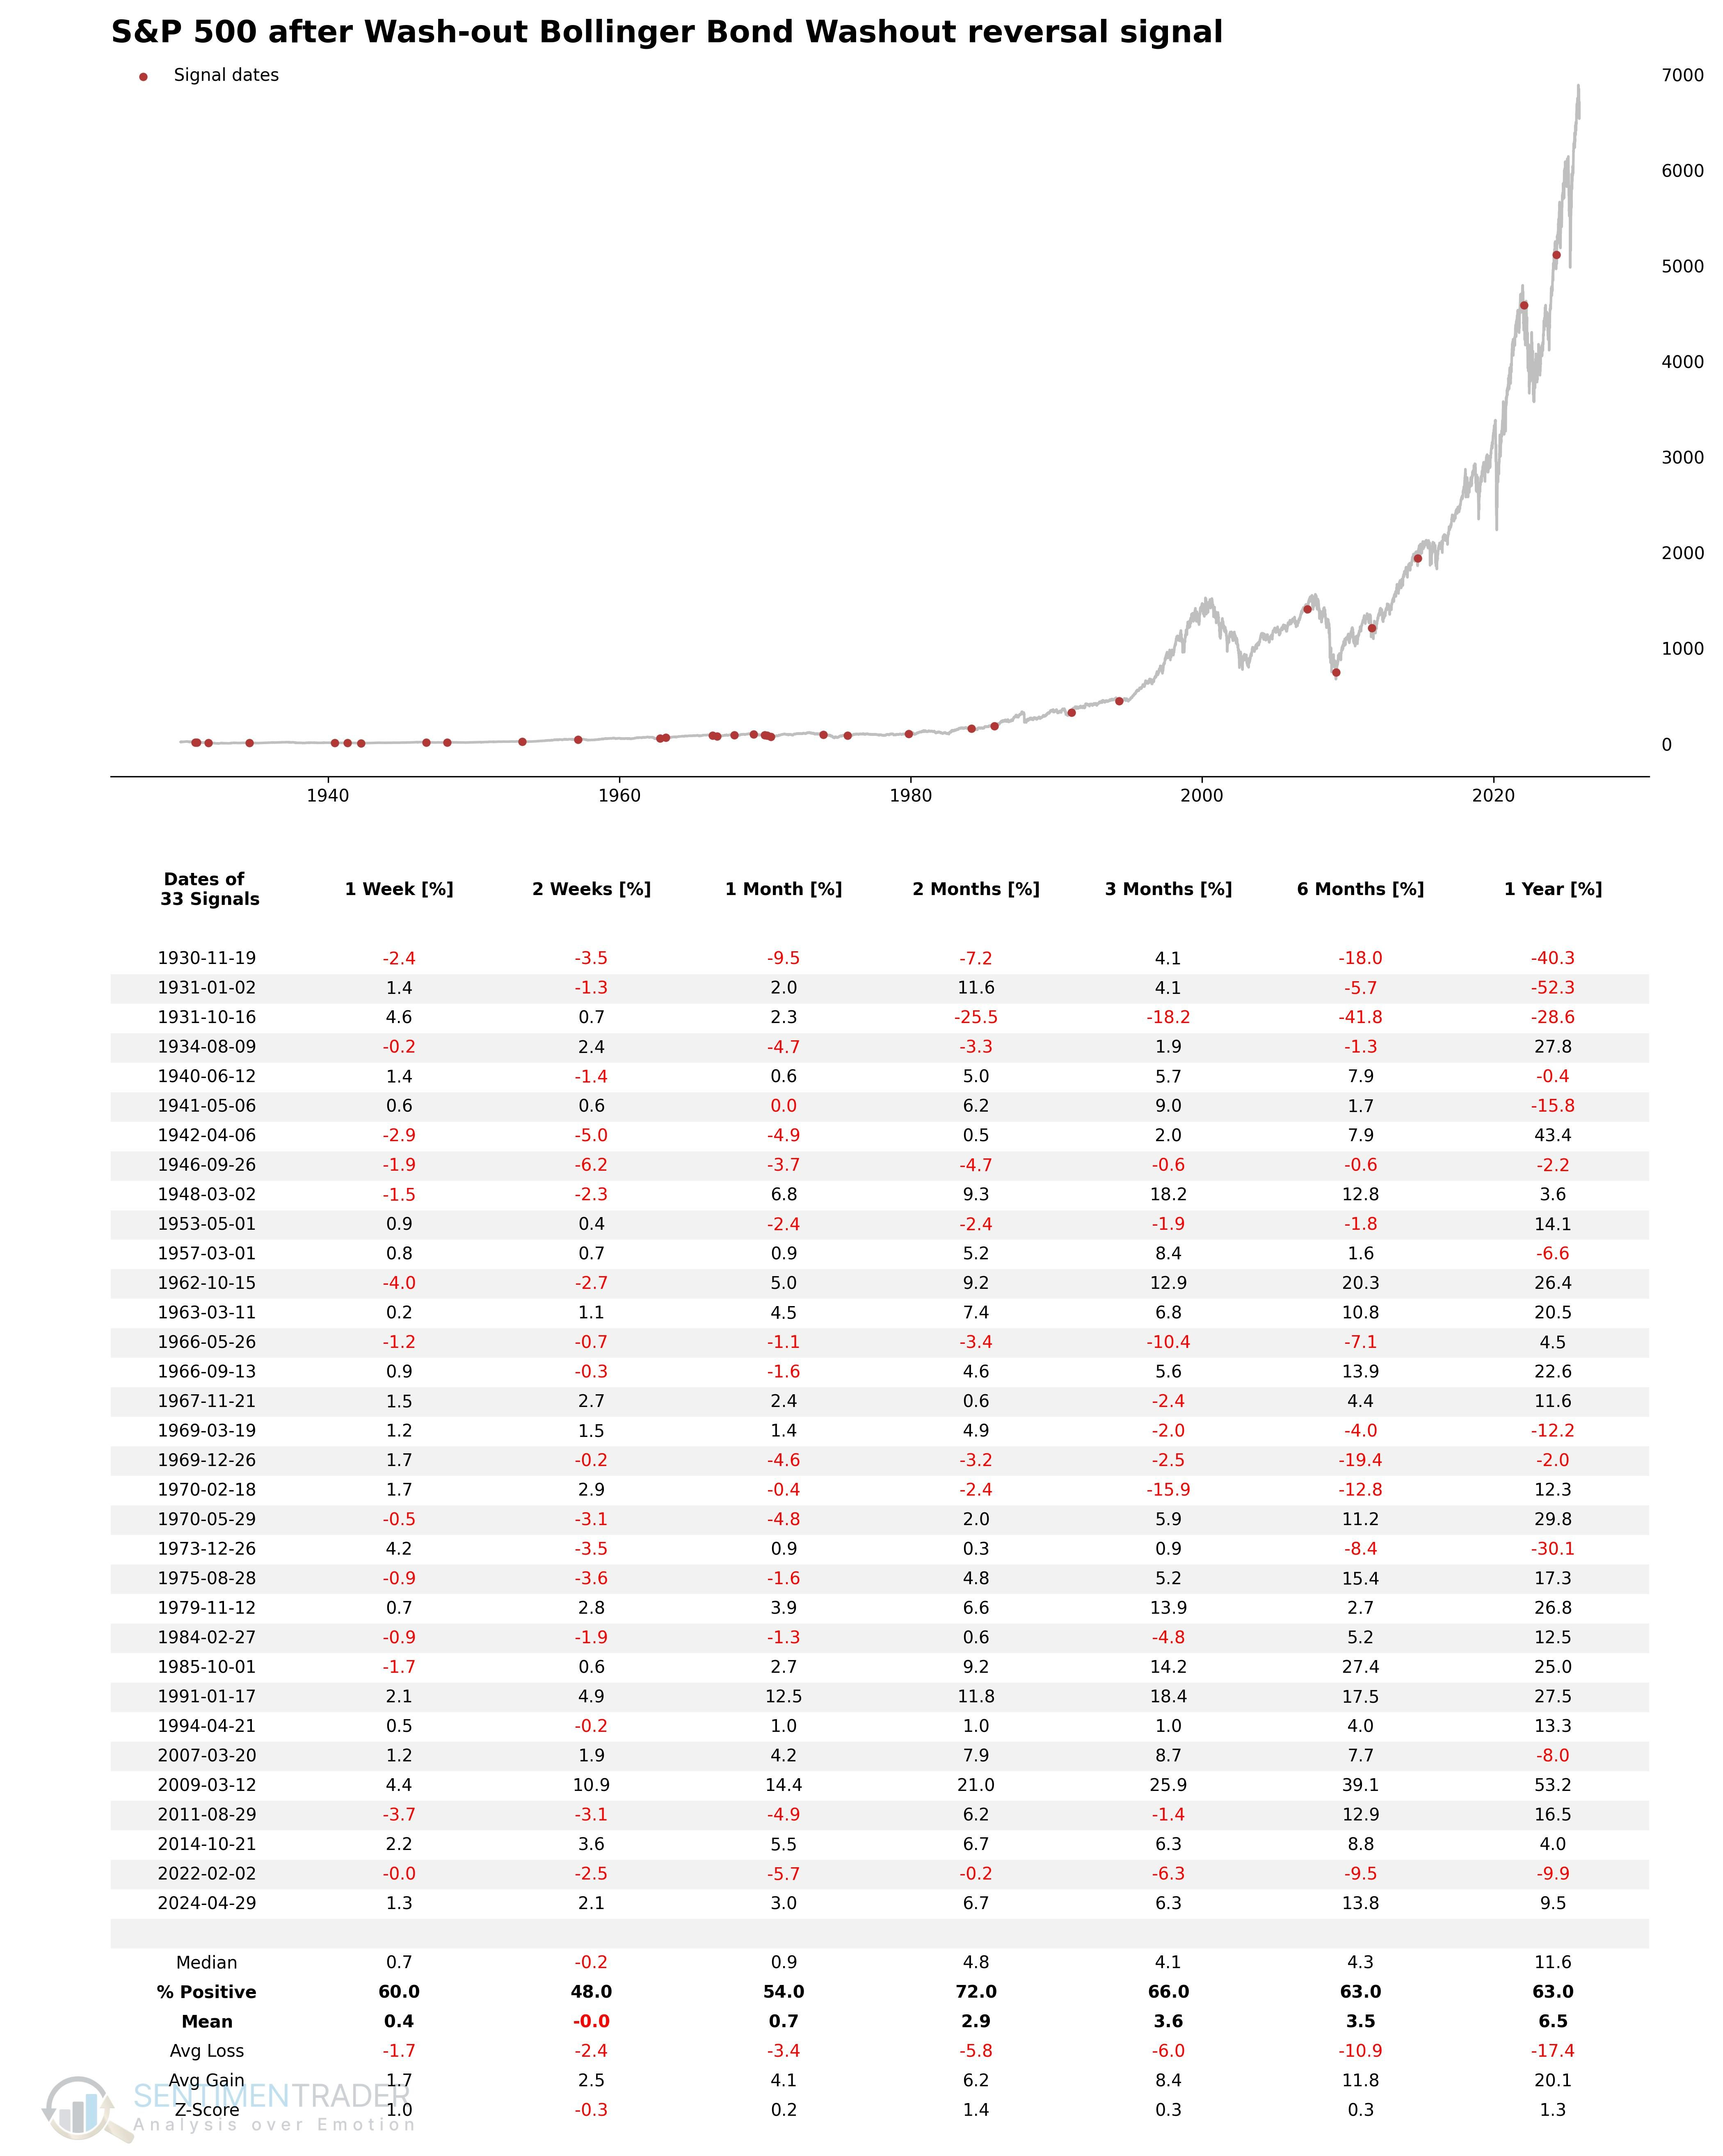
Bollinger Band Washout Reversal
The Bollinger Band Washout Reversal indicator utilizes Bollinger Bands to identify a "washout" phase where price is in an extreme weak state. It specifically looks for assets that close below the lower Bollinger Band for multiple consecutive days, representing extreme selling pressure. The strategy then enters a waiting mode until the price reclaims the moving average, confirming a return to trend.
Components
- 20-day Bollinger Bands (2 Std Dev).
- Bollinger Bandwidth.
- Closing price relative to the 20-day Moving Average.
Bollinger Band Washout Reversal Model
This model aims to capture the moment when "the rubber band snaps back after being stretched to the limit." The model first looks for an extreme market state: price not just touching the lower band, but closing below the lower Bollinger Band for 5 consecutive trading sessions (which typically represents extreme panic or a crash). Simultaneously, the model includes a volatility filter (Bandwidth < 0.25) to ensure volatility is within a specific range. Once this "washout" state is confirmed, the system enters an "observation period" of up to 63 days (about a quarter). During this time, as long as the price can reclaim the 20-day moving average (the middle band), a buy signal is issued.
Signal Criteria
- Condition 1 = Price closes below the lower Bollinger Band for 5 consecutive trading sessions.
- Condition 2 = Bollinger Bandwidth ((Upper Band - Lower Band) / Close) is less than 0.25.
- Condition 3 = Closing price crosses above the 20-day moving average (Bollinger Band middle line).
- If Conditions 1-3 are met, a Bollinger Band Washout Reversal signal is issued.
Current Day Chart
Signal Performance
As seen, there is positive performance in the medium-to-long-term timeframes, especially at 2 months.
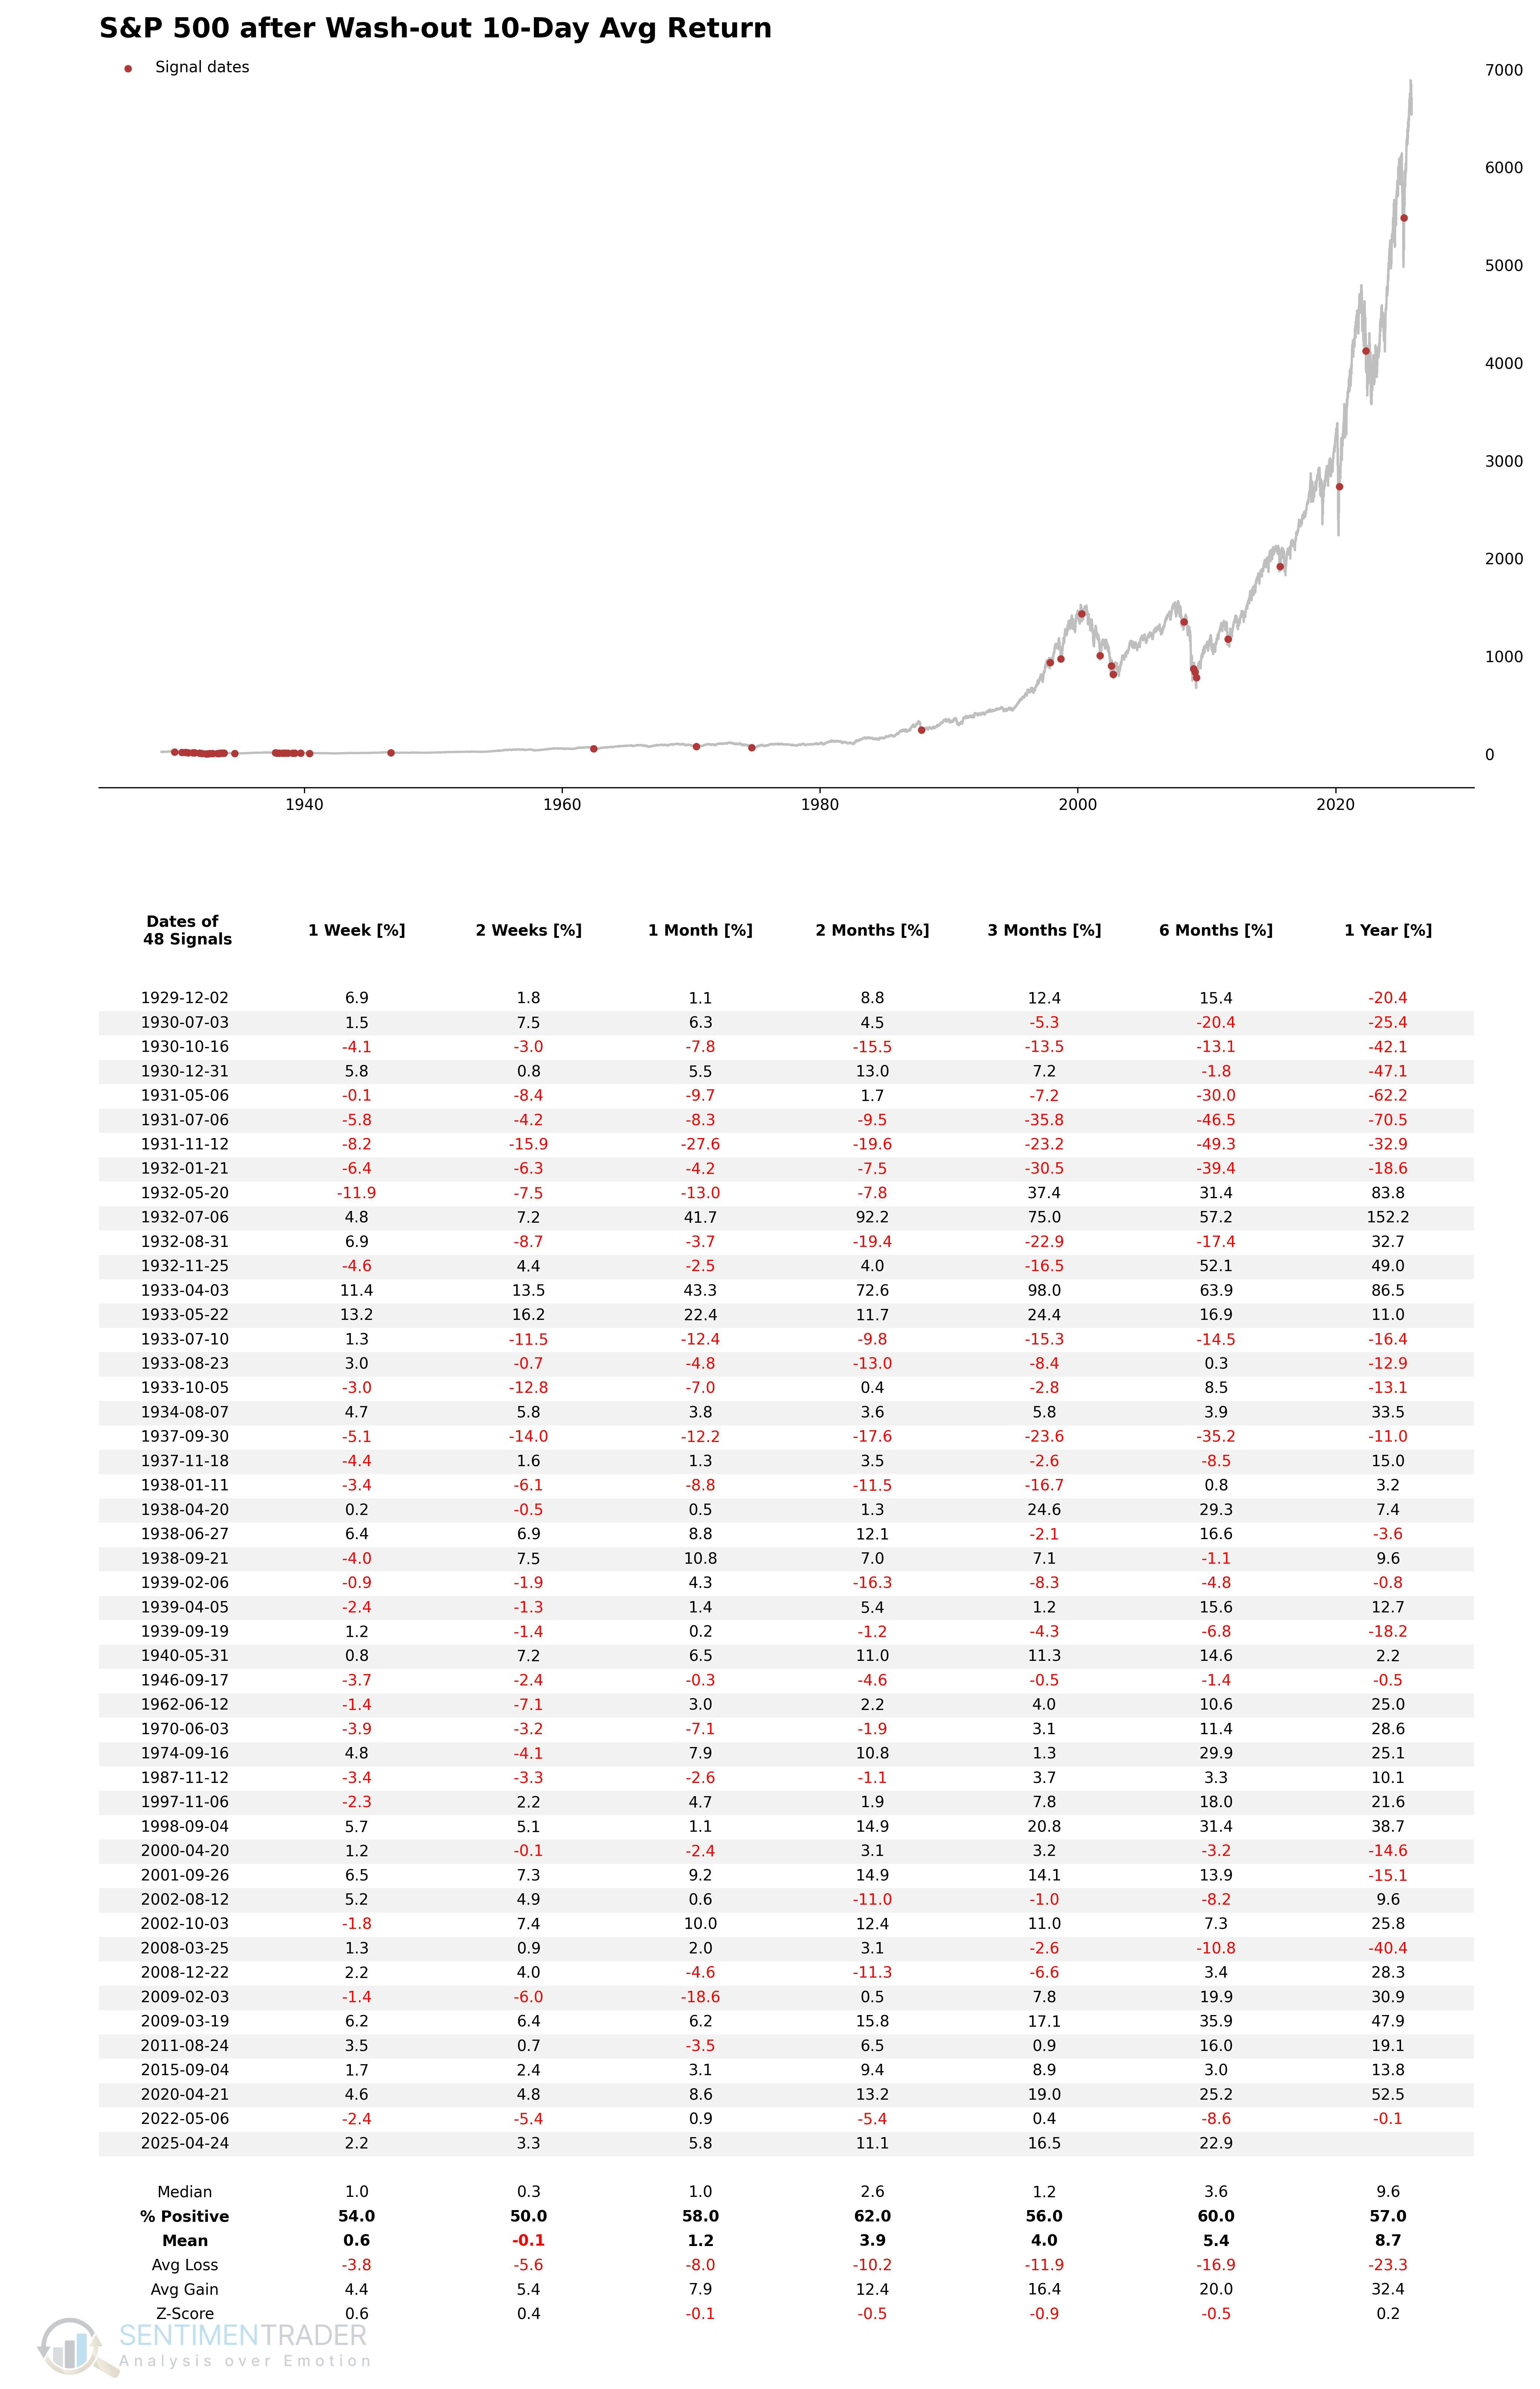
The 10-Day Avg Return (Volatility Stabilization) indicator utilizes the magnitude (absolute value) of daily price fluctuations to identify when an extremely volatile market environment begins to cool down. It marks the transition from a high-volatility (panic) phase to a normalized volatility (stabilization) phase.
Components
- Absolute Daily % Change of the closing price.
- 10-day rolling average of the above absolute values.
Volatility Washout/Stabilization Model
This model aims to identify the "fever breaking" moment after peak market panic. The model measures volatility by calculating the average absolute daily percentage change over the past 10 days. When this average exceeds 2%, it means the market is in an extremely unstable "giant swing" mode (averaging more than 2% fluctuation per day). When this indicator falls from above 2% to below 2%, it indicates that extreme irrational volatility is subsiding and the market is finding a new equilibrium, which is often a confirmation signal of a panic bottom.
Signal Criteria
- Condition 1 = Yesterday's 10-Day Average Absolute Return was greater than 2% (High Volatility State).
- Condition 2 = Today's 10-Day Average Absolute Return falls below 2% (Volatility Normalization).
- If Conditions 1-2 are met (a cross below the 2% threshold), a Volatility Stabilization signal is issued.
Current Day Chart
Signal Performance
Excluding the early part of the last century, this signal has had a positive win rate over the last fifty years.
What the research tells us...
The S-TCTM Composite Washout Model is a comprehensive, 'weight-of-the-evidence' system designed to detect major market lows by identifying extreme conditions of panic and capitulation. In Part II of this deep dive, we have explored components that focus on oversold breadth extremes, bullish divergences, and the critical transition from high to normalized volatility.
Each component tells a part of the "bottoming" story: the Oversold Extreme alerts us to panic; the Divergence models tell us when selling pressure is losing its grip even as prices fall; and the Volatility Stabilization model confirms when the storm has passed. By combining these diverse signals, the Composite Washout Model aims to filter out false positives and provide a robust, objective signal for when the risk/reward profile has shifted decisively in favor of the bulls.