
A In-Depth Look at the Sentimentrader's New TCTM Composite Combined Thrust and Confirmation Model

Key points
- S-TCTM Composite Combined Thrust and Confirmation Model intelligently reconstructs the signal pool by selecting 10 core components optimized for win rate, expected return, and signal frequency.
- By aggregating the most effective thrust (momentum) and confirmation (breadth/macro) signals, this composite model aims to identify high-conviction market turning points.
- Historical performance shows that when the combined signal count exceeds 30%, the market exhibits a strong bullish bias with steady long-term gains.
The Composite Combined Thrust and Confirmation Model Components
Identifying the primary market trend is one of the most critical tasks for any trader or investor. The Tactical Composite Trend Model (TCTM) is the culmination of decades of professional trading and financial market research, designed to aid in this process. The TCTM utilizes a weight-of-the-evidence approach, combining seven key time-tested components to identify major market turning points. This report will focus on one of those key components: the Sentimentrader's New TCTM (S-TCTM) Composite Combined Thrust and Confirmation Model.
The following analysis utilizes a Composite Combined Thrust and Confirmation Model that includes ten measures for identifying extreme momentum through internal and external participation.
The Composite Combined Thrust and Confirmation Model represents an intelligent reconstruction of the existing pool of thrust and confirmation signals. We utilized artificial intelligence algorithms to weigh and optimize across multiple dimensions-win rate, expected return, and signal trigger frequency. Ultimately, we selected ten core sub-signals to construct this new analytical system.
(For detailed introductions to the foundational models, please refer to the background materials on The Composite Thrust Model and The Composite Confirmation Model: [1][2][3][4].)
Component Descriptions
- ISM Liquidity Signals
- 2 Day Vol Ratio
- Rate of change Thrust
- Percent of issues Overbought Spike
- Moving Average Bearish to Bullish Reversal Streak
- Percent of issues above 10-Day Reversal
- OECD LEI Signal
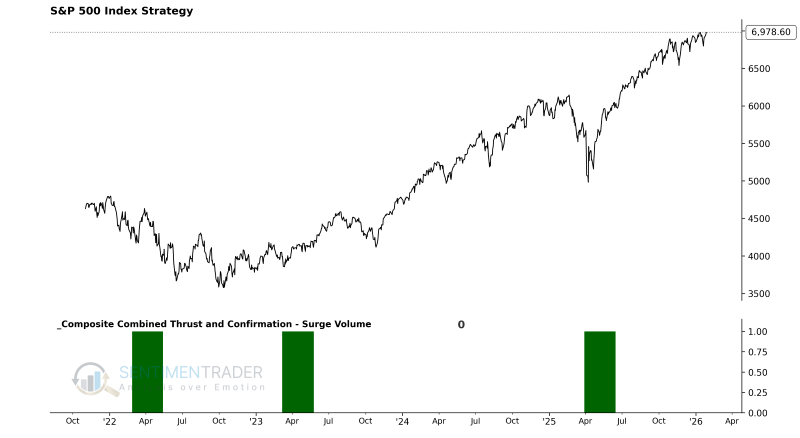
- Surge Volume
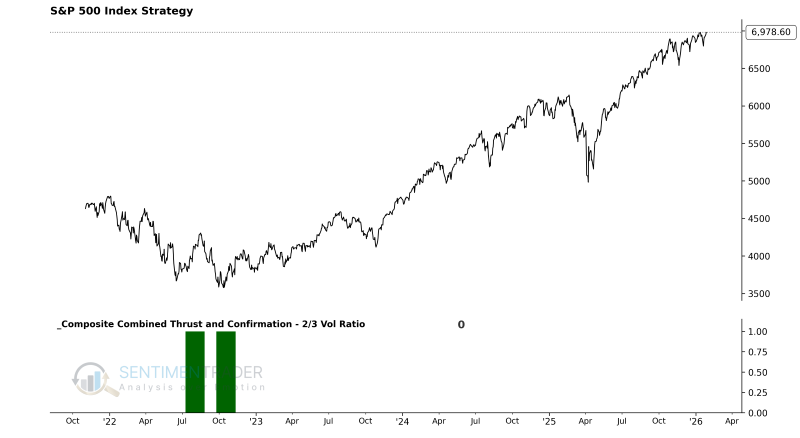
- 2/3 Vol Ratio
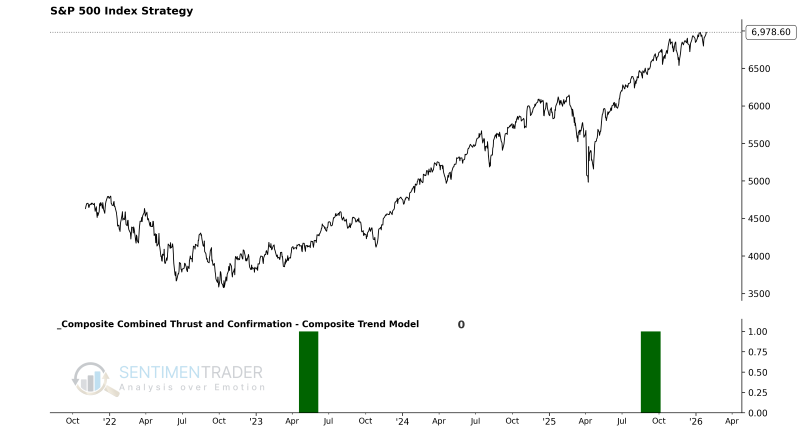
- Composite Trend Model
Composite Combined Thrust and Confirmation Model Signal Criteria
- Condition = Composite Signal Count >= 30%.
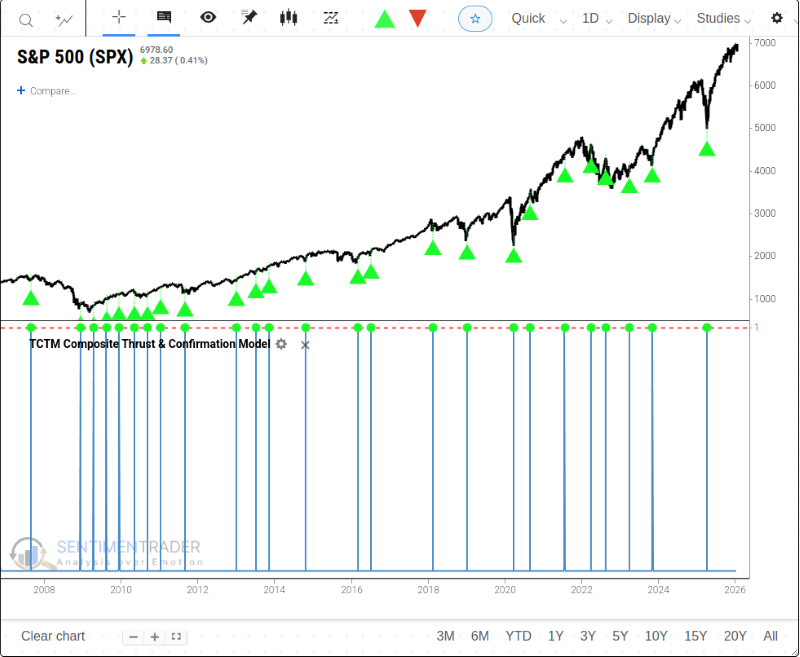
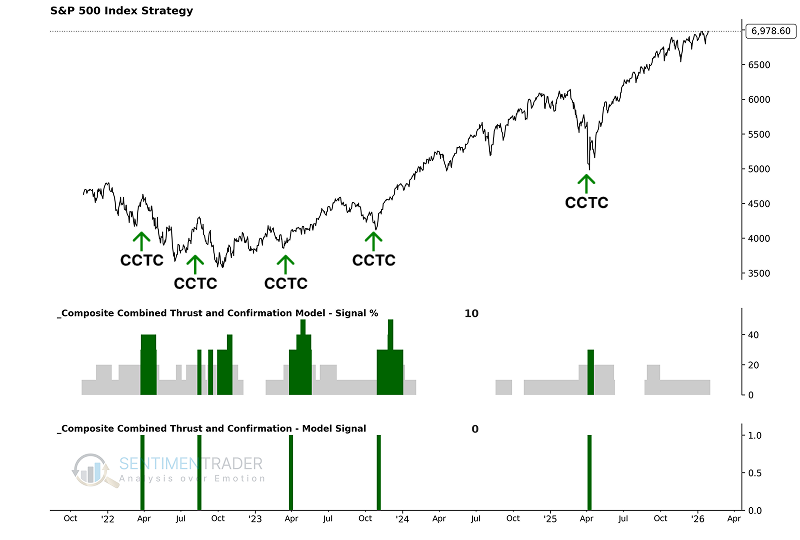
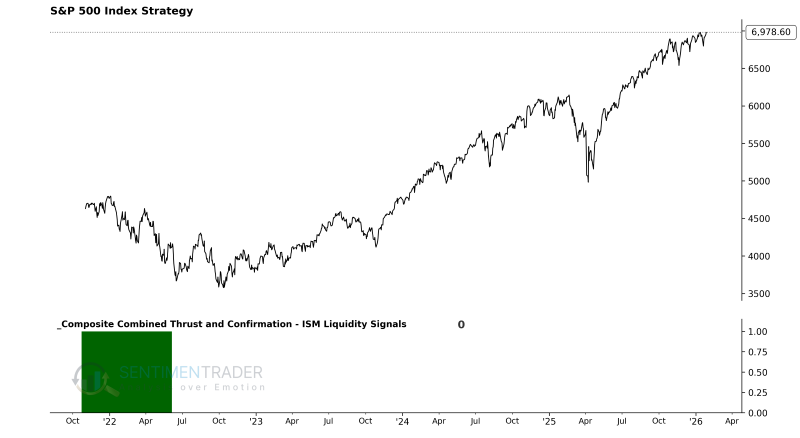
As the chart below illustrates, these individual components are combined into a single composite indicator-the Composite Combined Thrust and Confirmation Model-which uses a 0 or 1 value to issue alerts. Currently, the model shows a reading of 0, indicating no combined signal is active.
Utilizing the S-TCTM Composite Combined Model
The model's output allows us to define the market environment as "Favorable" or "Unfavorable" without subjective interpretation. Specifically:
- When the Composite Combined Thrust and Confirmation Model flips from 0 to 1, the primary trend is considered Favorable for stocks.
With this framework, we can construct a systematic trend-following strategy to see how this approach has performed historically.
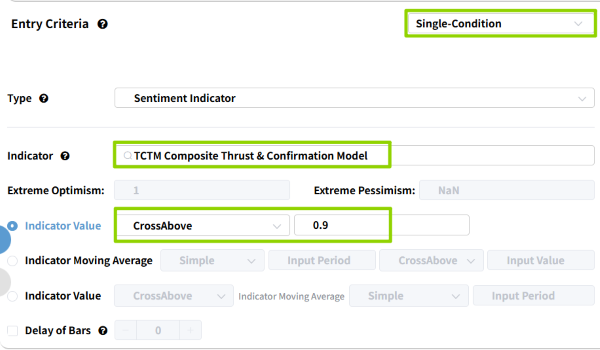
Using the Backtest Edge engine, we can set up the entry and exit criteria to follow the model's signals. The setup is straightforward:
The Entry Criteria are set for when the S-TCTM Composite Combined Thrust and Confirmation Model equals 1, initiating a long position when the trend becomes favorable.
We can skip setting an explicit exit for this test, as we are primarily interested in the forward returns after the signal triggers.
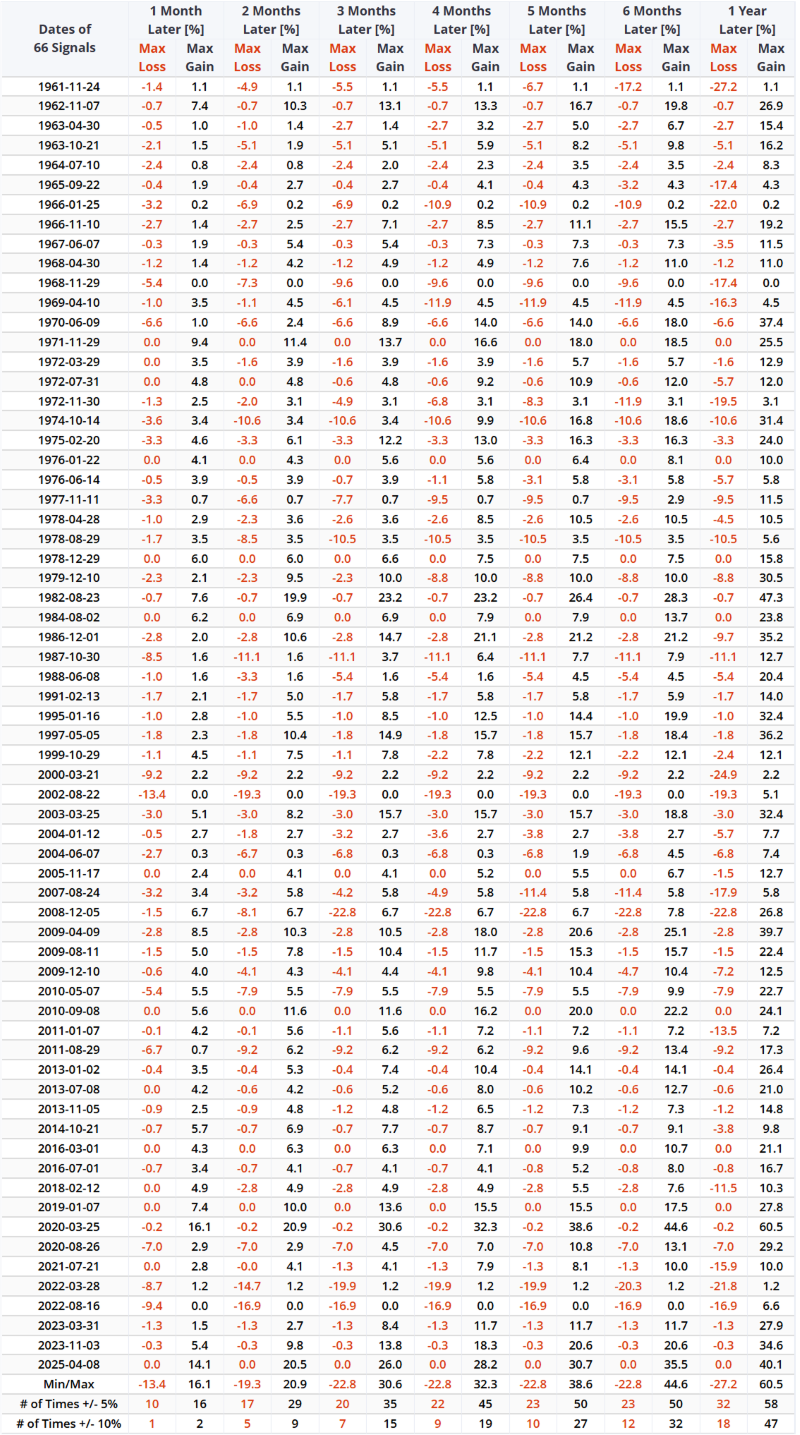
As shown in the table below, this signal demonstrates a significant long-term bullish advantage. Across all observation periods (from 1 month to 1 year), it has maintained a high win rate (generally exceeding 70%) and steadily increasing average returns. For related backtest, click here.
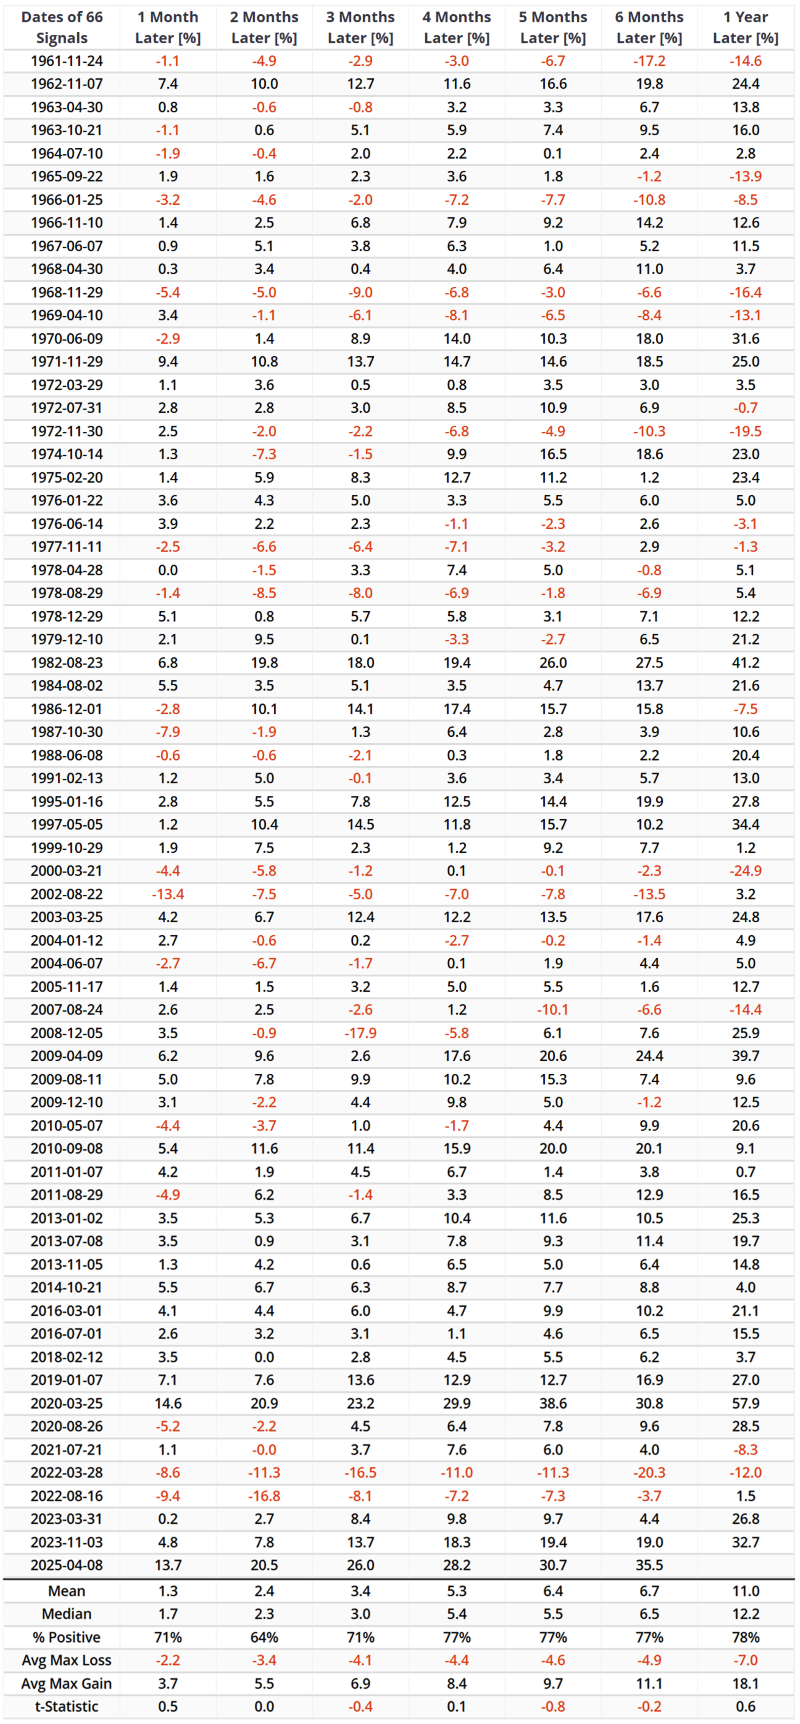
Historically, within one year of the signal triggering, the probability and magnitude of the market achieving significant gains (Max Gain) have been far higher than the risk of encountering equivalent losses.
Current Day Chart Updates
Since the concepts and performance of the sub-models have been detailed in previous reports ([1][2][3][4]), we will not repeat them here. Instead, we present the updated charts for each component.
ISM Liquidity Signals
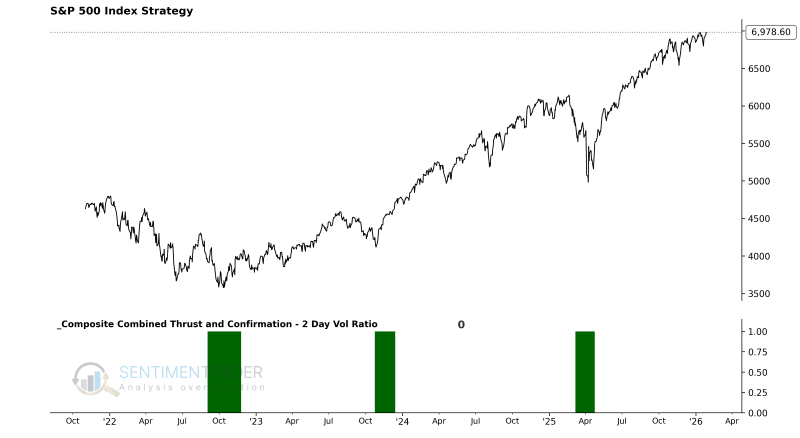
2 Day Vol Ratio
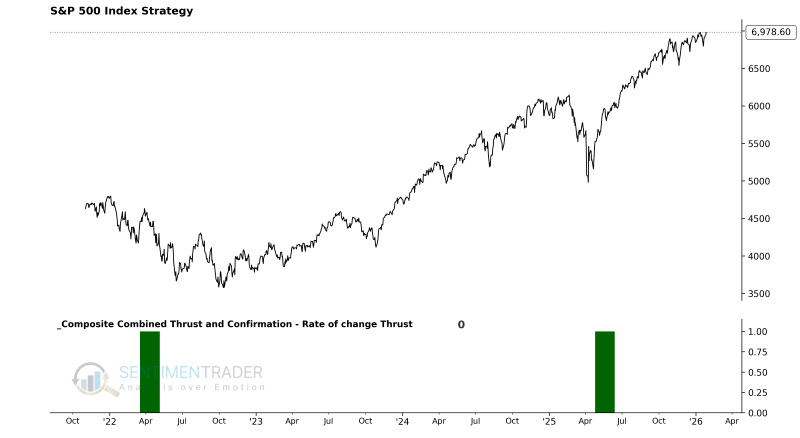
Rate of change Thrust
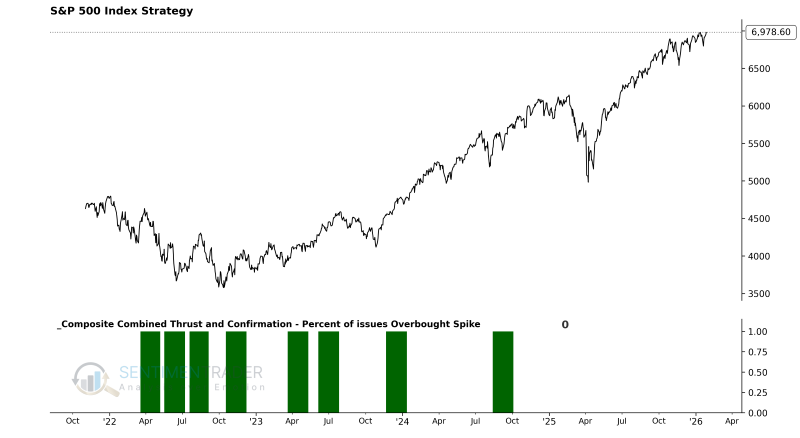
Percent of issues Overbought Spike
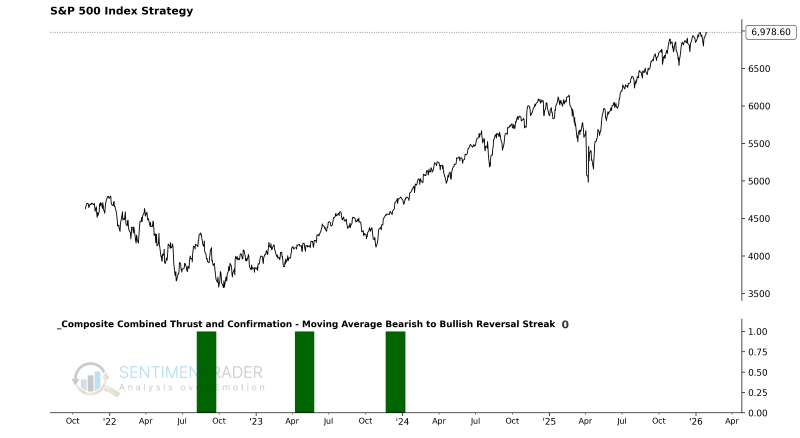
Moving Average Bearish to Bullish Reversal Streak
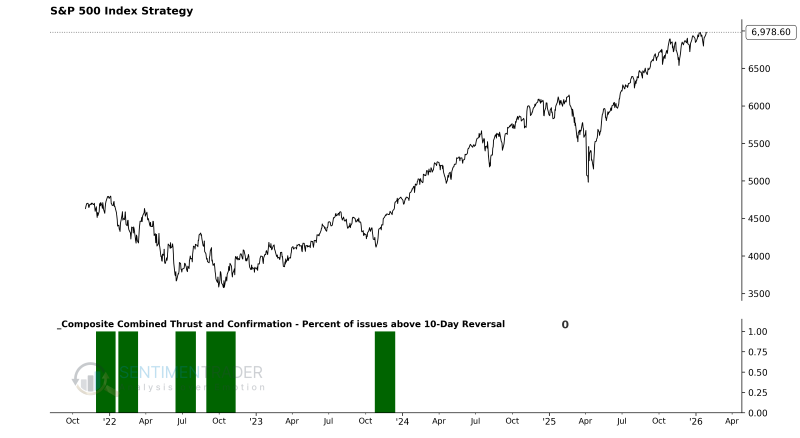
Percent of issues above 10-Day Reversal
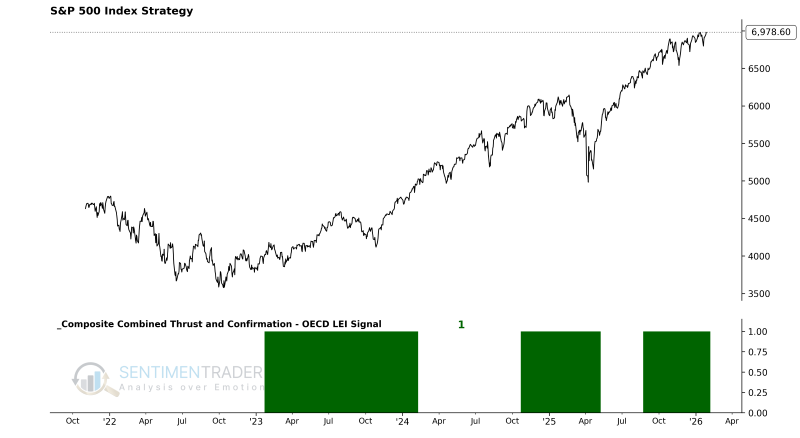
OECD LEI Signal
Surge Volume
2/3 Vol Ratio
Composite Trend Model
What the research tells us...
The S-TCTM Composite Combined Thrust and Confirmation Model represents the synthesis of our research into market momentum. By intelligently selecting the top 10 signals from our library-ranging from macro liquidity and trend reversals to volume surges and breadth thrusts-this model creates a "Super Composite" that filters out noise and focuses on high-quality signals.
The result is a robust indicator that has historically provided traders with a significant edge. When this model triggers (score >= 30%), it confirms that the market is supported by both explosive momentum (Thrust) and broad structural strength (Confirmation), creating a highly favorable environment for long-term capital appreciation.