
A In-Depth Look at the Sentiment Cycle Composite

Key points
- Historically, investor sentiment has tended to be correct in the middle, and wrong at the extremes
- We have identified four components of investor sentiment - panic, discouragement, enthusiasm, and returning confidence
- Our Sentiment Cycle Composite indicator combines all four components and serves as a practical trend-following guide of overall investor sentiment
The Sentiment Cycle Components
Investor sentiment can be complex and cyclical, so we developed the Sentiment Cycle Composite to simplify the analysis of emotional shifts in the market. This new indicator combines four key phases of the sentiment cycle-Panic, Discouragement, Enthusiasm, and Returning Confidence-into a single measure, offering a concise view of market behavior at any given time. Balancing optimism and pessimism helps investors better understand the current emotional state of the market and its historical context.
Panic: Extreme pessimism, oversold breadth, risky stocks crash, negative media coverage, and credit slams shut.
Discouragement: Stocks go nowhere, trend-followers suffer, there are some pockets of outperformance, credit starts to thaw, and activity slows.
Enthusiasm: High optimism, easy credit, rush of offerings, risky stocks outperforming, stretched valuations.
Returning Confidence: Stocks rise choppily, smaller stocks do well, credit becomes easy, and there are more new offerings.
Let's look at how these components typically react to market activity.
Panic and Discouragement
As the stock market declines, sentiment invariably heads south. The only question is usually, "to what degree?" Typically, the larger the decline, the more prolonged the decline, the worse sentiment becomes as the "Fear" portion of fear and greed takes hold.
The usual cycle involves a) lower stock prices, followed by a b) spike in panic, and then c) an increase in investor discouragement as investors realize (real or imagined)that they've lost a meaningful amount of money and may be in danger of losing more.
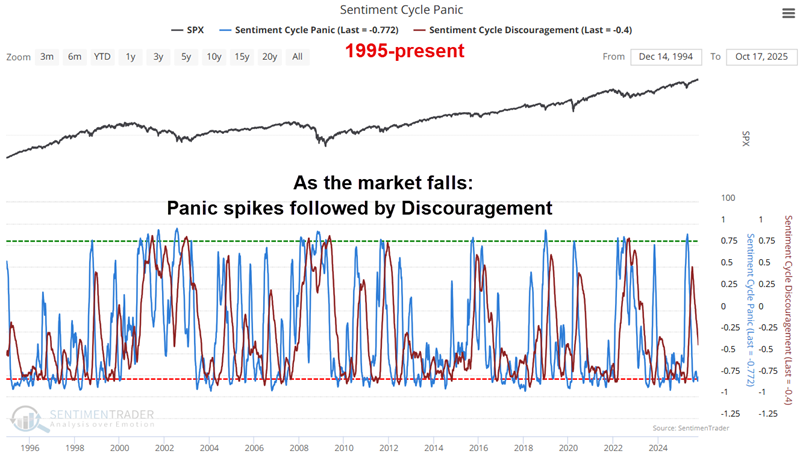
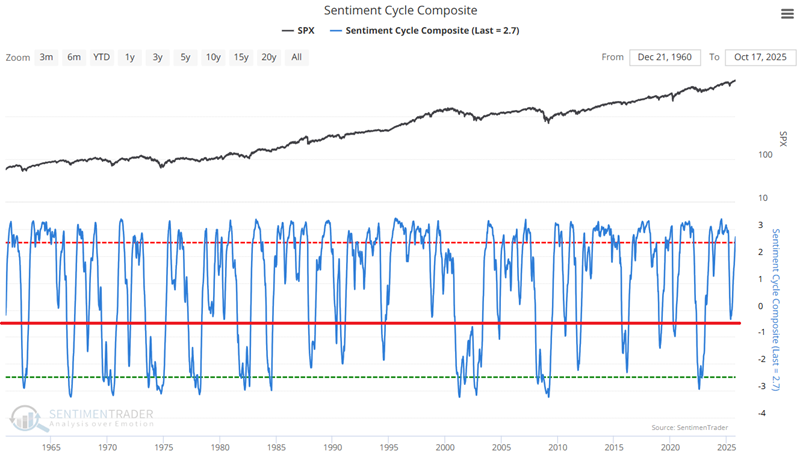
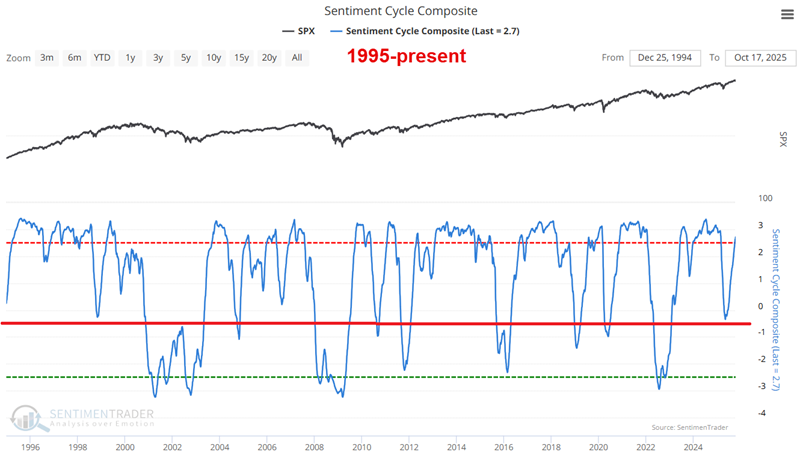
This cycle of a spike in panic, followed shortly thereafter by discouragement, is illustrated in the charts below. The first starts in 1960, while the second zeroes in on 1995 to the present.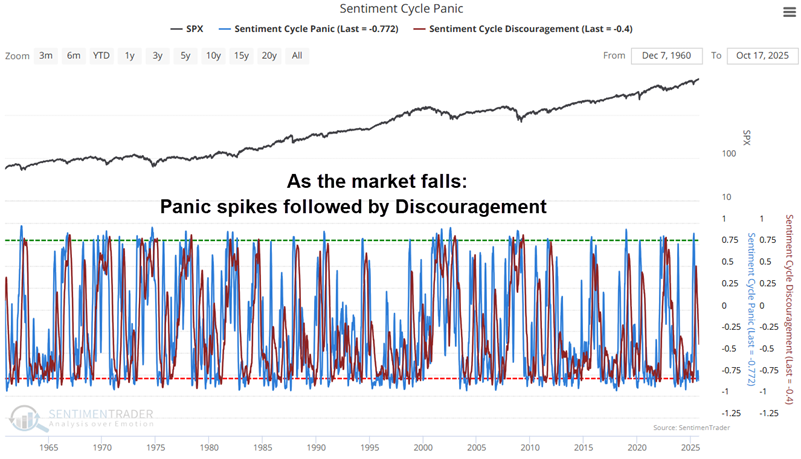
Once the stock market reverses higher - and the further a rally goes - the more panic and discouragement decline.
Enthusiasm and Returning Confidence
As the stock market starts to rally after a decline, sentiment starts to pop. Enthusiasm picks up as investors begin to hope for better days ahead. Eventually, if the rally sticks, an overall sense of confidence returns.
The usual cycle involves a) higher stock prices, followed by b) a sharp pickup in enthusiasm and panic, and then c) an increase in investor confidence as investors start seeing larger balances in their investment and trading accounts.
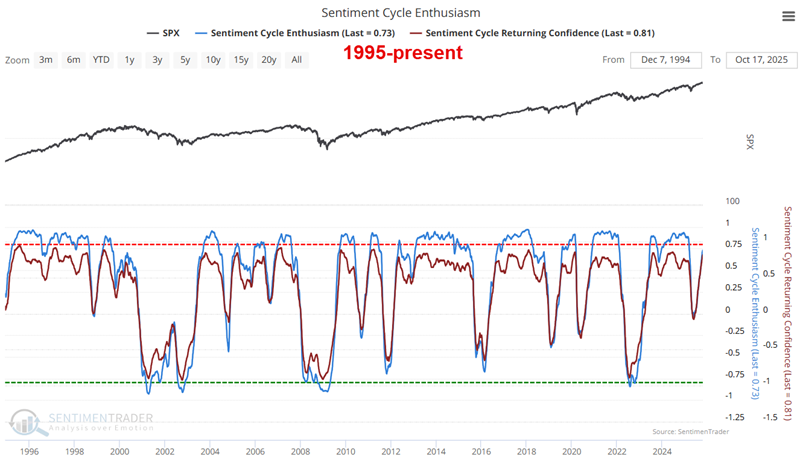
The charts below illustrate this cycle of an increase in enthusiasm followed shortly thereafter by returning confidence. The first starts in 1960, while the second zeroes in 1995 to the present.
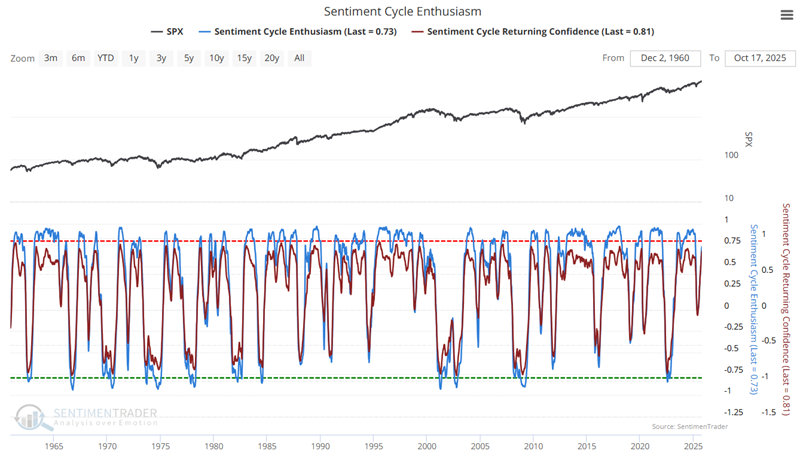
Once the stock market reverses lower - and the further a decline goes - the more enthusiasm and returning confidence decline.
Building the Sentiment Cycle Composite
As the name implies, our Sentiment Cycle Composite indicator combines the current readings for all four cycle components highlighted above.
The basic formula is simple:
A = Enthusiasm + Returning Confidence
B = Panic + Discouragement
C = (A - B)
The more the market rallies, the higher enthusiasm and returning confidence increase, and the lower panic and discouragement decline. Thus, the Sentiment Cycle Composite typically increases as the market rallies.
The more the market declines, the higher panic and discouragement increase, and the lower enthusiasm and returning confidence decline. Thus, the Sentiment Cycle Composite typically decreases as the market declines.
In essence, the Sentiment Cycle Composite follows investor sentiment trends. The chart below displays results from 1960, and the one after that zooms in from 1995 to the present.
Utilizing the Sentiment Cycle Composite in Real-World Trading
My own analysis of the Sentiment Cycle Composite indicator suggests that it be used as a trend-following tool and not as a typical sentiment gauge, where a "high" reading is an automatic warning of "froth" and a "low" reading is an automatic warning of "capitulation."
A close look at the indicator's history reveals that after a rally off a bear market low, it can reach a very high level very quickly. This is not bearish. Likewise, an extremely low reading for the indicator should not be considered an automatic "buy" signal for stocks, as market declines can sometimes take months to actually bottom out.
So high readings are typically bullish and low readings are generally bearish UNTIL they reverse and actually start to move in the opposite direction.
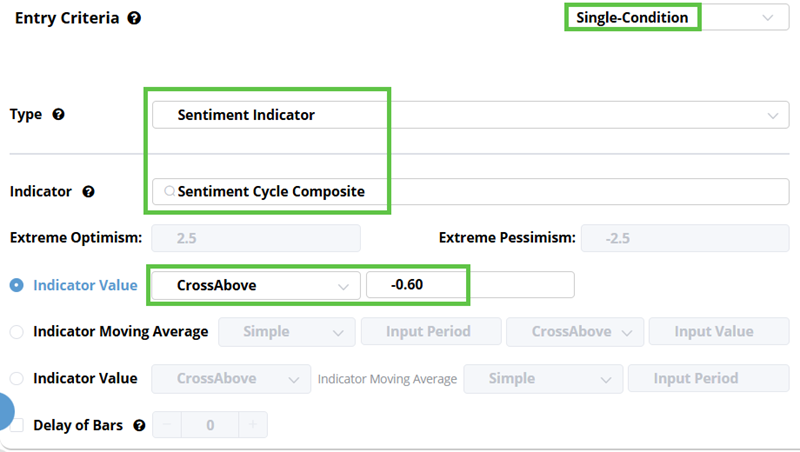
Based on my own analysis, and for my own purposes, I use a reading of -0.6 as a cutoff between the indicator being rated favorable or unfavorable for stocks. In other words:
- When the Sentiment Cycle Composite crosses above -0.60, I rate it as "Favorable" for stocks
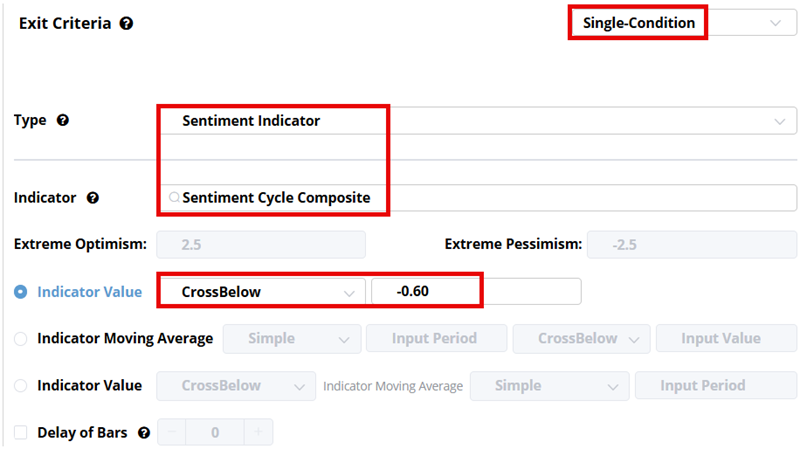
- When the Sentiment Cycle Composite crosses below -0.60, I rate it as "Unfavorable" for stocks
Please note that this approach is not intended to serve as an "All-in or All-out" standalone trading model. That said, an approach that states, "If the Sentiment Cycle Composite drops below -0.60, I will move to x% of cash in my investment account" is a viable consideration. The point is that no one should rely solely on this one indicator to fully form their market opinion or strategy. As illustrated in this month's webinar, sentiment is one of nine factors I look at.
With all that in mind, let's consider a way to systematize this approach to gauging investor sentiment.
Following the Sentiment Cycle Composite systematically
I have added the following test to Analyst Backtests in Backtest Edge (the test is titled "Sentiment Cycle Composite -0.6 cutoff"). In Setup, we set Entry and Exit criteria as illustrated below.
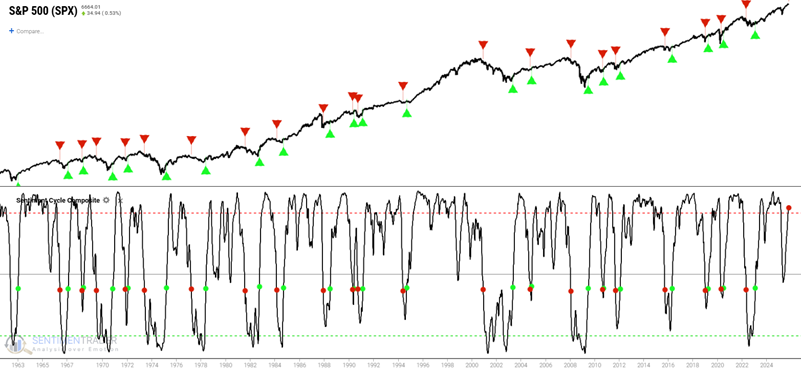
The chart below displays the signals versus the S&P 500 Index. The most recent signal was a buy signal on 2023-01-30. As this is written, the gauge stands at 2.72, so it continues to count as "favorable" for stocks (and will continue to do so until it drops below -0.60).
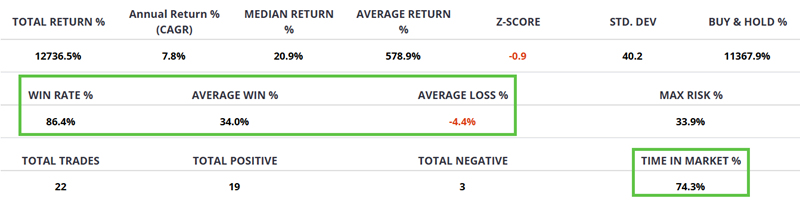
The table below summarizes S&P 500 performance during the favorable periods between buy and sell signals.
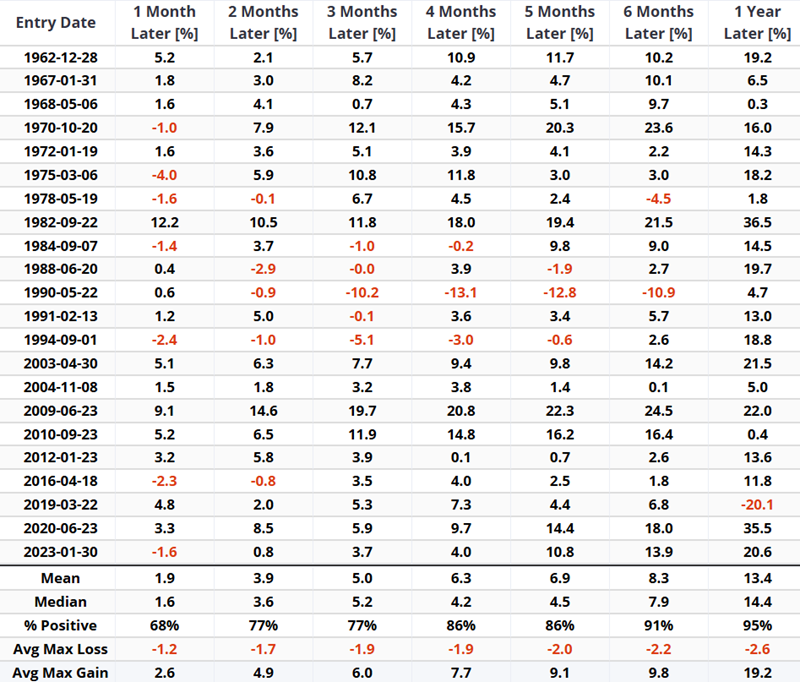
The table below displays S&P 500 performance over different timeframes following buy signals.
The blue line in the chart below is the hypothetical equity curve achieved by being in the S&P 500 only between buy and sell signals. The grey line represents buy-and-hold results. Note that occasionally, the blue line goes "flat" (following a sell signal) while the grey line declines sharply.
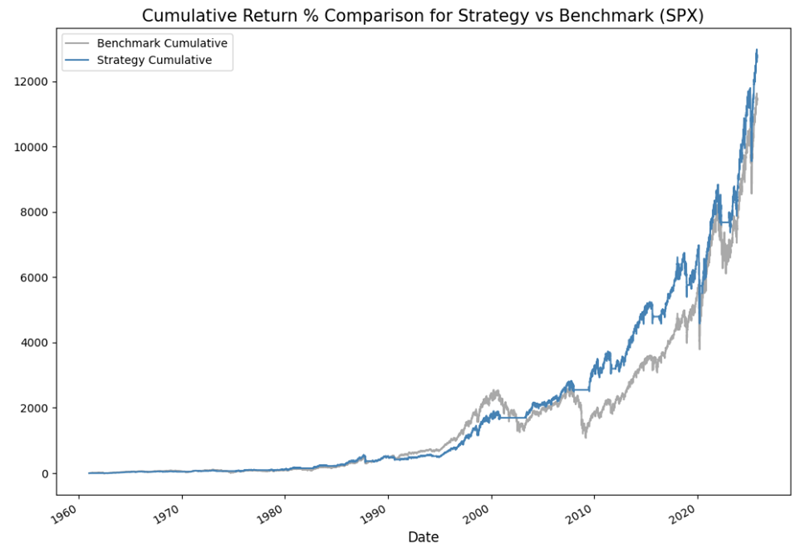
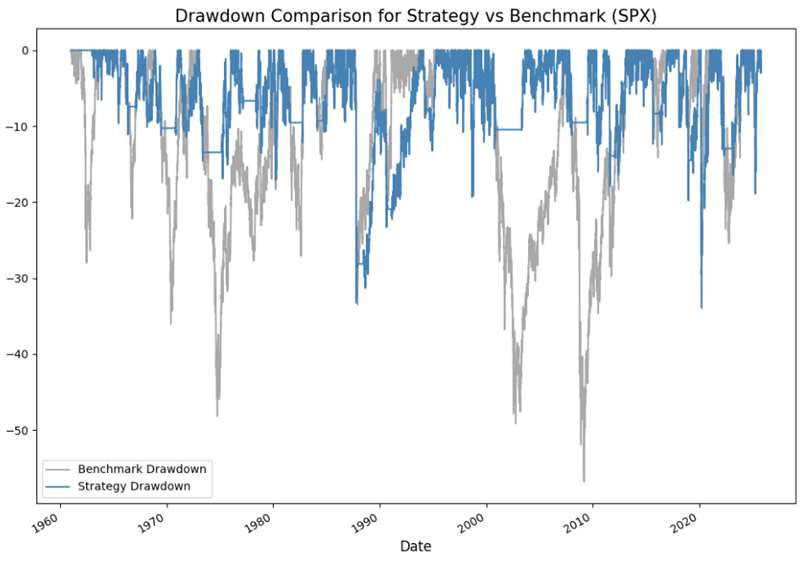
This is also illustrated in the chart below, which shows % drawdowns for both the strategy and buy-and-hold. Sometimes, buy-and-hold declines 20% to 50% or more, while the strategy is flat.
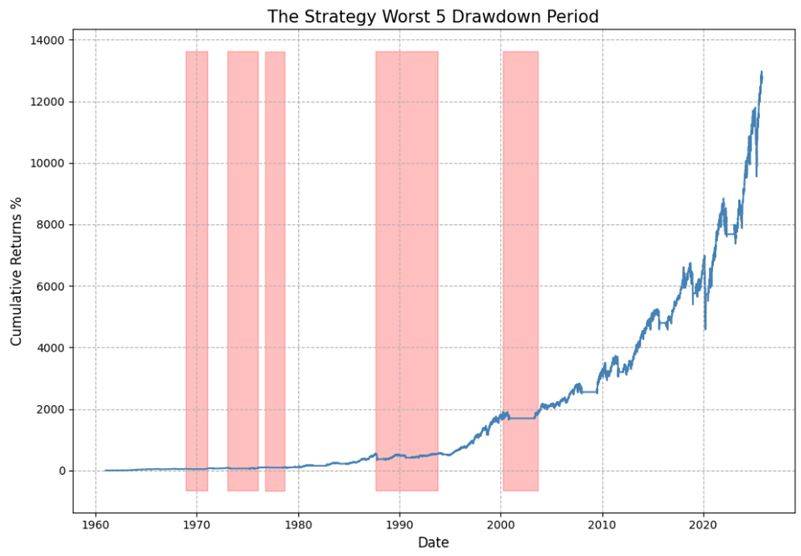
The chart below is the hypothetical standalone equity curve from using a 100% "All In or All Out" approach utilizing the strategy signals (again, not recommended, but included for illustrative purposes.
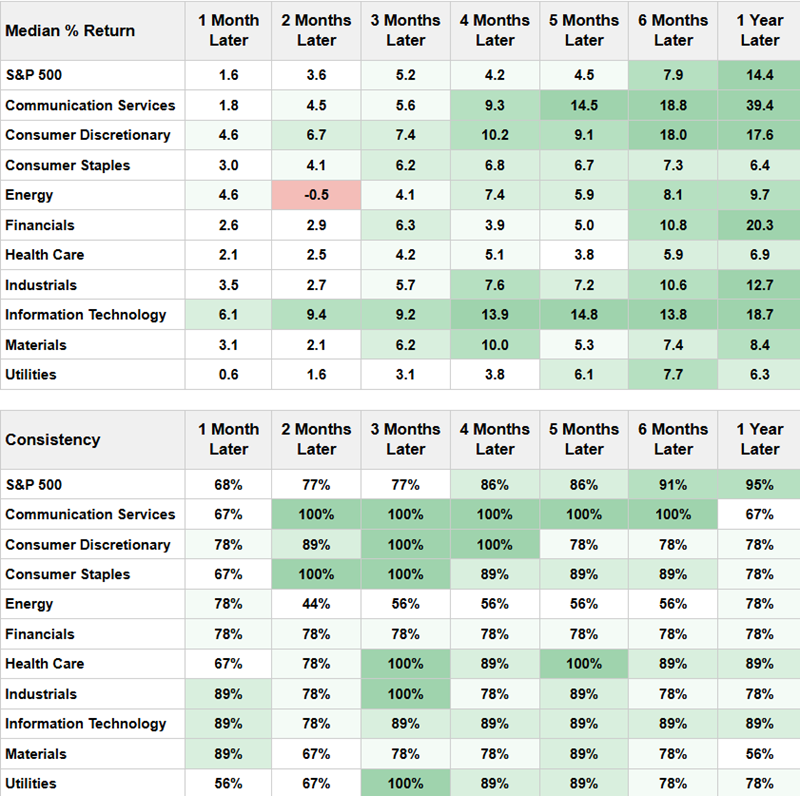
For comparison, the table below summarizes S&P 500 sector performance during strategy buy signals.
What the research tells us…
Needless to say, sentiment is one of the most important market indicators. The Sentiment Cycle Composite combines a variety of sentiment influences into one overarching indicator, which typically tracks closely with the prevailing trend of investor sentiment. When the indicator is rising and/or at a high level, it tends to bode well for stocks. When the indicator starts to fall - particularly when it crosses below -0.60 - it signals a warning sign that things may get much worse for investors. I don't recommend using the model presented here as the be-all, end-all of timing indicators. That said, it is an extremely gauge of overall investor sentiment and can be used as a tool to help decide stock market allocations.