Products
SentimenTrader Trading Tools
‍
Backtest Engine
My Trading Toolkit
Correlation Analysis
Seasonality
Indicators & Data API
‍
Proprietary Indicators & Charts
Market Data API
Strategies & Scanner
‍
50+ Trading Strategies
Smart Stock Scanner
Research Reports
‍
Research Solutions
Reports Library
Free Resources
Simple Backtest Calculator
Simple Seasonality Calculator
The Kelly Criterion Calculator
Sentiment Geo Map
Public Research Reports
Pricing
Company
About
In the News
Testimonials
Client Success Stories
Contact
Log inLoginSign up
< BACK TO ALL REPORTS

A Historic Turn In Fortunes

Jason Goepfert
2019-09-11
null

This is an abridged version of our recent reports and notes. For immediate access with no obligation, sign up for a 30-day free trial now.
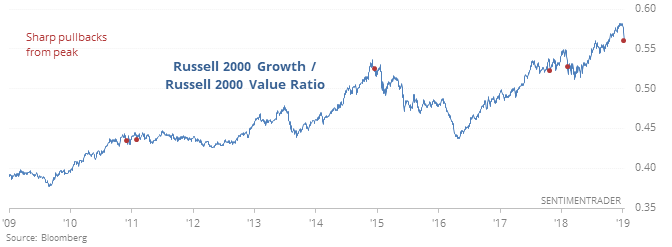
Growth no mo’ momo

The swift exodus from momentum stocks has hit those classified as “growth” hard, especially relative to those considered to be “value.” The ratio between them has corrected sharply from a recent high.

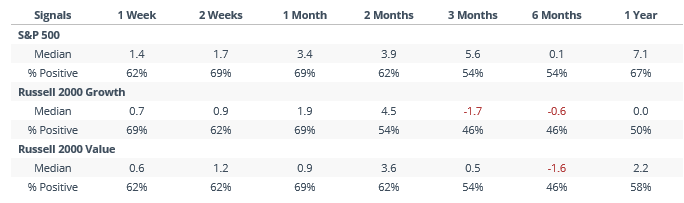
It wasn’t a consistent worry right away. All the indexes tended to rally over the next 1-4 weeks. But over the medium-term of 3-6 months, there was some trouble more often than not.

TRIN turnaround

The Arms Index, aka TRIN, hit extremely high levels last month, showing that an abnormal amount of volume was flowing into declining stocks, a sign of panic. That has now completely reversed.

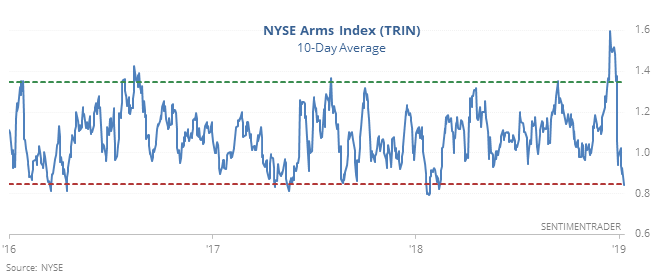
Other times the indicator made a round-trip from a high to low level since 1962, it mostly boded well for stocks, especially if we take out the 2001-03 bear market.

Those flows, though

The major index ETFs have taken in more than $9 billion in assets over the past four days, one the largest amounts in years. Their total shares outstanding have jumped about 2.5%, which doesn’t sound like much but it is.

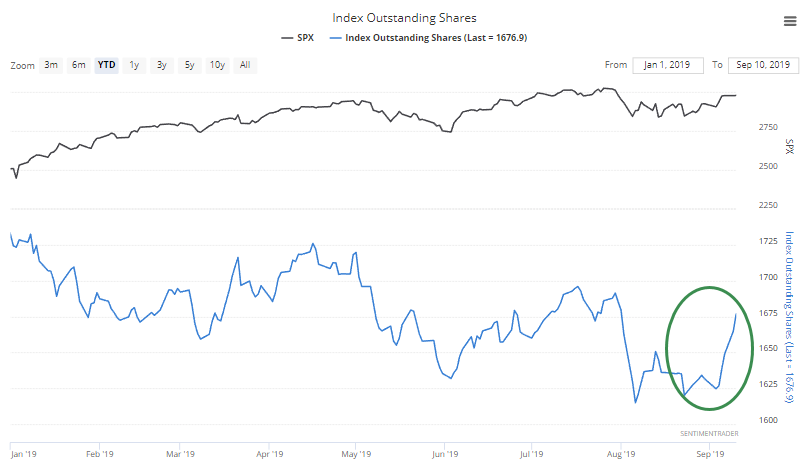
Because of shorting activity, this doesn’t necessarily mean that traders are suddenly buying SPY, QQQ, DIA, and IWM hand over fist. Other times their total shares jumped by this much, the S&P 500 was higher two weeks later 8 out of 9 times. Fund flows like this can be hard to use in a consistent way.

Wary Rydex

Investors who use the Rydex family of mutual funds tend to be market-timers, and as Troy points out, the flow to bearish funds has hit an extremes.

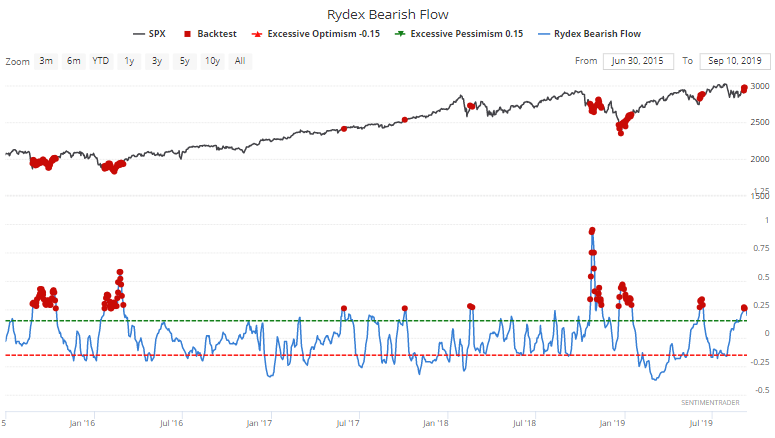
The Backtest Engine shows an 85% win rate 2 months later for the S&P 500 since the year 2000.

Darling Dow

The Dow has rallied 5 days in a row, while the NASDAQ has fallen on 3 of the past 5 days. (Or as almost everyone has noticed, value is outperforming growth). This happened 19 other times from 1970-present.

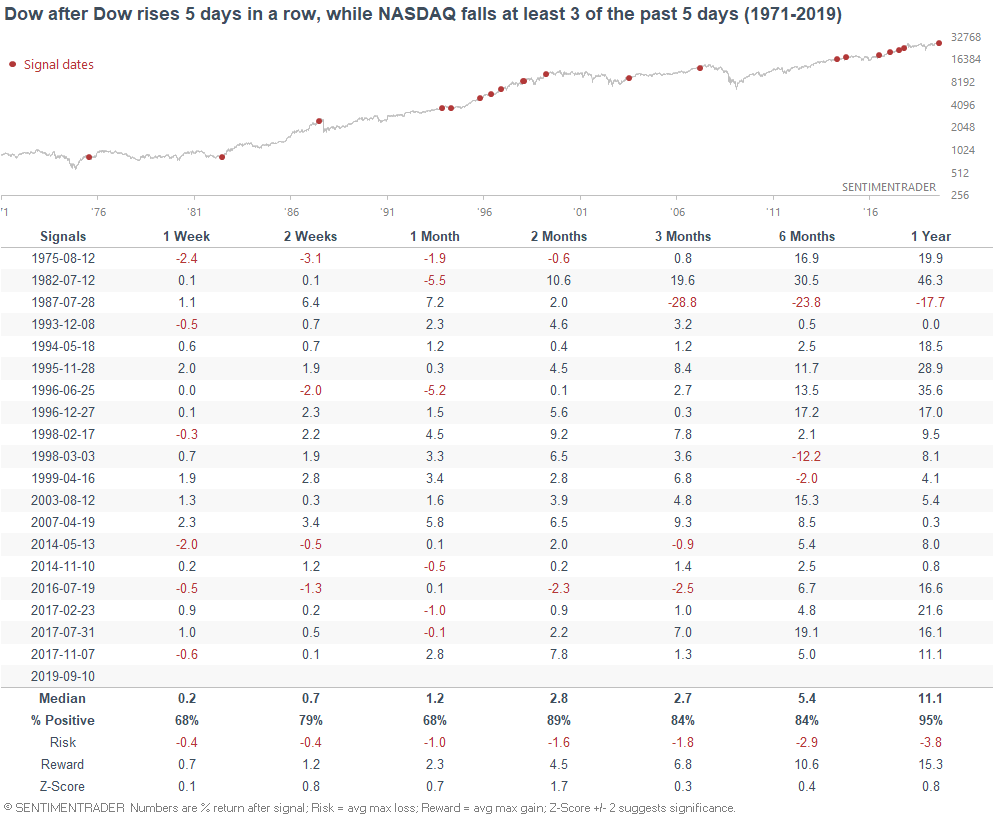
As you can see, this did happen before the 1987 crash and the 2007 bull market top. But overall, it was not consistently bearish for stocks on anytime frame. Something for everyone (bulls and bears), but this overall favors the bulls.

PRODUCTS
SentimenTrader
Trading Tools
Indicators & Data API
‍
Strategies & Scanner
‍
Research Reports
FREE
RESOUrCES
Simple Backtest
Calculator
Simple Seasonality
Calculator
The Kelly Criterion
Calculator
Sentiment Geo Map
‍
Public Research Reports
‍
Pricing
Bundle pricing
‍
Announcements
‍
FAQ
COMPANY
‍
About
‍
In the News
‍
Testimonials
‍
Client Success Stories
CONTACT
‍
General Inquiries
‍
Media Inquiries
‍
Financial Professionals Inquiries
‍
© 2025 Sundial Capital Research Inc. All rights reserved.
Setsail Marketing
TermsPrivacyAffiliate Program
Risk Disclosure: Futures and forex trading contains substantial risk and is not for every investor. An investor could potentially lose all or more than the initial investment. Risk capital is money that can be lost without jeopardizing ones’ financial security or life style. Only risk capital should be used for trading and only those with sufficient risk capital should consider trading. Past performance is not necessarily indicative of future results.

Hypothetical Performance Disclosure: Hypothetical performance results have many inherent limitations, some of which are described below. No representation is being made that any account will or is likely to achieve profits or losses similar to those shown; in fact, there are frequently sharp differences between hypothetical performance results and the actual results subsequently achieved by any particular trading program. One of the limitations of hypothetical performance results is that they are generally prepared with the benefit of hindsight. In addition, hypothetical trading does not involve financial risk, and no hypothetical trading record can completely account for the impact of financial risk of actual trading. for example, the ability to withstand losses or to adhere to a particular trading program in spite of trading losses are material points which can also adversely affect actual trading results. There are numerous other factors related to the markets in general or to the implementation of any specific trading program which cannot be fully accounted for in the preparation of hypothetical performance results and all which can adversely affect trading results.

Testimonial Disclosure: Testimonials appearing on this website may not be representative of other clients or customers and is not a guarantee of future performance or success.