Products
SentimenTrader Trading Tools
‍
Backtest Engine
My Trading Toolkit
Correlation Analysis
Seasonality
Market Prediction
Indicators & Data API
‍
Proprietary Indicators & Charts
Market Data API
Strategies & Scanner
‍
50+ Trading Strategies
Smart Stock Scanner
Smart Option Scanner
Research Reports
‍
Research Solutions
Reports Library
Free Resources
Simple Backtest Calculator
Simple Seasonality Calculator
The Kelly Criterion Calculator
Sentiment Geo Map
Public Research Reports
Education
Sentiment Indicators
Technical Indicators
Pricing
Company
About
In the News
Testimonials
Client Success Stories
Contact
Log inLoginSign up
< BACK TO ALL REPORTS

A historic surge in new highs for Nikkei 225 members

Dean Christians
2024-01-12
The percentage of Nikkei 225 members registering a 4-week high surged by one of the most significant amounts in history. Similar breadth thrusts suggest the bullish price momentum for the bellwether Japanese index will persist over the subsequent year.

Key points:

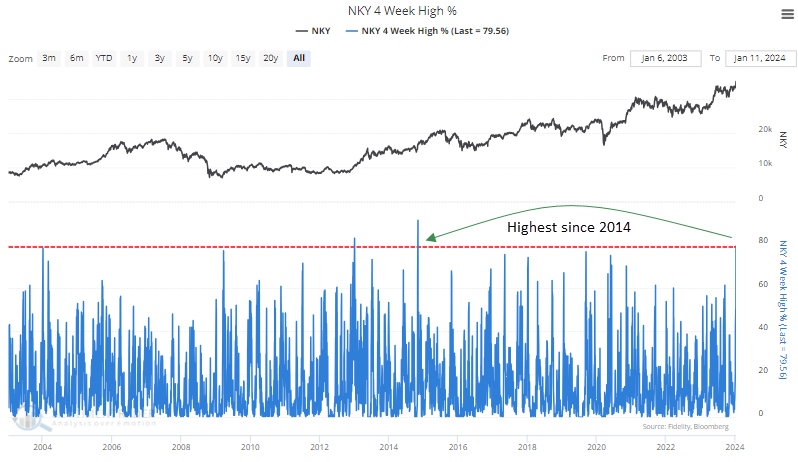
  • The percentage of Nikkei 225 stocks registering a 4-week high surged to the highest level in almost a decade
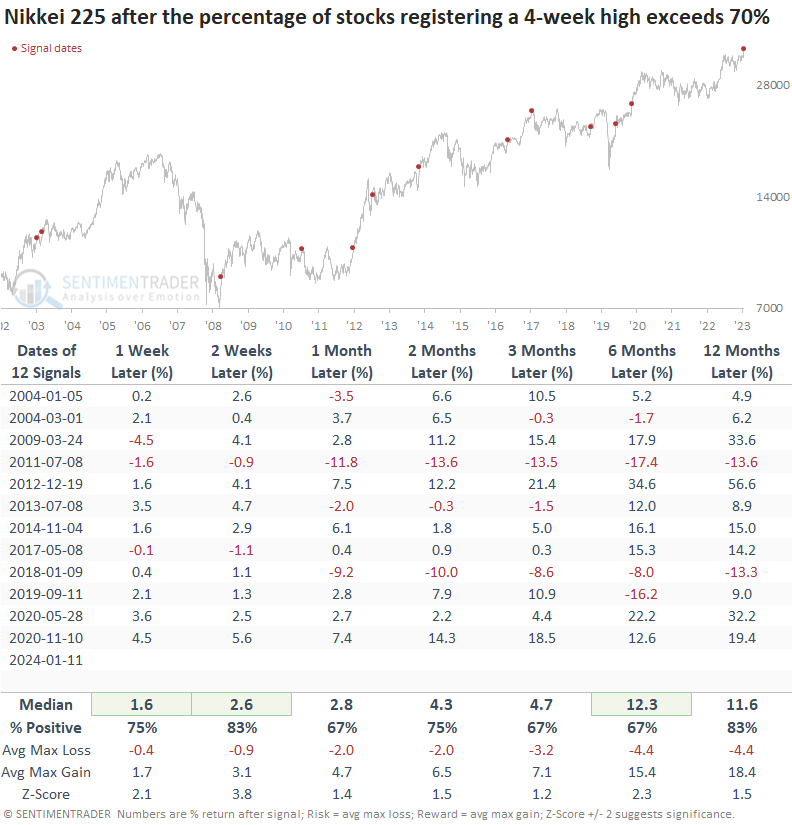
  • After similar thrusts, the bellwether Japanese index was higher 83% of the time over the following two weeks
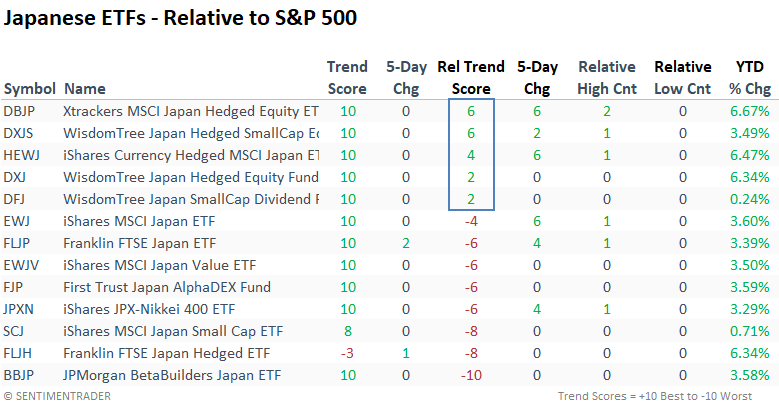
  • Currency-hedged Japanese ETFs exhibit the highest relative trend scores versus the S&P 500

Japanese stocks are soaring higher

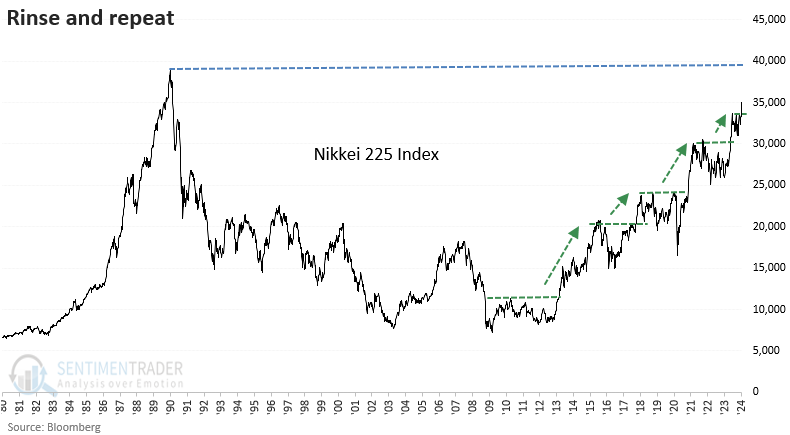
The Nikkei 225 continues to exhibit bull market characteristics with consolidations followed by impressive upside breakouts.

After consolidating for six months, the bellwether Japanese index broke out this week to a 34-year high. Participation was spectacular, with more than 79% of index members registering a new 4-week high, reaching the highest level in almost a decade.

Similar expansions in 4-week highs preceded positive returns 

Whenever the percentage of Nikkei 225 members registering a 4-week high exceeds 70%, the bullish price momentum is likely to continue in the near term, with the index rising 83% of the time over the subsequent two weeks. Over the following year, the Nikkei was higher in all but two cases. The only signal to mark an immediate top occurred in 2011 when the Nikkei was mired in a lengthy downtrend.

How can we participate in Japan?

In my previous research notes, I recommended the WisdomTree Japan Hedged ETF (DXJ) due to the currency hedge overlay, which attempts to mitigate the impact of severe moves in the Yen. 

The distinction between currency-hedged and non-hedged ETFs becomes apparent when examining relative trend scores and year-to-date returns. ETFs employing currency hedging outperform their counterparts on a YTD basis and show superior relative trend scores.

I would continue to stick with hedged ETFs. 
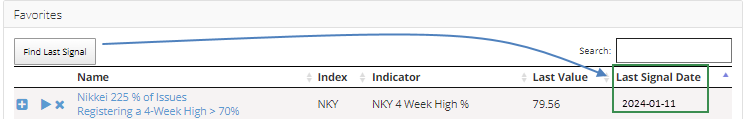
Backtest Engine

Sentimentrader website subscribers can effortlessly create, save, and monitor trading signals, just like the one showcased here. With our Find Last Signal feature, users can efficiently scan hundreds of alerts at the click of a button. 

Big picture

The consistent stair-stepping pattern in the Nikkei 225 is a textbook example of the type of breakouts that traders dream about.

What the research tells us...

The percentage of Nikkei 225 members registering a 4-week high surged by one of the most significant amounts in history. After similar breadth thrusts, the momentum in the bellwether Japanese index will likely continue in the near term and over the subsequent year. With the Yen starting to weaken again, investors should favor currency-hedged ETFs. 

PRODUCTS
SentimenTrader
Trading Tools
Indicators & Data API
‍
Strategies & Scanner
‍
Research Reports
FREE
RESOUrCES
Simple Backtest
Calculator
Simple Seasonality
Calculator
The Kelly Criterion
Calculator
Sentiment Geo Map
‍
Public Research Reports
‍
Education
Sentiment Indicators
‍
Technical Indicators
‍
Pricing
Bundle pricing
‍
FAQ
‍
Announcements
‍
COMPANY
‍
About
‍
In the News
‍
Testimonials
‍
Client Success Stories
CONTACT
‍
General Inquiries
‍
Media Inquiries
‍
Financial Professionals Inquiries
‍
© 2026 Sundial Capital Research Inc. All rights reserved.
Setsail Marketing
TermsPrivacyAffiliate Program
Risk Disclosure: The information and tools provided are for research and analytical purposes only and are not intended as investment advice. Market analysis involves uncertainty, and outcomes may differ from expectations. Users should conduct their own due diligence and consider their individual circumstances before making any financial decisions. Past performance is not necessarily indicative of future results.

Hypothetical Performance Disclosure: Hypothetical performance results have many inherent limitations, some of which are described below. No representation is being made that any account will or is likely to achieve profits or losses similar to those shown; in fact, there are frequently sharp differences between hypothetical performance results and the actual results subsequently achieved by any particular trading program. One of the limitations of hypothetical performance results is that they are generally prepared with the benefit of hindsight. In addition, hypothetical trading does not involve financial risk, and no hypothetical trading record can completely account for the impact of financial risk of actual trading. for example, the ability to withstand losses or to adhere to a particular trading program in spite of trading losses are material points which can also adversely affect actual trading results. There are numerous other factors related to the markets in general or to the implementation of any specific trading program which cannot be fully accounted for in the preparation of hypothetical performance results and all which can adversely affect trading results.

Testimonial Disclosure: Testimonials appearing on this website may not be representative of other clients or customers and is not a guarantee of future performance or success.