Products
SentimenTrader Trading Tools
‍
Backtest Engine
My Trading Toolkit
Correlation Analysis
Seasonality
Indicators & Data API
‍
Proprietary Indicators & Charts
Market Data API
Strategies & Scanner
‍
50+ Trading Strategies
Smart Stock Scanner
Research Reports
‍
Research Solutions
Reports Library
Free Resources
Simple Backtest Calculator
Simple Seasonality Calculator
The Kelly Criterion Calculator
Sentiment Geo Map
Public Research Reports
Education
Sentiment Indicators
Technical Indicators
Pricing
Company
About
In the News
Testimonials
Client Success Stories
Contact
Log inLoginSign up
< BACK TO ALL REPORTS

A Historic Split Between Haves and Have-Nots on the Nasdaq

Jason Goepfert
2021-08-11
There is a historically smaller percentage of companies in the Nasdaq Composite trading above their 50-day averages than in the Nasdaq 100.

Since the speculative peak in February, the stock market has become more bifurcated between winners and losers. That's normally a bad sign for the overall market, but 2021 has steamrolled every "bad sign" so far.

This winner-vs-everyone-else divergence is especially evident on the Nasdaq. In recent days, more than 70% of stocks included in the Nasdaq 100 index have closed above their 50-day moving averages. But within the broader Nasdaq Composite index, fewer than 40% of stocks are above those trendlines.

Nasdaq 100 vs Composite members above 50 day moving average

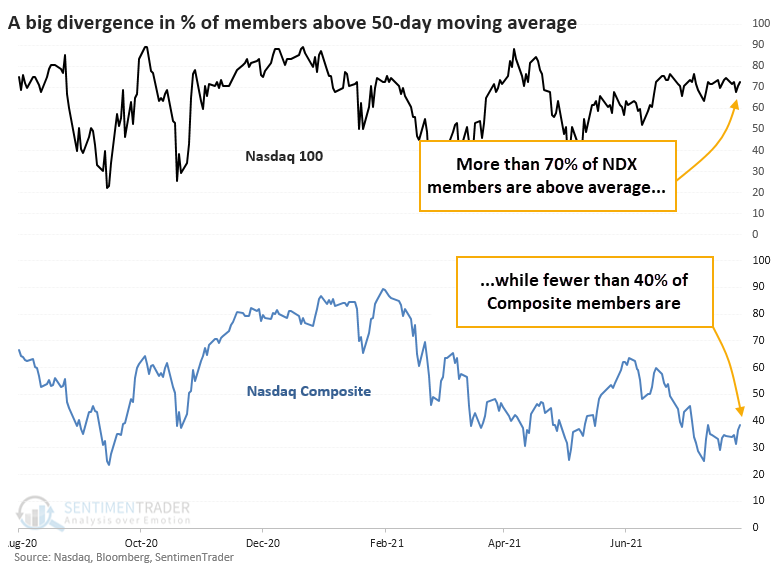
There are 102 stocks in the Nasdaq 100, and they have a median market capitalization of $58 billion. There are 3,423 securities in the Nasdaq Composite, with a median market cap of $471 million. Many of the smaller stocks in the broader Composite are dragging the internal breadth figures lower.

The 5-day average of the spread in breadth between those indexes is now among the widest in 20 years. Looking at the ratio between indexes, these extremes in the medium-term trends tended to coincide with shorter-term blowoff peaks in the Nasdaq 100 to Nasdaq Composite ratio.


What else we're looking at

  • Full returns in the Nasdaq 100 and Composite after wide spreads in breadth
  • What these spreads meant for the ratio between indexes, and for the S&P 500
  • A look at gold's flash crash
  • Two options trade examples that would profit on a summer swoon
  • There is currently an extreme in the ratio of the S&P 500 equal-weight vs cap-weight indexes

Stat box

There are only 79 million shares outstanding in the JNK high-yield bond fund, the lowest since April 2020 and nearing the lowest level in 3 years as traders leave for other funds or the asset altogether.

Etcetera

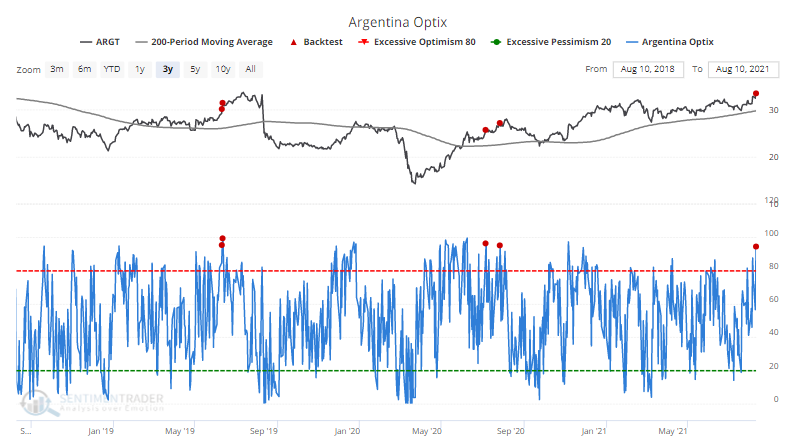
¡Caray! Optimism is high for Argentina at the moment. The Optimism Index on the ARGT fund has soared to one of its highest levels in 3 years. Our Backtest Engine shows that the fund continued to gain only 31% of the time when optimism has been this high since the fund's inception.

argt argentina optimism sentiment

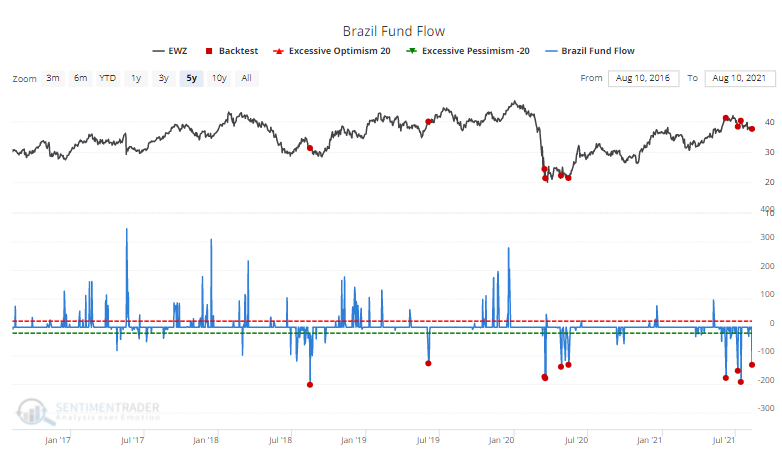
Less enthusiasm to the north. Unlike in Argentina, traders in the EWZ Brazil fund have been leaving in droves, with more than $125 million being pulled from the fund on Tuesday alone.

ewz brazil fund flow

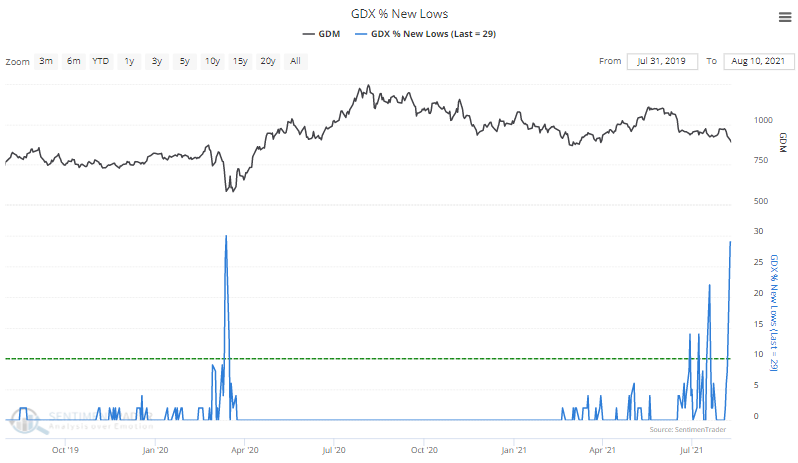
No love for miners. Nearly 30% of gold mining stocks have careened to a 52-week low. That's among the most in the past 2 years.

gdx gold miner members 52 week low

PRODUCTS
SentimenTrader
Trading Tools
Indicators & Data API
‍
Strategies & Scanner
‍
Research Reports
FREE
RESOUrCES
Simple Backtest
Calculator
Simple Seasonality
Calculator
The Kelly Criterion
Calculator
Sentiment Geo Map
‍
Public Research Reports
‍
Education
Sentiment Indicators
‍
Technical Indicators
‍
Pricing
Bundle pricing
‍
FAQ
‍
Announcements
‍
COMPANY
‍
About
‍
In the News
‍
Testimonials
‍
Client Success Stories
CONTACT
‍
General Inquiries
‍
Media Inquiries
‍
Financial Professionals Inquiries
‍
© 2025 Sundial Capital Research Inc. All rights reserved.
Setsail Marketing
TermsPrivacyAffiliate Program
Risk Disclosure: Futures and forex trading contains substantial risk and is not for every investor. An investor could potentially lose all or more than the initial investment. Risk capital is money that can be lost without jeopardizing ones’ financial security or life style. Only risk capital should be used for trading and only those with sufficient risk capital should consider trading. Past performance is not necessarily indicative of future results.

Hypothetical Performance Disclosure: Hypothetical performance results have many inherent limitations, some of which are described below. No representation is being made that any account will or is likely to achieve profits or losses similar to those shown; in fact, there are frequently sharp differences between hypothetical performance results and the actual results subsequently achieved by any particular trading program. One of the limitations of hypothetical performance results is that they are generally prepared with the benefit of hindsight. In addition, hypothetical trading does not involve financial risk, and no hypothetical trading record can completely account for the impact of financial risk of actual trading. for example, the ability to withstand losses or to adhere to a particular trading program in spite of trading losses are material points which can also adversely affect actual trading results. There are numerous other factors related to the markets in general or to the implementation of any specific trading program which cannot be fully accounted for in the preparation of hypothetical performance results and all which can adversely affect trading results.

Testimonial Disclosure: Testimonials appearing on this website may not be representative of other clients or customers and is not a guarantee of future performance or success.