Products
SentimenTrader Trading Tools
‍
Backtest Engine
My Trading Toolkit
Correlation Analysis
Seasonality
Market Prediction
Indicators & Data API
‍
Proprietary Indicators & Charts
Market Data API
Strategies & Scanner
‍
50+ Trading Strategies
Smart Stock Scanner
Smart Option Scanner
Research Reports
‍
Research Solutions
Reports Library
Free Resources
Simple Backtest Calculator
Simple Seasonality Calculator
The Kelly Criterion Calculator
Sentiment Geo Map
Public Research Reports
Education
Sentiment Indicators
Technical Indicators
Pricing
Company
About
In the News
Testimonials
Client Success Stories
Contact
Log inLoginSign up
< BACK TO ALL REPORTS

A historic shift toward Defensive and Value stocks

Jason Goepfert
2022-02-10
Heading into this week, Defensive stocks outperformed Cyclical ones by more than 7% over the prior month. And Value stocks outperformed Growth by that same amount. When both "safe" factors outperformed their "riskier" counterparts by more than 7%, stocks struggled.

Key points:

  • Defensive stocks outperformed Cyclical ones by more than 7% over the past month
  • Value outperformed Growth, also by more than 7%
  • When both "safe" factors outperformed their "risky" counterparts by so much, stocks struggled

Investor preference for Defensive and Value stocks hits historical proportions

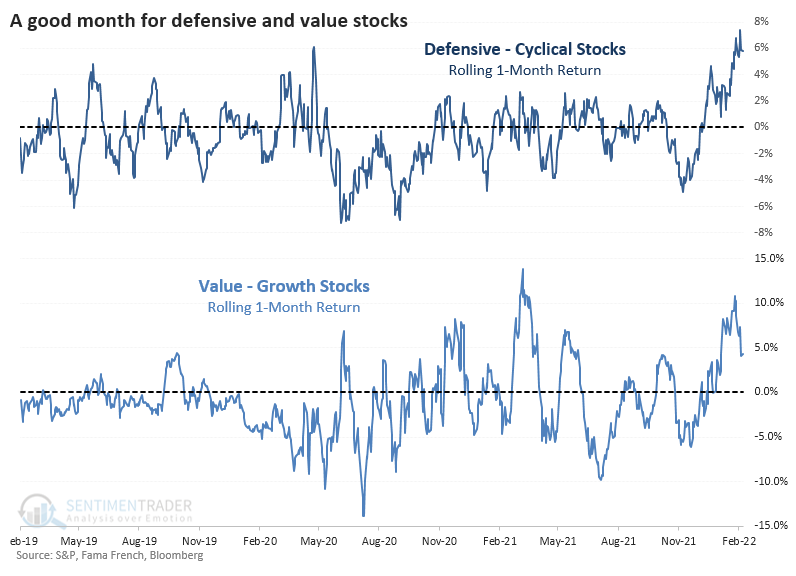
Over the past month, we've seen a massive shift. Investor sentiment turned sour on Cyclical and Growth stocks, greatly favoring Defensive and Value factors.

It has eased back over the past few days as risk appetite made a comeback, but using a rolling 21-day lookback, Defensive stocks outperformed Cyclical by more than 7%. So did Value stocks over Growth. Both ratios eased a bit in recent days, but their outperformance is still notable and is among the most extreme moves in years.

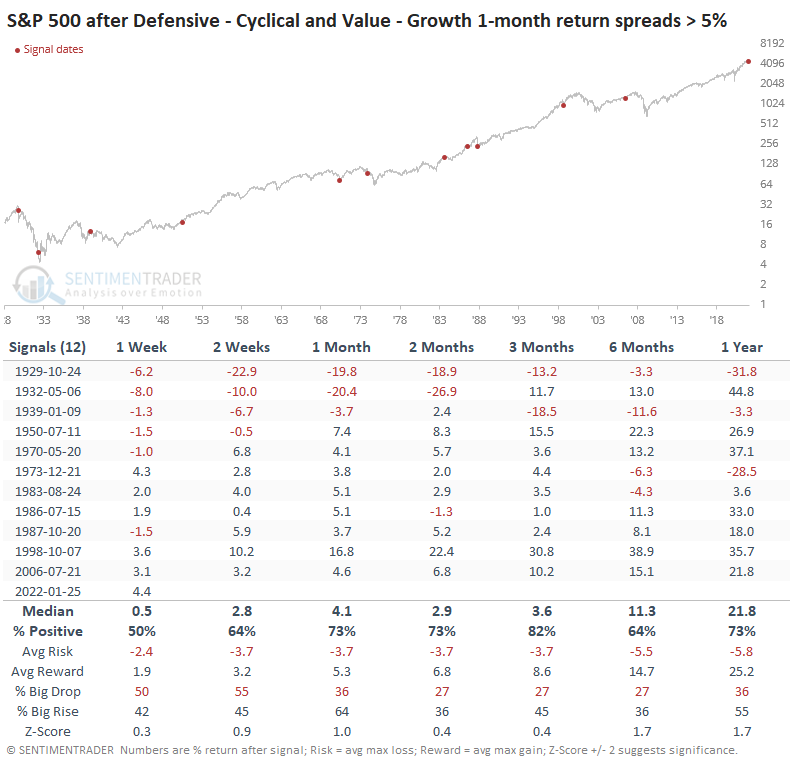
Going back to 1928, this 7% relative outperformance in both Defensive and Value stocks is remarkable. The chart below shows the minimum rolling 1-month return between Defensive - Cyclical stocks and Value - Growth stocks. If it's positive, then it means that investors favored both Defensive and Value stocks.

Not only was the recent spread positive, it was also historically so. There have only been a few other times since 1928 when investors so heavily favored Defensive and Value stocks over Cyclical and Growth.

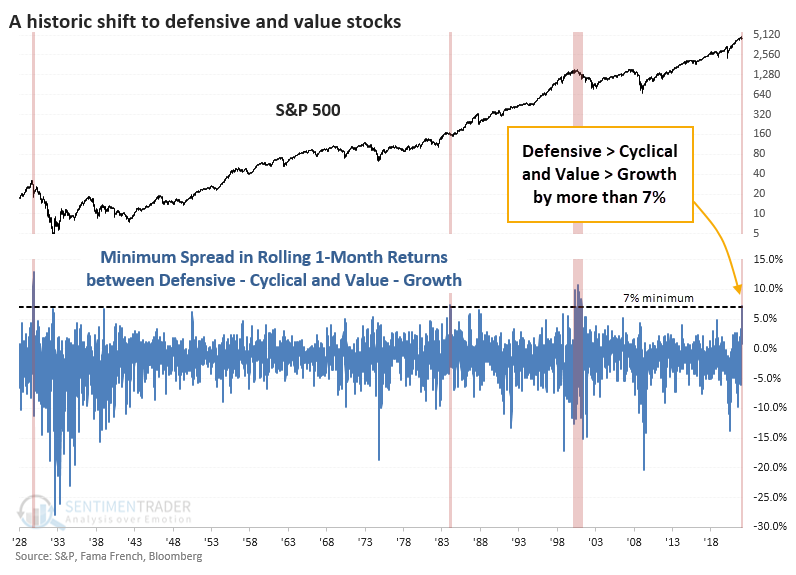
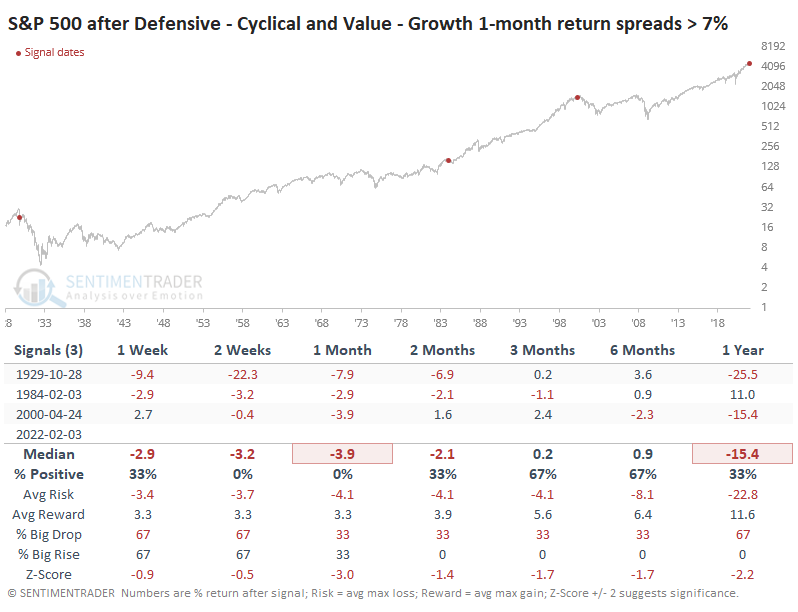
It would be easy to highlight 1929 and 2000 and suggest this is a sign of the apocalypse. It's harder to reconcile 1984, which preceded a few months of choppiness, then a fantastic bull run.

Lesser outperformance for Defensive and Value stocks preceded better returns

It's hard to rely on a sample size of 3. If we relax the threshold to 5% outperformance, then we get quite a few more precedents, though the last signal was still 16 years ago.

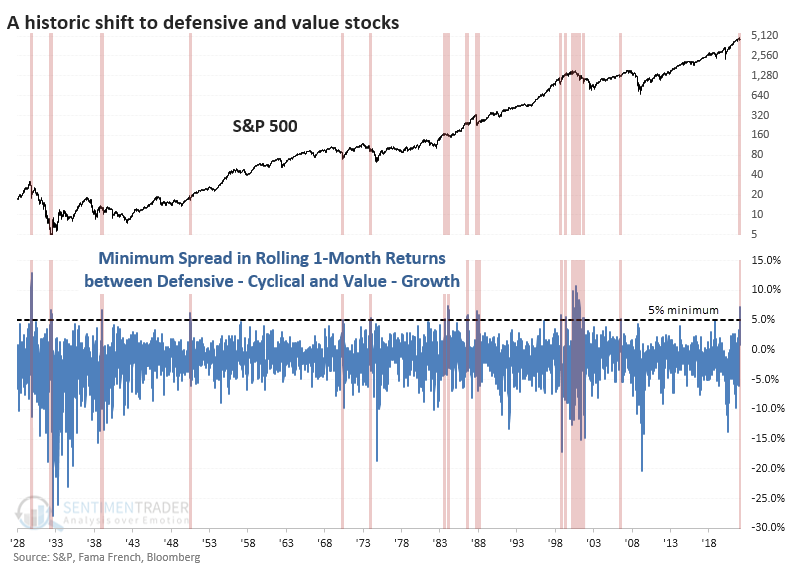
Looking at forward returns after those signals, returns in the S&P 500 improved and were quite good over all time frames. Since 1950, almost all the signals showed a positive return over the next 1-3 months, and most of them extended those gains in the months ahead.

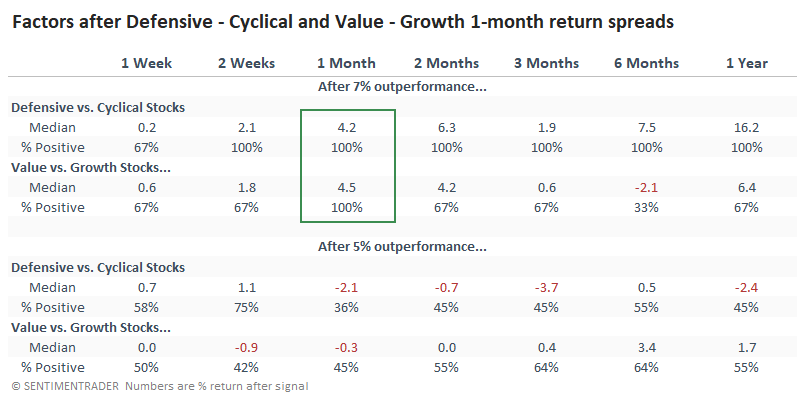
Returns in the factors themselves were mixed. After the few periods of 7% outperformance, Defensive stocks continued to outperform Cyclicals and Value stocks outperformed Growth. But again, a sample size of 3. Unfortunately, the implications weren't consistent when we reduced the threshold to 5% outperformance. After those signals, there was much less consistency.

What the research tells us...

This is one of those tough periods when we have to judge how much weight to give the outstanding outperformance of Defensive and Value stocks. The few precedents are clear that stocks, in general, tended to suffer, with Defensive and Value stocks adding to their gains versus higher-risk factors. But a modest reduction in the extreme greatly changed the outcomes, which makes it much harder to rely on the signal as an input.

PRODUCTS
SentimenTrader
Trading Tools
Indicators & Data API
‍
Strategies & Scanner
‍
Research Reports
FREE
RESOUrCES
Simple Backtest
Calculator
Simple Seasonality
Calculator
The Kelly Criterion
Calculator
Sentiment Geo Map
‍
Public Research Reports
‍
Education
Sentiment Indicators
‍
Technical Indicators
‍
Pricing
Bundle pricing
‍
FAQ
‍
Announcements
‍
COMPANY
‍
About
‍
In the News
‍
Testimonials
‍
Client Success Stories
CONTACT
‍
General Inquiries
‍
Media Inquiries
‍
Financial Professionals Inquiries
‍
© 2026 Sundial Capital Research Inc. All rights reserved.
Setsail Marketing
TermsPrivacyAffiliate Program
Risk Disclosure: The information and tools provided are for research and analytical purposes only and are not intended as investment advice. Market analysis involves uncertainty, and outcomes may differ from expectations. Users should conduct their own due diligence and consider their individual circumstances before making any financial decisions. Past performance is not necessarily indicative of future results.

Hypothetical Performance Disclosure: Hypothetical performance results have many inherent limitations, some of which are described below. No representation is being made that any account will or is likely to achieve profits or losses similar to those shown; in fact, there are frequently sharp differences between hypothetical performance results and the actual results subsequently achieved by any particular trading program. One of the limitations of hypothetical performance results is that they are generally prepared with the benefit of hindsight. In addition, hypothetical trading does not involve financial risk, and no hypothetical trading record can completely account for the impact of financial risk of actual trading. for example, the ability to withstand losses or to adhere to a particular trading program in spite of trading losses are material points which can also adversely affect actual trading results. There are numerous other factors related to the markets in general or to the implementation of any specific trading program which cannot be fully accounted for in the preparation of hypothetical performance results and all which can adversely affect trading results.

Testimonial Disclosure: Testimonials appearing on this website may not be representative of other clients or customers and is not a guarantee of future performance or success.