
A historic reversal in Financials bodes well for the sector

Key points:
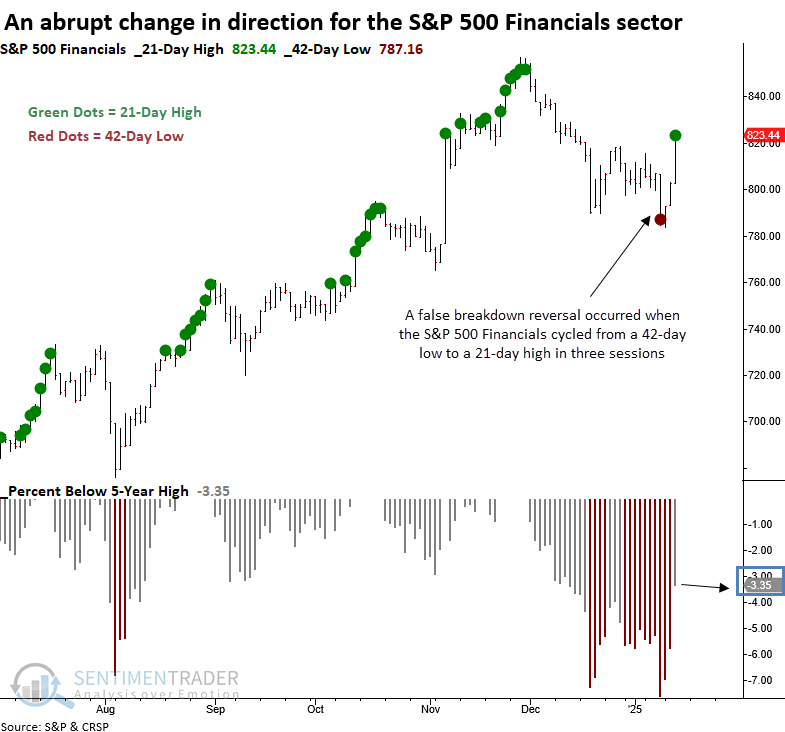
- The S&P 500 Financials cycled from a 42-day low to a 21-day high in three sessions
- Similar false breakdown reversals produced a 75% win rate for the sector over the subsequent two weeks
- Relative highs and robust trend scores point to a supportive environment for financials
Financials triggered a bullish reversal pattern
The S&P 500 Financials sector surged on Wednesday, achieving a historic milestone never seen when it cycled from a 42-day low to a 21-day high in only three sessions.
This phenomenon, known as a false breakdown, occurs when a stock or index breaks below a consolidation range but quickly reverses to the upside. While such reversals often lead back to the prior range, a decisive move beyond it can signal the start of a powerful, bullish advance.
Although ideally suited for high-octane growth stocks, this pattern works across indexes and sectors as traders reverse course after being whipsawed for fear of missing out. It's human nature.
Similar false breakdown reversals suggest Financials rally in the near term
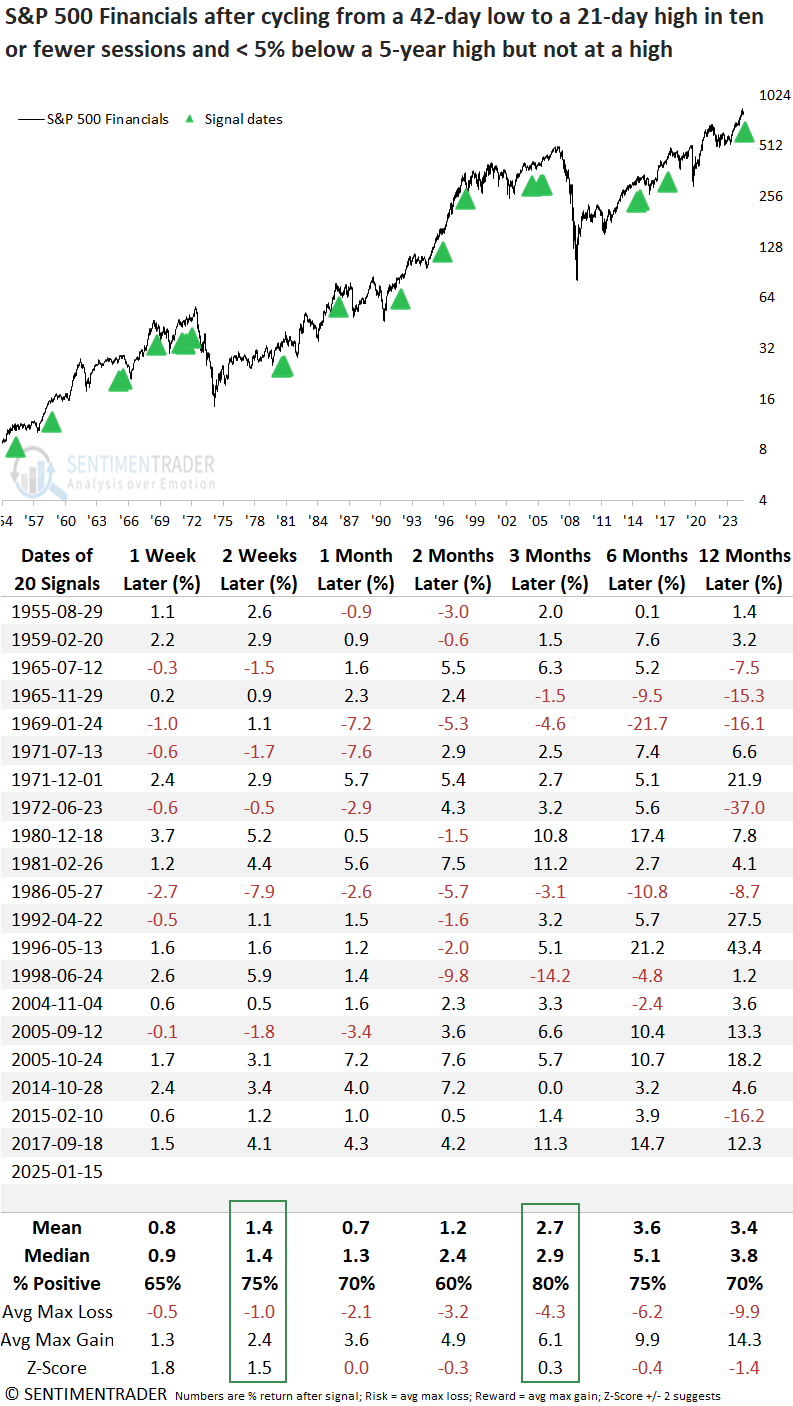
Whenever the S&P 500 Financials cycled from a 42-day low to a 21-day high in ten or fewer sessions and the index traded within 5% of a 5-year high but not at a high, the sector displayed a robust tendency to rally in the near term, rising 75% of the time over the subsequent two weeks.
Three months later, the group was higher 80% of the time, suggesting the rally was likely to persist.
Assessing a trade scenario
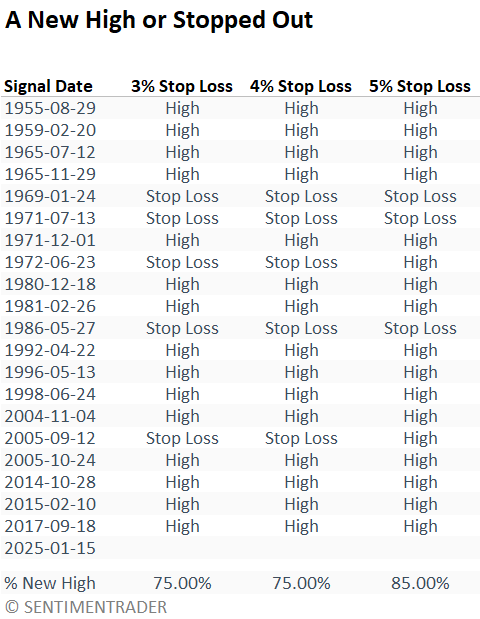
A test determining the ideal holding period between 1 and 42 trading sessions revealed that 13 days were optimal. Additionally, I evaluated whether the S&P 500 Financials would achieve a new high or hit a stop loss first, using thresholds of 3%, 4%, and 5%.
The table below illustrates that the sector recorded a new high in 75% of instances under a 3% or 4% stop-loss exit, with a 25% stop-out rate. Raising the stop loss to 5% improved the odds of a new high to 85%. Don't be surprised if financials hit new highs again.
In bull markets, it's all relative
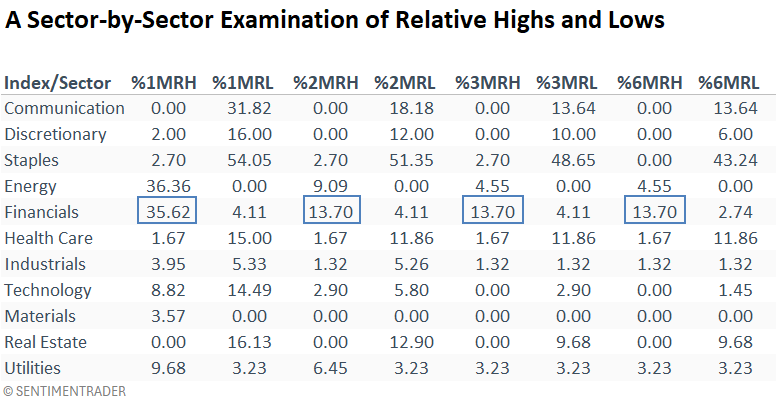
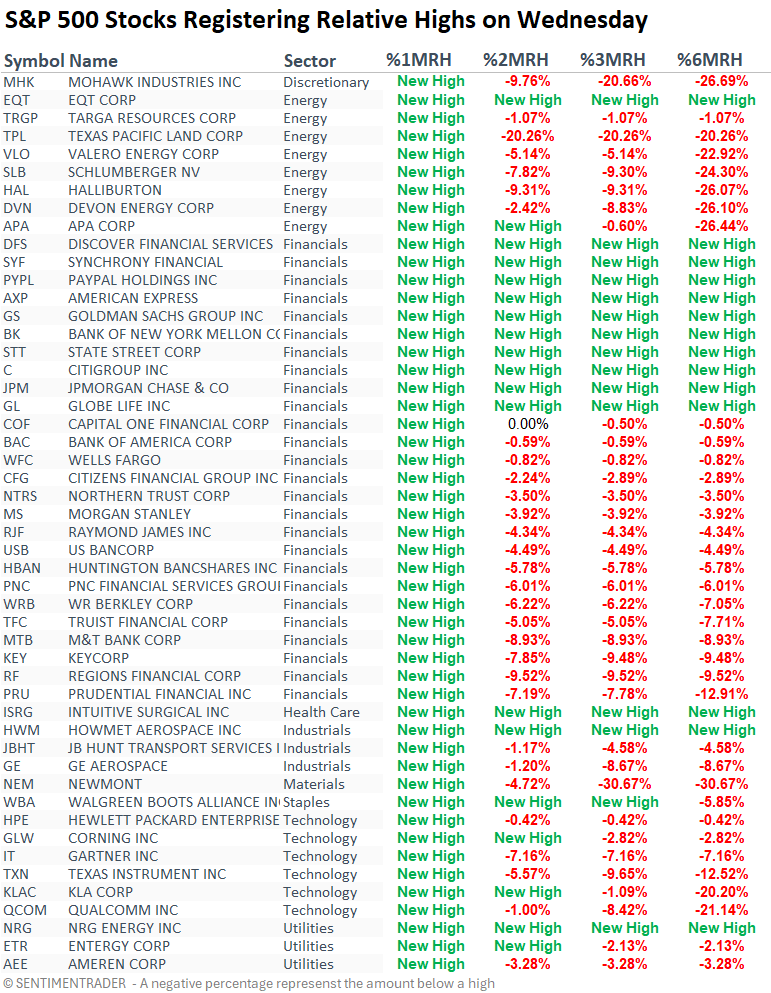
Although broad market indexes and other sectors rallied on Wednesday following the CPI report, S&P 500 Financial sector stocks produced the highest percentage of relative highs across all time frames, notwithstanding the 1-month period, where energy had a slight edge.
When stocks register relative highs ahead of an absolute high, it often serves as a reliable market clue.
On Wednesday, stocks hitting relative highs in the S&P 500 Financials sector were primarily from money center banks, investment banks, and consumer financial services.
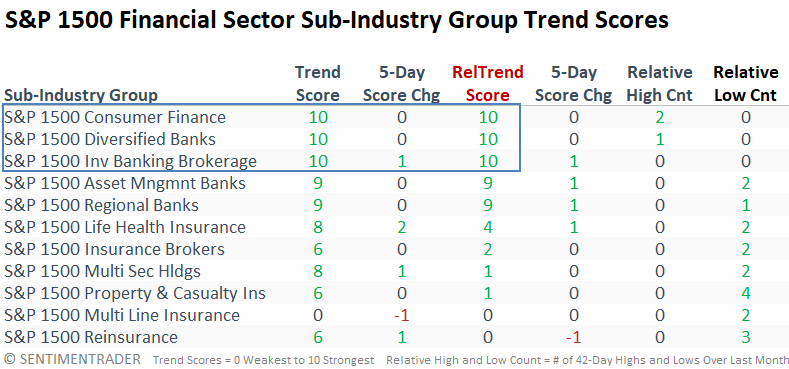
Top-down confirmation
An evaluation of trend scores for sub-industry groups in the S&P 1500 Financials sector reinforces Wednesday's observation regarding relative highs. Diversified banks, investment banks, and consumer finance stocks should be a key area of focus for investors.
What the research tells us...
The S&P 500 Financials sector cycled from a 42-day low to a 21-day high in three sessions-the swiftest reversal ever recorded. This remarkable turnaround, known as a false breakdown pattern, occurs when prices briefly dip below a critical support level only to rebound sharply. Such sequences often catch traders off guard, fueling a "fear of missing out" (FOMO) dynamic as market participants rush to join the rally. Comparable signals for the S&P Financials resulted in a 75% win rate over the subsequent two weeks. Furthermore, history suggests the sector is likely to register new highs rather than suffer a 3-5% drawdown. From a big-picture perspective, the technical backdrop for the group looks solid. Investors would be wise to maintain a healthy allocation to this value-based group to offset the dominant factor, growth.