
A historic rally and market breadth imbalance

Key points:
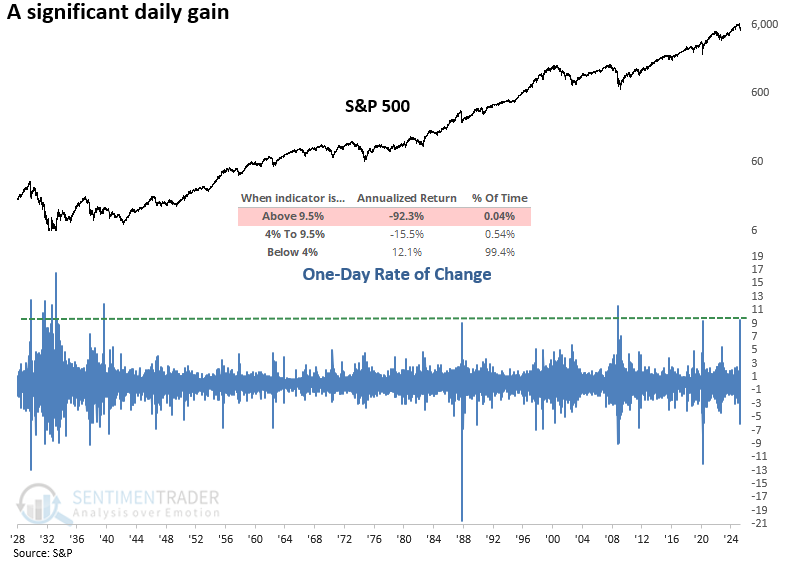
- On Wednesday, the S&P 500 rallied 9.52%, one of the most significant daily gains in history
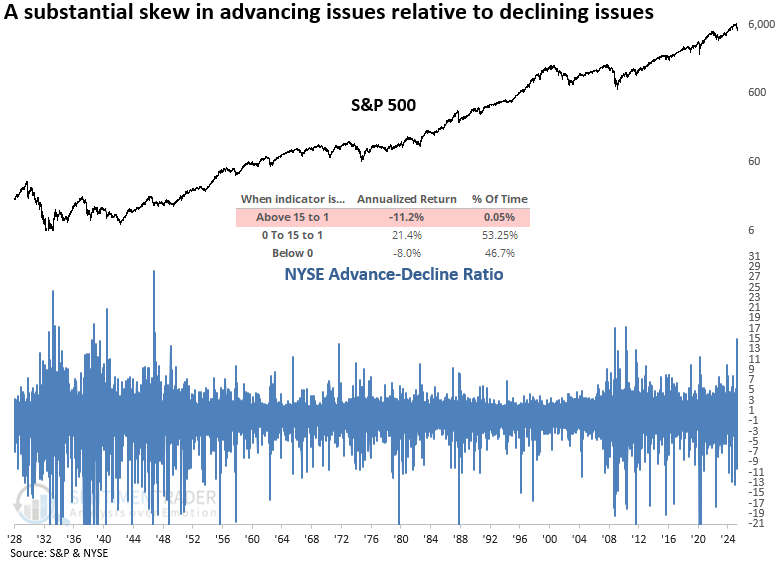
- Market breadth was equally impressive, with the NYSE advance-decline ratio exceeding 15 to 1
- Similar one-day events did not bode well for the S&P 500 over short, medium, and long-term horizons
Similar price action typically occurs during bear markets
With President Trump easing his tariff stance, stocks quickly responded to the positive shift. The S&P 500 jumped 9.52%, tying for the 9th most significant single-day gain since 1928, from one of the most historically oversold conditions.
Not to be overshadowed, breadth was explosive, with the NYSE advance-decline ratio reaching 15-to-1, a skew seen only ten other times in history.
Although this sharp one-day rebound in both price and breadth may have halted the momentum of the waterfall decline and created a technical level to trade against, history says the market still faces considerable risk.
Similar daily gains preceded a negative outlook for stocks
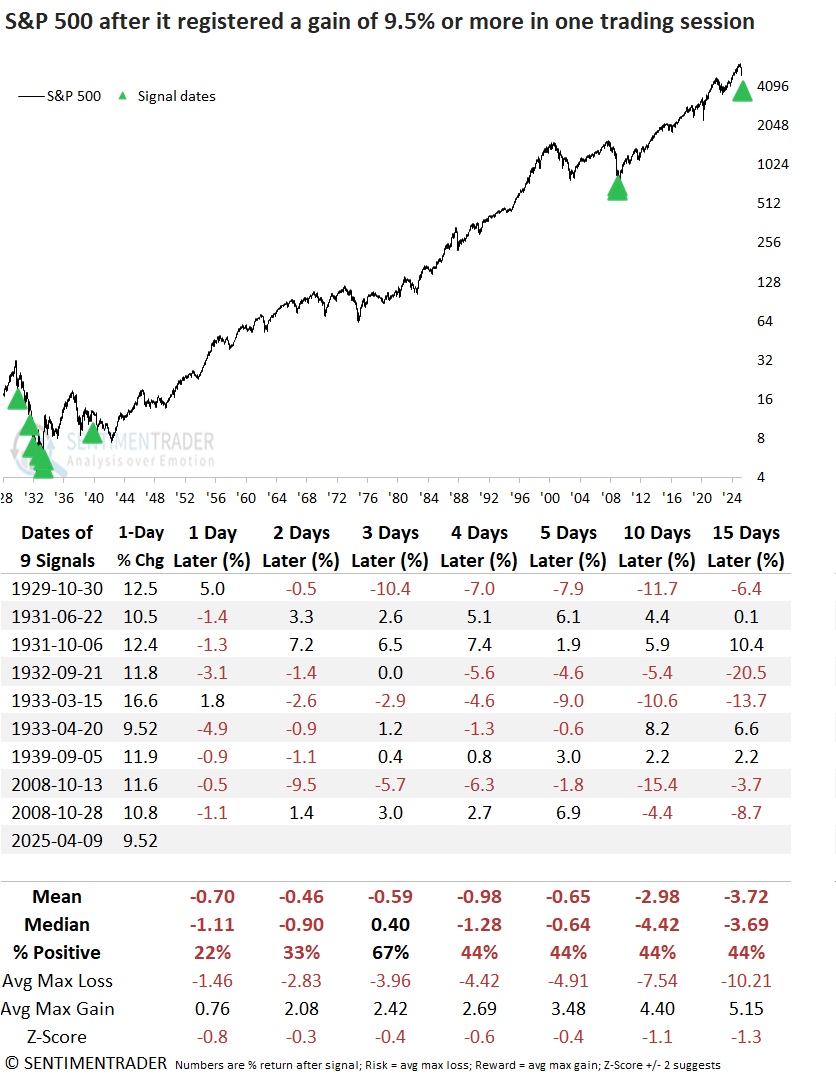
Whenever the S&P 500 surged 9.5% or more in a single trading session, the move was usually short-lived. The index fell 78% of the time the following day. While a secondary rally around day three was possible, the likelihood of further gains remained low.
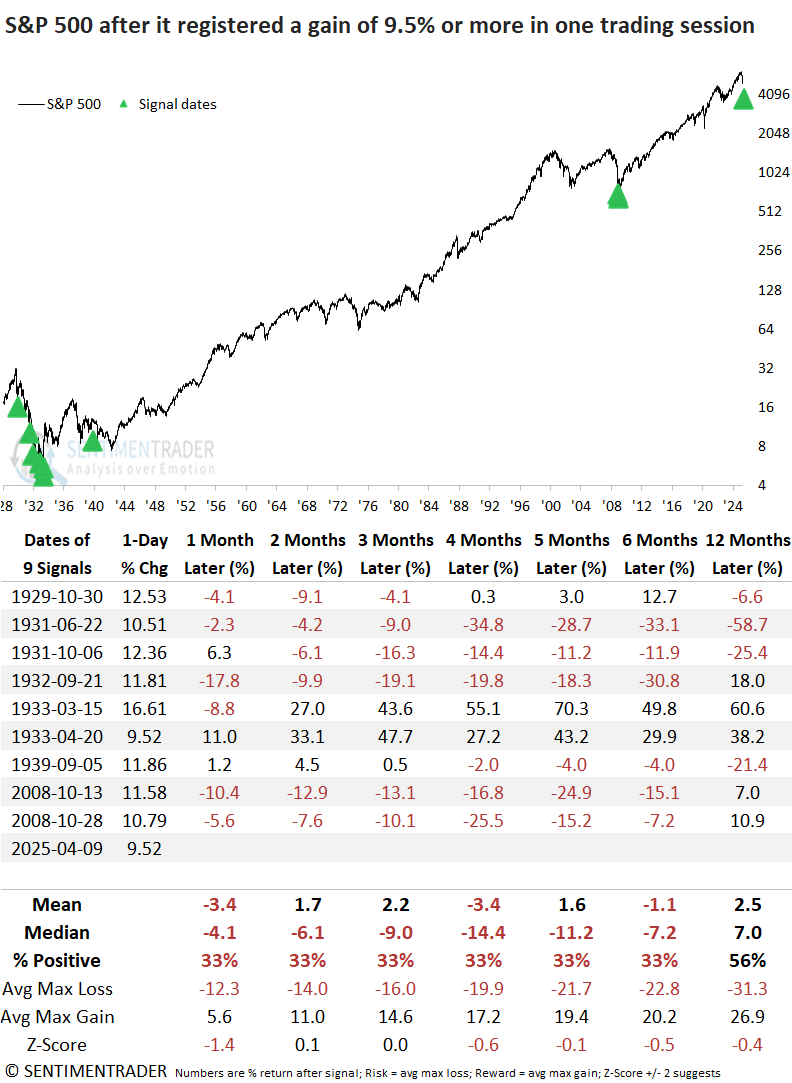
Over more extended time frames, the outlook for the S&P 500 remained concerning as these substantial rallies unfolded within broader bear market cycles.
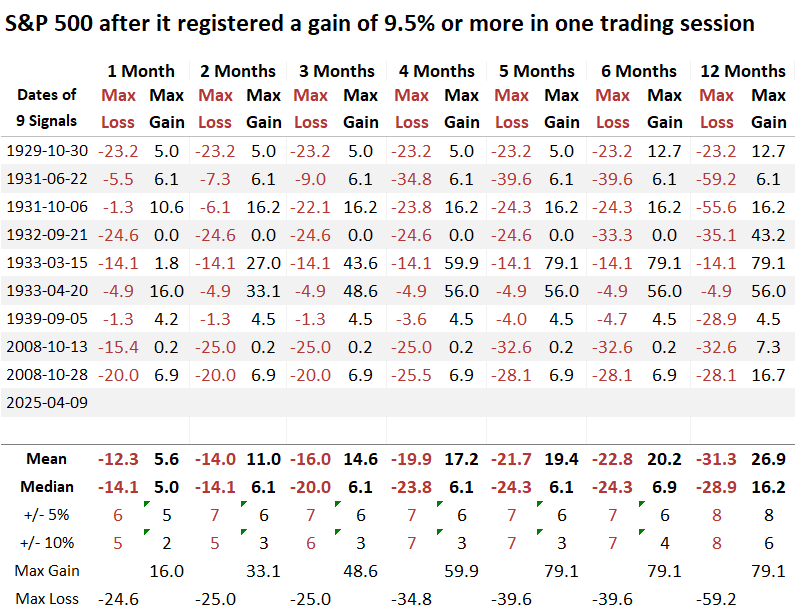
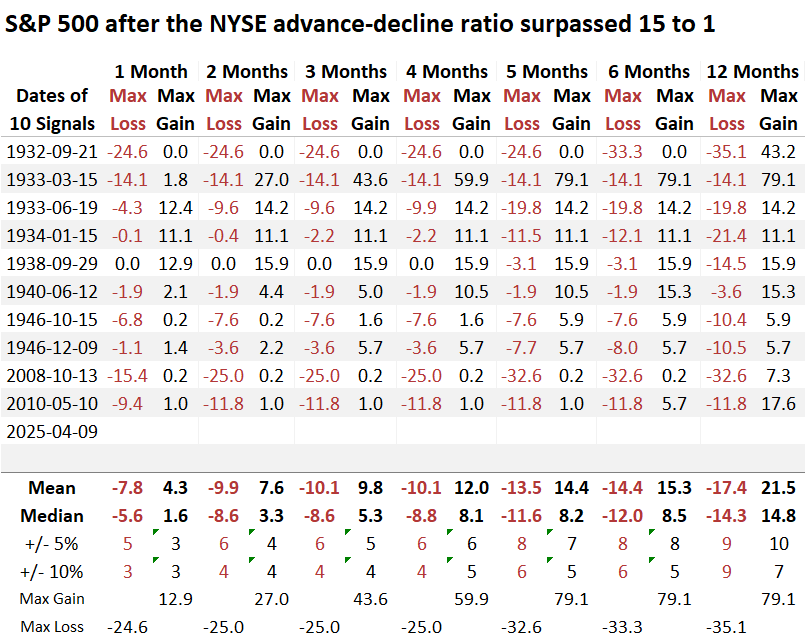
Over the next six months, a maximum loss of -10% was surpassed in 7 out of 9 cases. By comparison, 4 of 9 rose more than 10%, underscoring an unfavorable risk-reward profile.
Overwhelmingly positive breadth is not always bullish
Much like the annualized returns following substantial one-day rallies, when the daily advance-decline ratio exceeded 15-to-1, the outcome was negative, with the S&P 500 posting an annualized return of -11.2%.
As I write this report, the world's most widely followed index is down 5.0%, illustrating how these substantial one-off events lead to negative annualized returns.
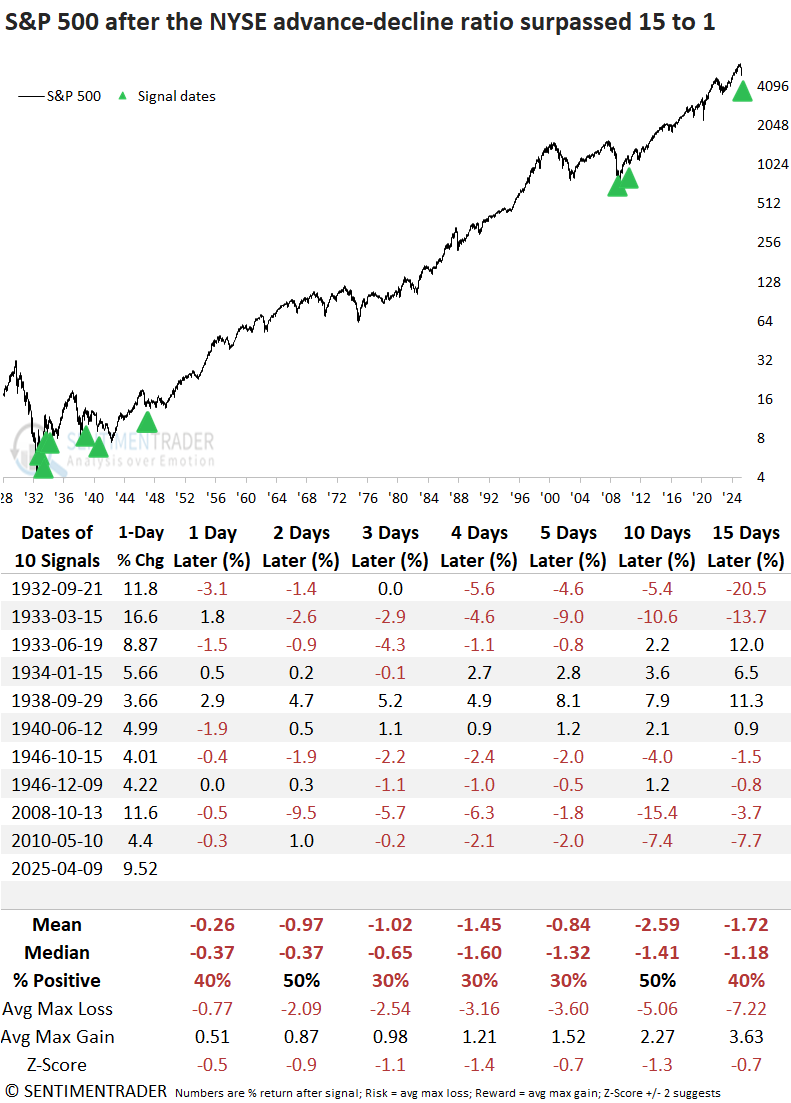
Each time the NYSE advance-decline ratio exceeded 15 to 1, the S&P 500 experienced negative returns and unfavorable win rates from one to fifteen days afterward, indicating a lack of upside follow-through. Additionally, when the A-D ratio reached 15 to 1, and the S&P 500 had gained 9% or more, the benchmark index posted negative returns in the subsequent 15 days on every occasion.
The outlook table measuring more extended horizons suggests the S&P 500 will face a challenging environment over the subsequent six months.
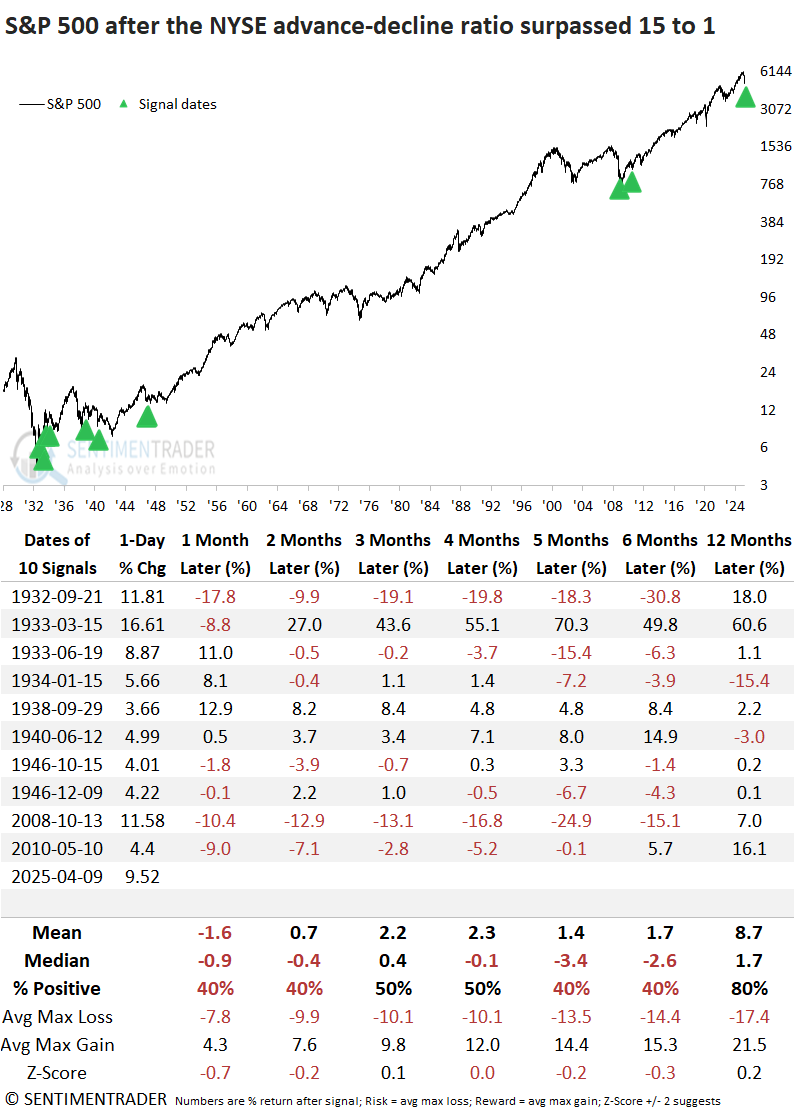
Over the next 12 months, 9 out of 10 cases experienced a loss more significant than -10%, while 7 out of 10 saw gains exceeding 10%, indicating a high-risk market environment.
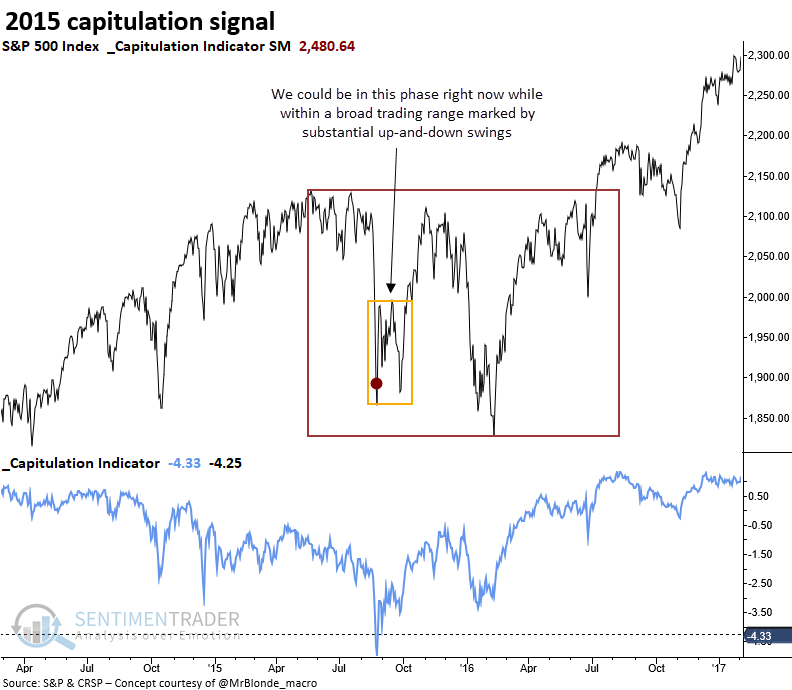
A potential analog
In my report, A Rare Capitulation Signal, I explored three historical precedents that could serve as analogs for the oversold condition we just witnessed. Given Trump's tariff shift, which seems to remove the risk of a recession, the 2015 scenario remains the most probable.
The eventual outcome, a higher or lower trend resolution, will depend on the economic backdrop in the months ahead.
What the research tells us...
The S&P 500 experienced one of the most remarkable rallies in the last century, with the index surging by an unprecedented amount, capturing the market's attention. Daily breadth on the NYSE exchange was equally impressive, where advancers outnumbered declining issues by a staggering 15 to 1. Although counterintuitive, when price momentum and breadth reach these extremes, as seen on Wednesday, it signals a potential red flag. Historically, such instances tend to occur in bear markets, with returns and consistency across short, medium, and long-term horizons exhibiting an unfavorable outlook.
That said, I suspect that the previous oversold condition, marked by extreme fear and a substantial reduction in market exposure by traders, sets up a scenario where traders can use the recent lows to position on the long side for tactical trading opportunities within a broad range.