Products
SentimenTrader Trading Tools
‍
Backtest Engine
My Trading Toolkit
Correlation Analysis
Seasonality
Market Prediction
Indicators & Data API
‍
Proprietary Indicators & Charts
Market Data API
Strategies & Scanner
‍
50+ Trading Strategies
Smart Stock Scanner
Smart Option Scanner
Research Reports
‍
Research Solutions
Reports Library
Free Resources
Simple Backtest Calculator
Simple Seasonality Calculator
The Kelly Criterion Calculator
Sentiment Geo Map
Public Research Reports
Education
Sentiment Indicators
Technical Indicators
Pricing
Company
About
In the News
Testimonials
Client Success Stories
Contact
Log inLoginSign up
< BACK TO ALL REPORTS

A historic plunge in the fear gauge

Dean Christians
2024-11-06
The Volatility Index plunged by one of the most significant amounts in history, triggering a massive gap-up in the S&P 500 to a record high. Similar precedents suggest stocks are going higher.

Key points:

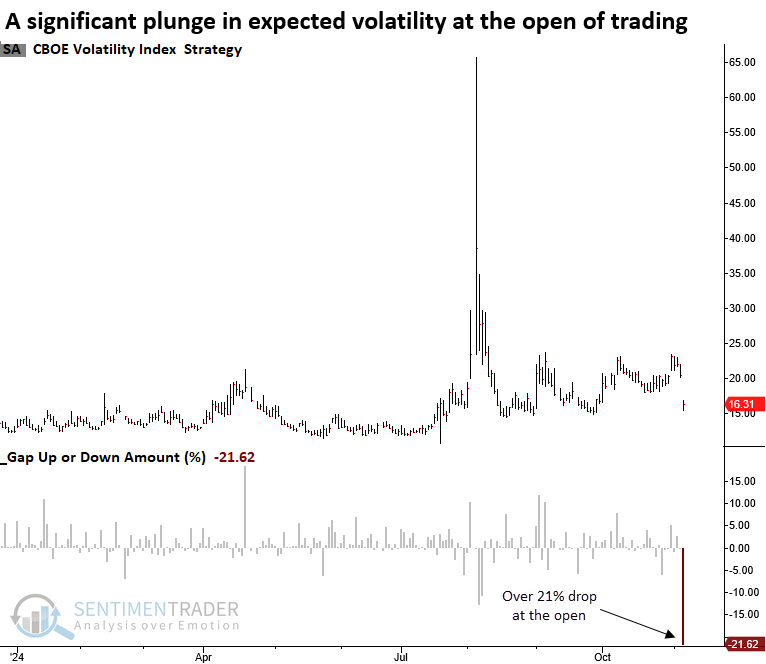
  • The Volatility Index (VIX) plunged by more than 21% to open today's trading session  
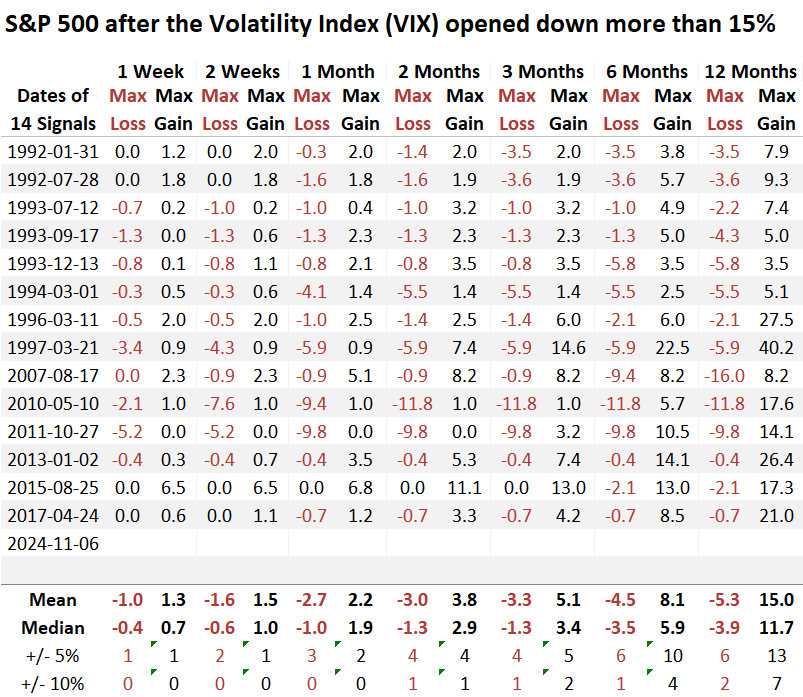
  • Similar contractions in the fear gauge saw the S&P 500 rally 86% of the time over the next three months
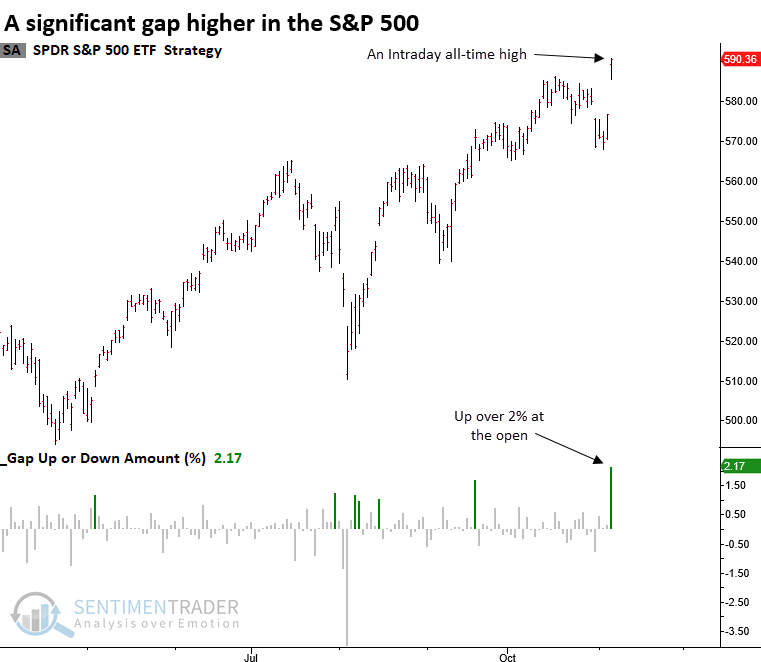
  • The S&P 500 ETF (SPY) opened 2% higher to a new intraday all-time high
  • Comparable gaps tended to see a short-term consolidation, followed by a rally 100% of the time

The fear gauge plummeted as election uncertainty is no longer a concern

My colleague Jay Kaeppel published a research report highlighting the seasonal trend for the Volatility Index in November, particularly during presidential election years. It suggested that volatility should decrease, a scenario that often supports stock performance. 

Following the election's conclusion, the VIX adhered swiftly to its seasonal pattern, dropping over 21% as markets opened on Wednesday-a magnitude of decline seen only four other times since 1992, when intraday data became available. 

To increase the sample size, I lowered the VIX drop from 21% to 15%.

Comparable plunges in volatility preceded a positive outlook for the S&P 500

Whenever the Volatility Index (VIX) opened down 15% or more from the previous day's close, the S&P 500 showed a solid tendency to rally, advancing 86% of the time over the subsequent three and six months. 

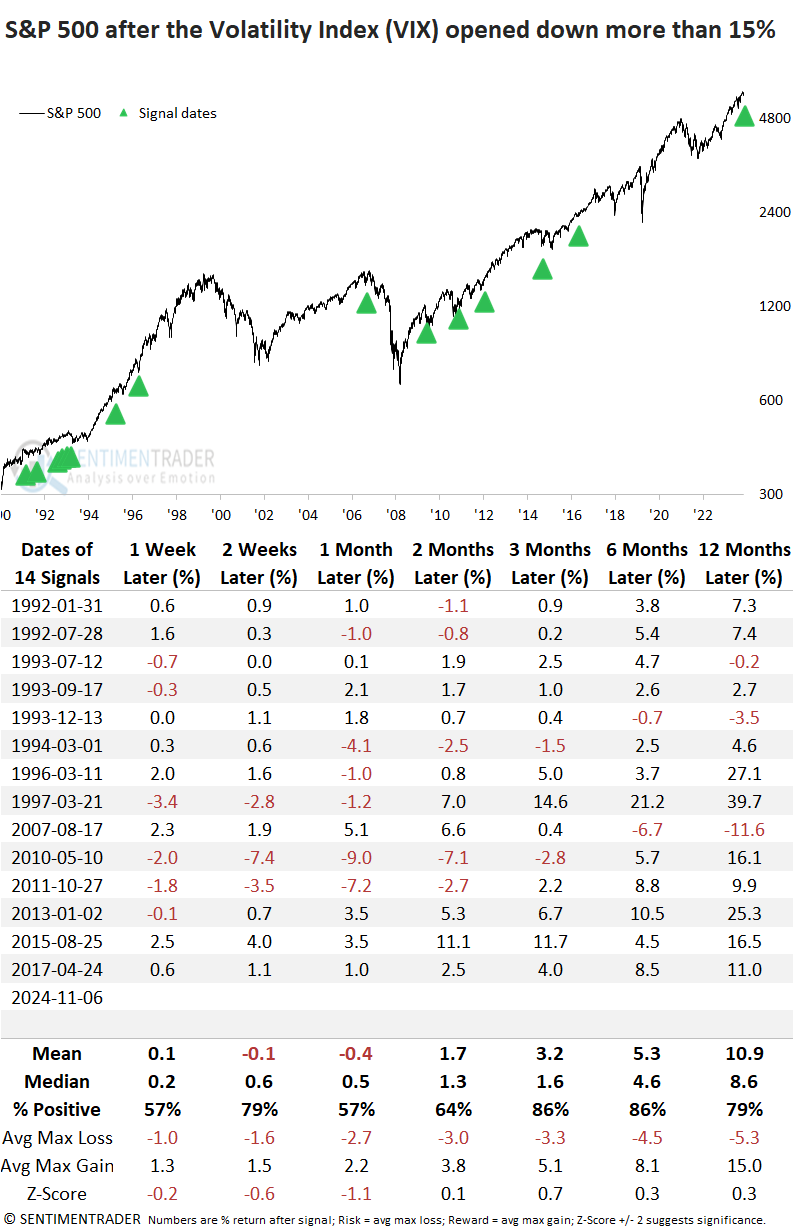
In the ensuing six months, the S&P 500 incurred three maximum losses of around 10%, each linked to events like the GFC, Flash Crash, and the European Debt Crisis-scenarios markedly different from the current backdrop. 

Stocks surge higher following the conclusion of the election

The S&P 500 ETF (SPY) increased by over 2% at the open on Wednesday to a new intraday all-time high. When I scanned the ETF for similar precedents, I found only one other instance since 1993, occurring in November 2020, four days after the previous presidential election.

Similar surges to a high preceded a rally every time

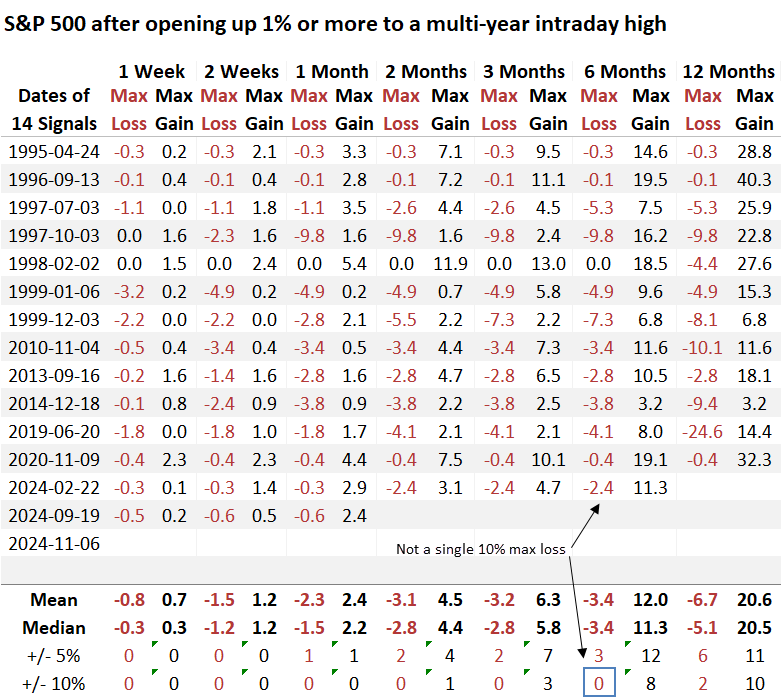
To increase the sample size, I adjusted the gap-up amount from 2% to 1%, which resulted in 14 instances. Although the S&P 500 struggled over the next two weeks, potentially indicating buyer fatigue, it achieved gains without exception over the subsequent six months.

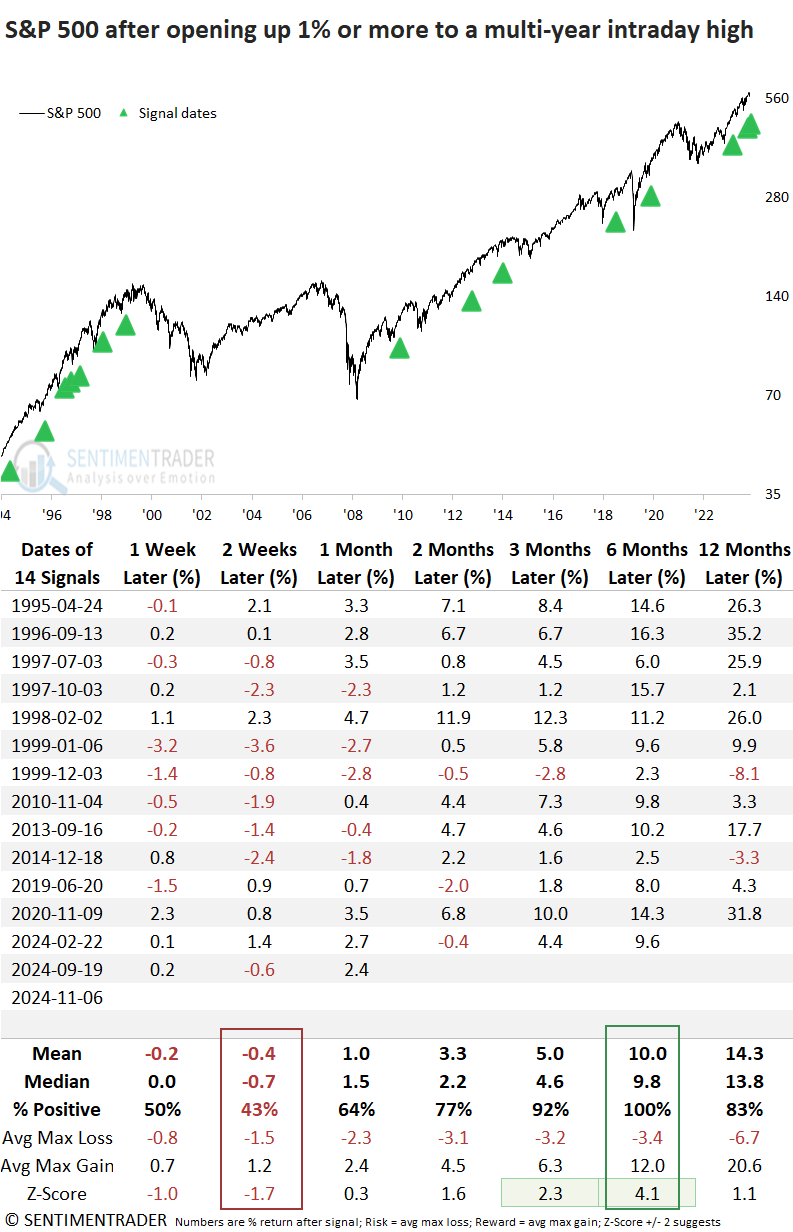
In the following six months, just three occurrences experienced a maximum loss of over 5%, with none surpassing 10%. 

What the research tells us...

Following Tuesday's election conclusion, the Volatility Index (VIX) experienced a sharp plunge, signaling a shift towards a lower volatility regime, which tends to benefit stocks. Investors, relieved from the uncertainty of the election cycle, bought stocks, driving the S&P 500 up over 2% at the open to an intraday record high. Similar precedents resulted in a 100% win rate for the S&P 500 over the next six months, which dovetails nicely with the favorable seasonal period for stocks. The year-end performance chase could get interesting.

PRODUCTS
SentimenTrader
Trading Tools
Indicators & Data API
‍
Strategies & Scanner
‍
Research Reports
FREE
RESOUrCES
Simple Backtest
Calculator
Simple Seasonality
Calculator
The Kelly Criterion
Calculator
Sentiment Geo Map
‍
Public Research Reports
‍
Education
Sentiment Indicators
‍
Technical Indicators
‍
Pricing
Bundle pricing
‍
FAQ
‍
Announcements
‍
COMPANY
‍
About
‍
In the News
‍
Testimonials
‍
Client Success Stories
CONTACT
‍
General Inquiries
‍
Media Inquiries
‍
Financial Professionals Inquiries
‍
© 2026 Sundial Capital Research Inc. All rights reserved.
Setsail Marketing
TermsPrivacyAffiliate Program
Risk Disclosure: The information and tools provided are for research and analytical purposes only and are not intended as investment advice. Market analysis involves uncertainty, and outcomes may differ from expectations. Users should conduct their own due diligence and consider their individual circumstances before making any financial decisions. Past performance is not necessarily indicative of future results.

Hypothetical Performance Disclosure: Hypothetical performance results have many inherent limitations, some of which are described below. No representation is being made that any account will or is likely to achieve profits or losses similar to those shown; in fact, there are frequently sharp differences between hypothetical performance results and the actual results subsequently achieved by any particular trading program. One of the limitations of hypothetical performance results is that they are generally prepared with the benefit of hindsight. In addition, hypothetical trading does not involve financial risk, and no hypothetical trading record can completely account for the impact of financial risk of actual trading. for example, the ability to withstand losses or to adhere to a particular trading program in spite of trading losses are material points which can also adversely affect actual trading results. There are numerous other factors related to the markets in general or to the implementation of any specific trading program which cannot be fully accounted for in the preparation of hypothetical performance results and all which can adversely affect trading results.

Testimonial Disclosure: Testimonials appearing on this website may not be representative of other clients or customers and is not a guarantee of future performance or success.