
A historic oversold condition in Technology stocks

Key points:
- Technology stocks reaching an oversold status increased to one of the highest levels in history
- Similar oversold conditions suggest the sector could be in the penalty box over the next month
- The selling pressure in Technology contributed to a substantial relative trend score change
- Similar relative trend shifts preceded negative returns and relative underperformance versus the S&P 500
The largest sector by market capitalization flashes some caution signs
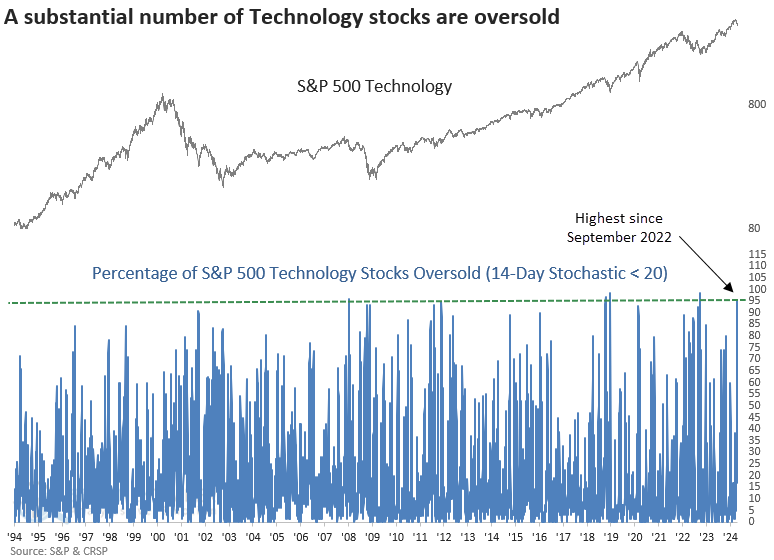
Technology stocks have experienced severe selling pressure over the last week, pushing an indicator that measures oversold conditions to one of the most profound levels in 70 years.
On Friday, the proportion of S&P 500 Technology stocks hitting oversold levels, as indicated by their 14-day stochastic readings dropping below 20, surged past 95%, a phenomenon observed merely 17 times since 1953.
The sector's significant downturn led to one of the most dramatic week-over-week shifts in a composite that measures relative trends between Technology and the S&P 500.
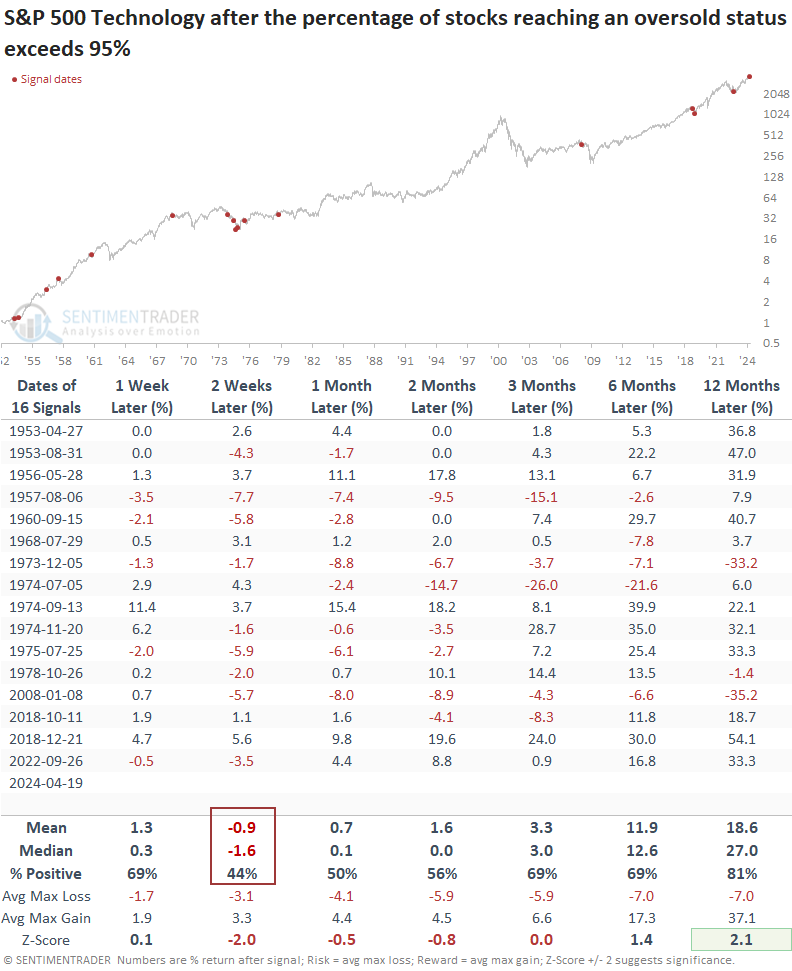
When the percentage of S&P 500 Technology stocks reaching an oversold status exceeds 95%, the sector tended to bounce back over the subsequent week. However, it was most likely a countertrend move in a corrective phase, as indicated by the negative outlook over the two-week horizon.
Twelve months later, the sector saw gains 81% of the time, though it wasn't entirely immune to significant risks.
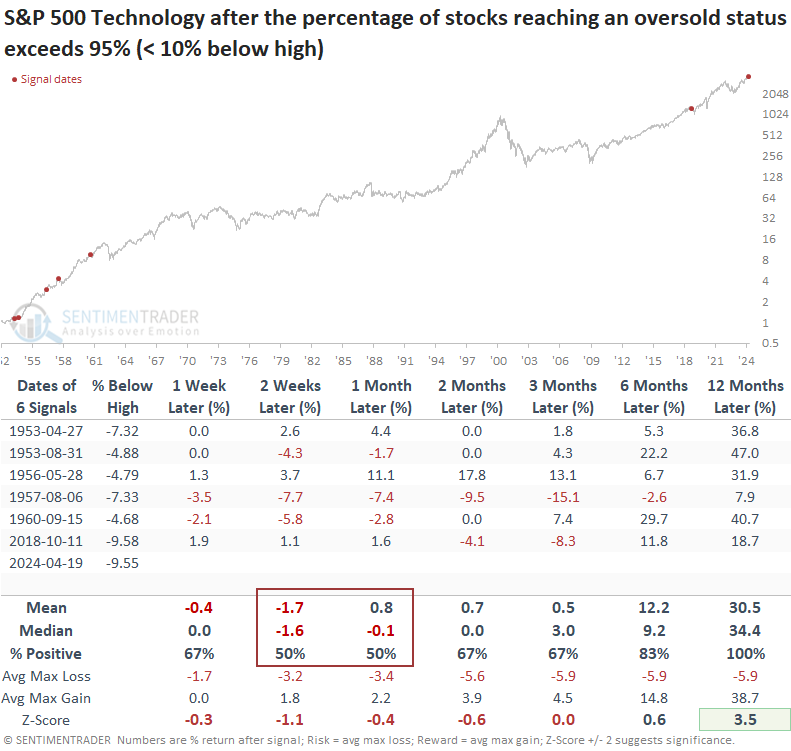
Following precedents occurring within 10% of a high, like now, we see a stagnant outlook over the ensuing month. A year later, the sector was higher every time, albeit with a small sample size, comprised mainly of older instances.
Relative trends versus the S&P 500
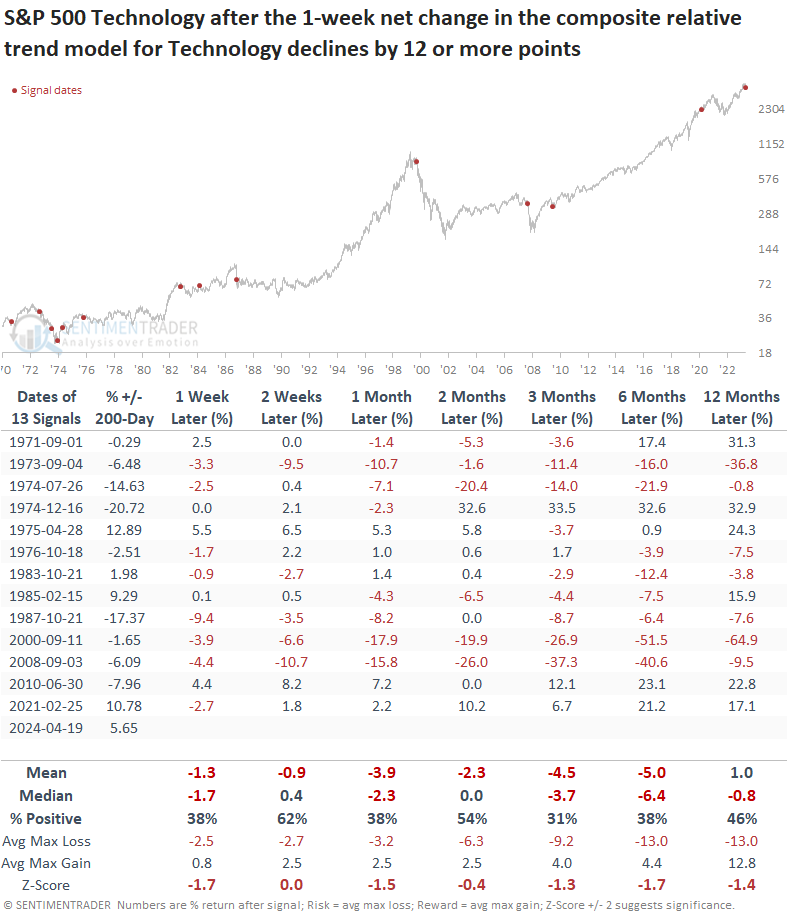
The significant downside price action in the S&P 500 Technology sector triggered one of the most severe shifts in history for a composite model that measures relative trends.
For only the 14th time since 1971, a Composite Relative Trend Model score declined by 12 points over one week.
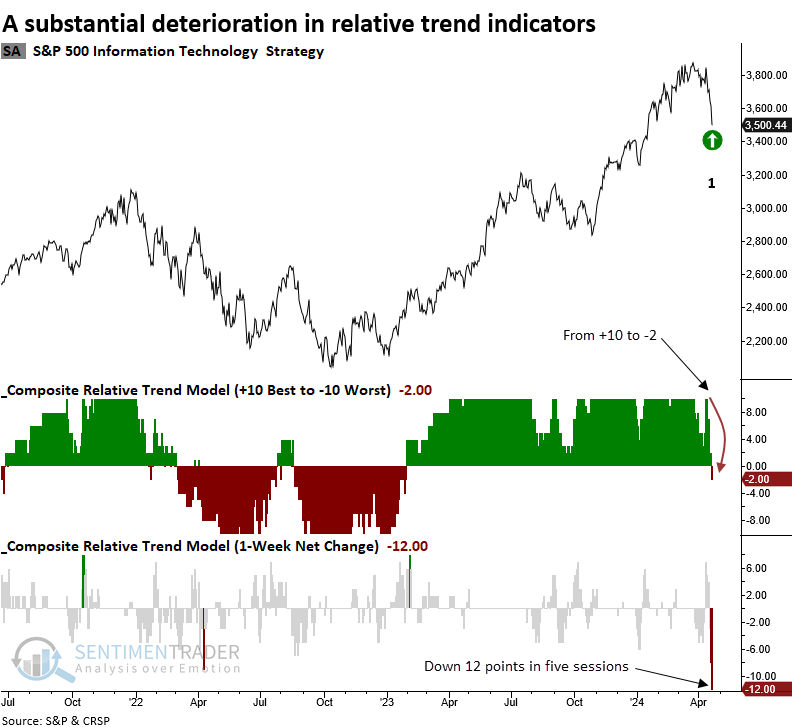
The Composite Relative Trend Model incorporates ten trend-following indicators to assess medium to long-term relative trends.
Similar relative trend score shifts preceded negative returns
A substantial relative trend score change like the one triggered on Friday has produced mostly negative returns for the S&P 500 Technology sector.
Even If I isolate precedents with the index trading above its 200-day average, three out of four instances were negative over the subsequent three months. The lone positive, 2021, occurred during the FOMC's massive QE program, which is not the case now.
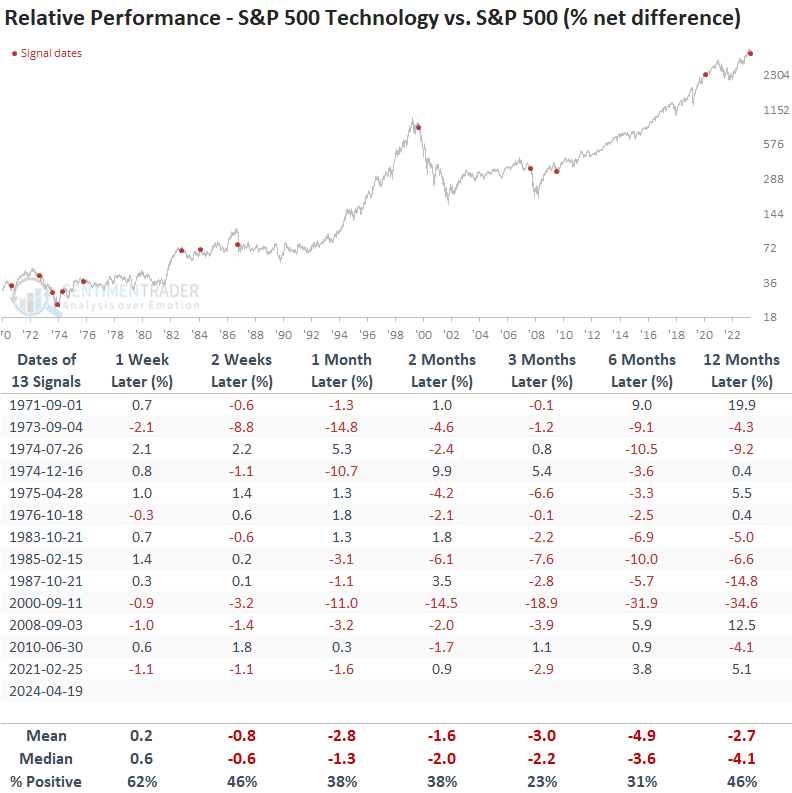
Similar shifts suggest Technology could be a relative underperformer
Over the ensuing week, Technology demonstrated a propensity to outperform the S&P 500. However, in the subsequent two weeks to twelve months, it lagged behind the world's most benchmarked index.
In cases where a signal occurred with Technology above its 200-day average, the sector underperformed the S&P 500 every time over the following three months.
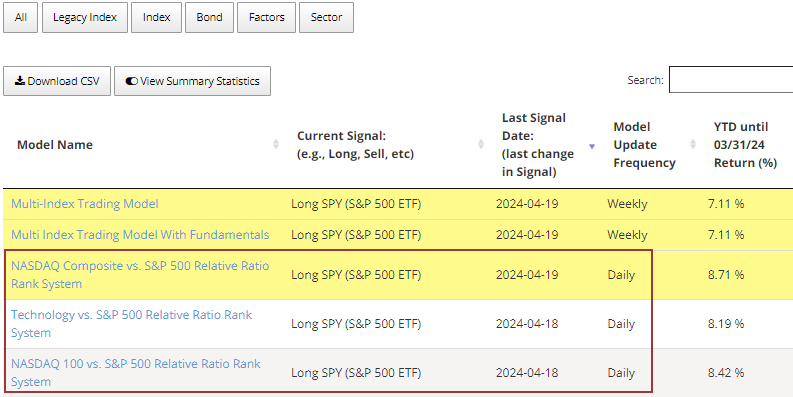
Strategies rotate out of Technology-oriented ETFs
Last week, the relative strength timing models featured on the website's strategies page liquidated their positions in technology-oriented ETFs. They will maintain a position in the S&P 500 ETF (SPY) as a placeholder until relative trends return to favorable conditions.
What the research tells us...
The S&P 500 Technology sector has come under significant pressure, possibly due to a delayed response to the surge in Treasury yields. This realization that rates may be higher for longer invoked memories of 2022, prompting investors to resort to a sell-first, question-later mentality. The adverse price action in the sector suggests investors should maintain a cautious near-term outlook for the group and acknowledge that the seismic relative trend shift could signal a more pronounced period of relative underperformance.