
A historic losing streak for value as it plunges relative to growth

Key points:
- The ratio of value to growth stocks has plunged to a two-decade low as value stocks suffer a historic losing streak
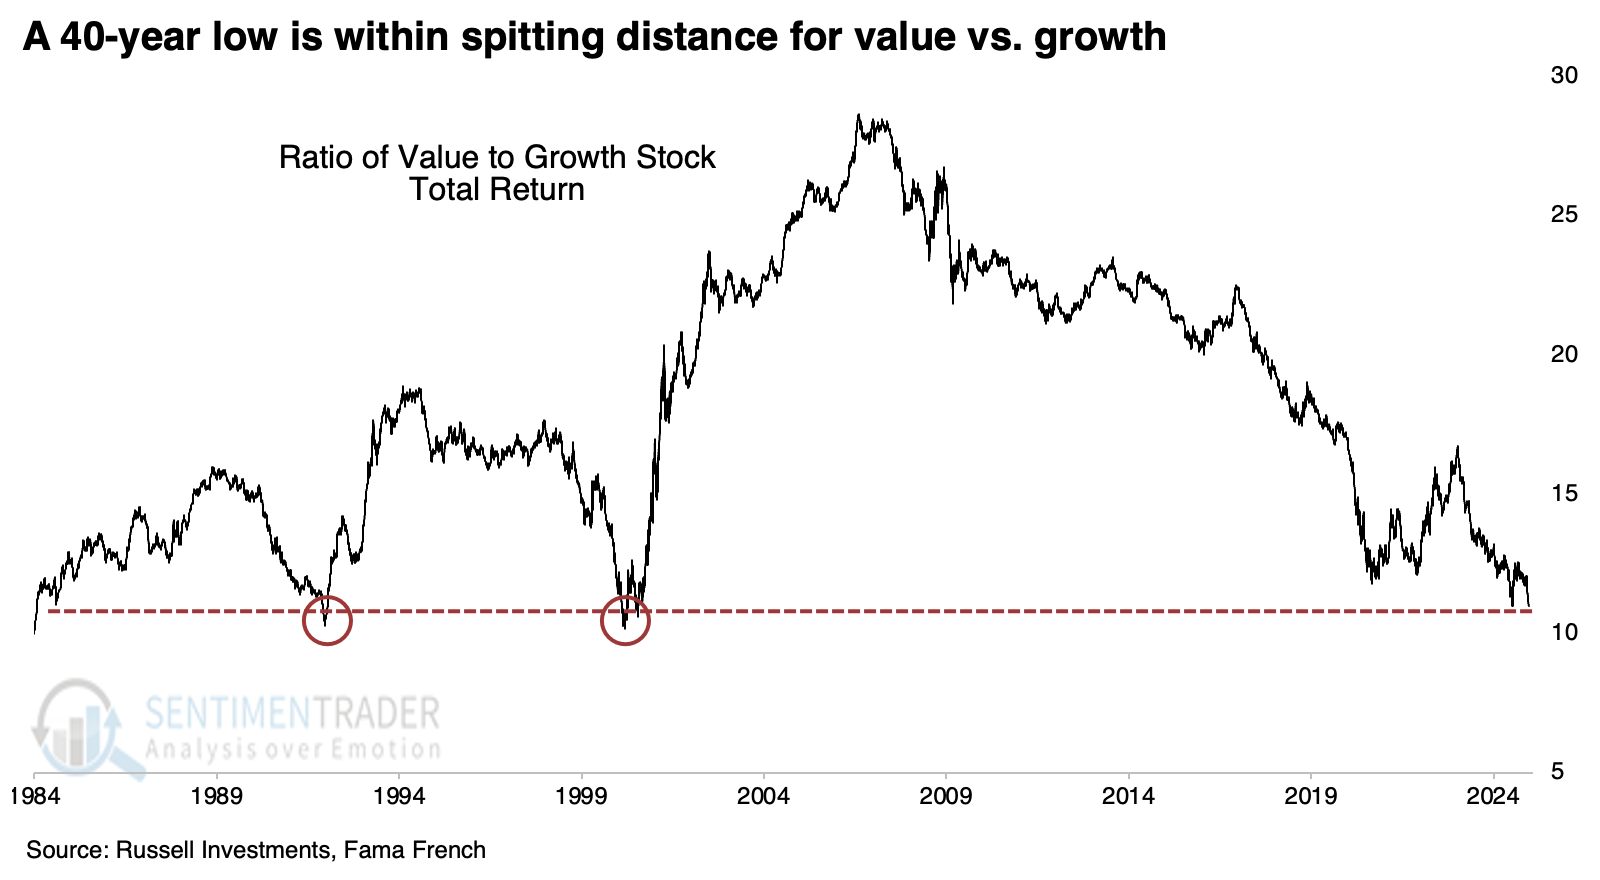
- With another few poor sessions, the ratio between those factors could plunge to a 40-year low
- After similar sudden shifts to an extreme, value stocks have tended to rebound - but only long-term, and only since 1950
Value hasn't been very valuable
Contrarians have long been waiting for mean reversion to take hold. They've been frustrated by the conflict between small and large stocks and between value and growth stocks.
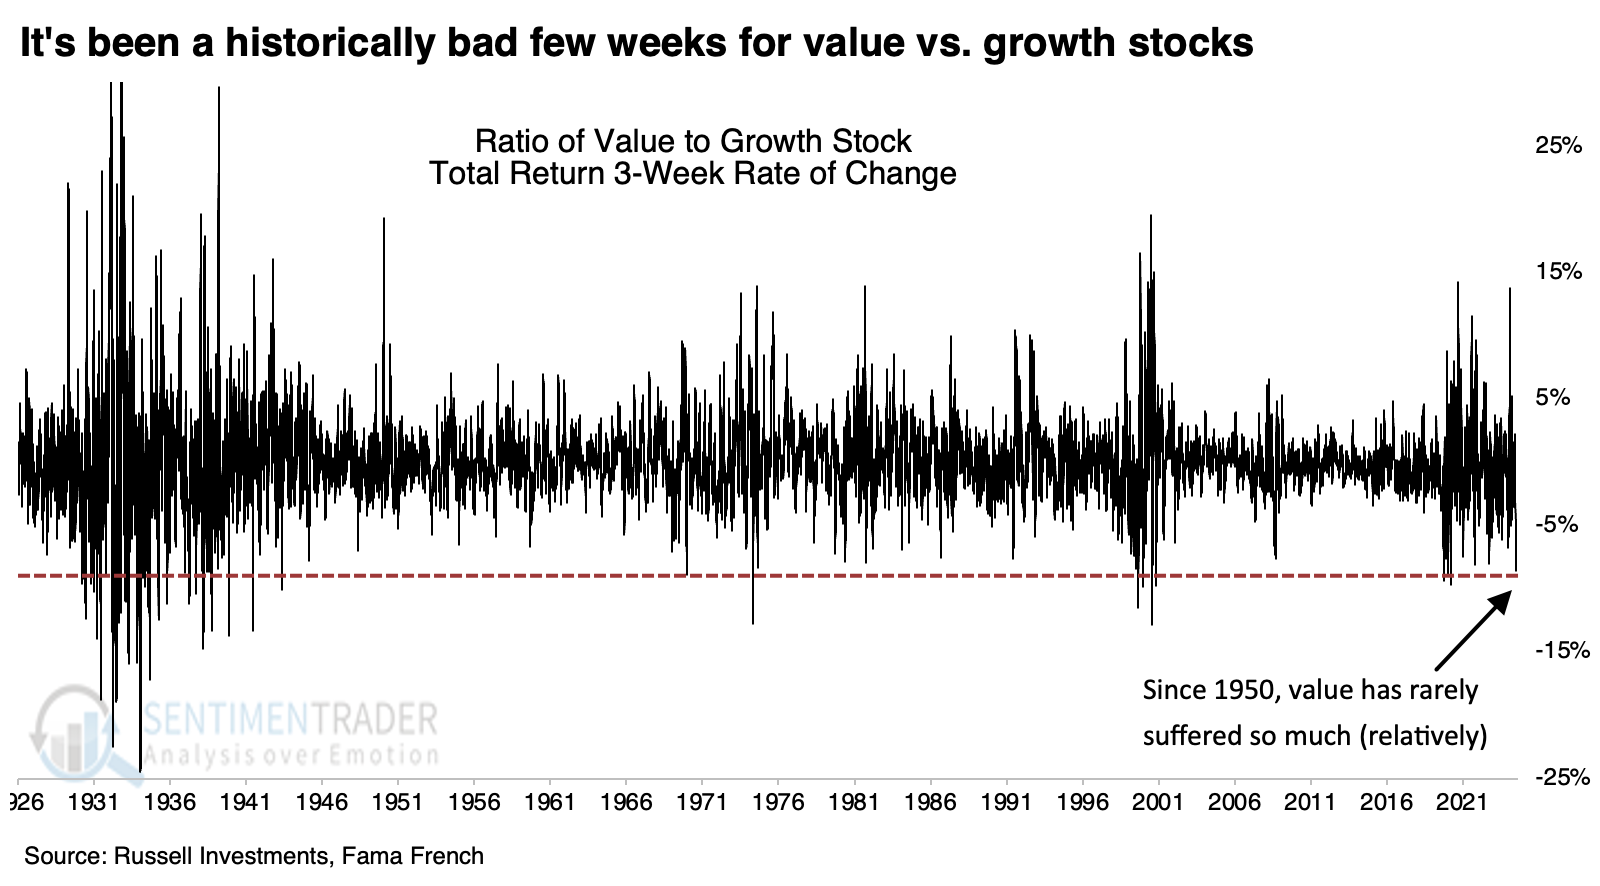
It just keeps getting worse. The past few weeks, particularly the past ten days, have been wickedly bad for value, with investors showing a clear prejudice for growth heading into year-end. Over the past three weeks, value stocks have slid more than 8% relative to growth, one of the worst 3-week stretches since the 1940s.
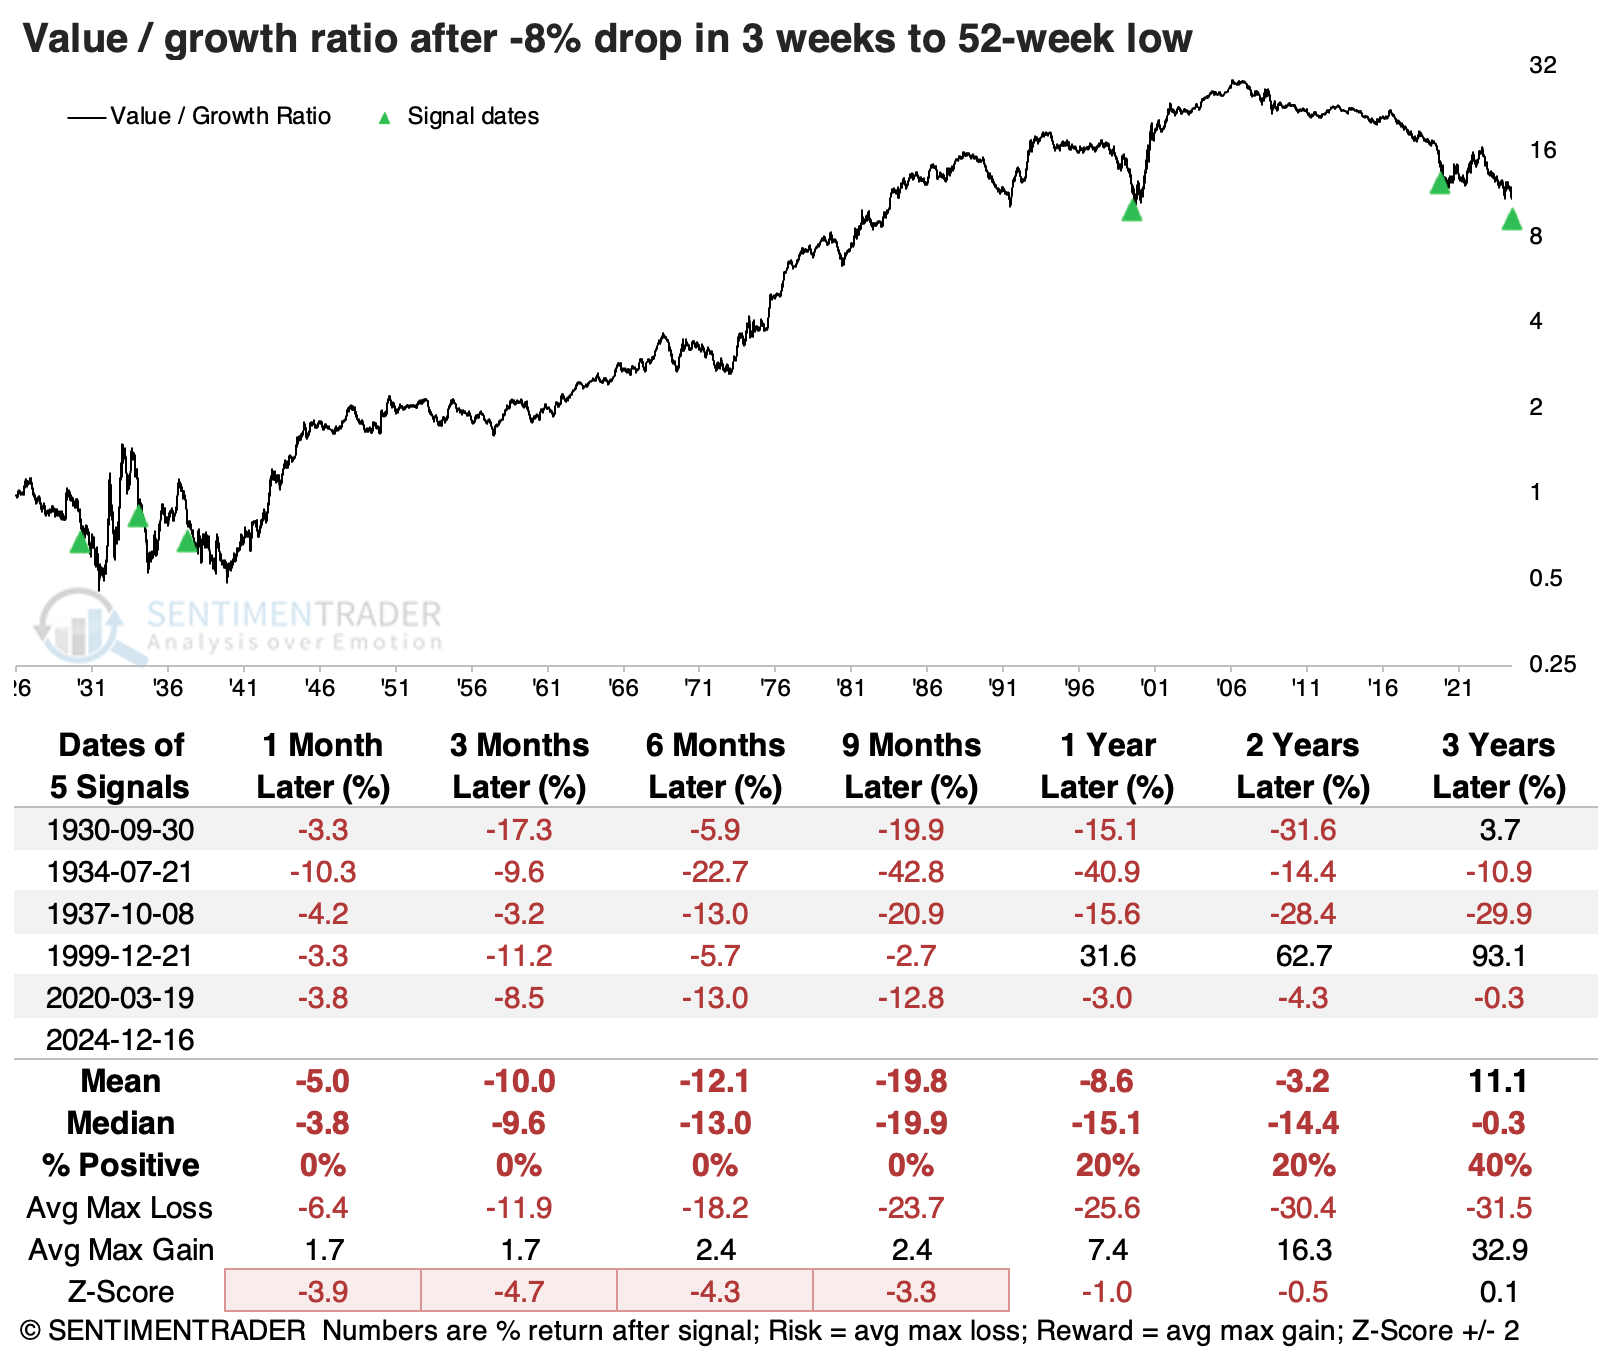
The latest string of losses has pushed the total return ratio between value and growth stocks to a 23-year low. It would only take a few more bad days for value and good ones for growth to send the ratio to its lowest level in more than 40 years.
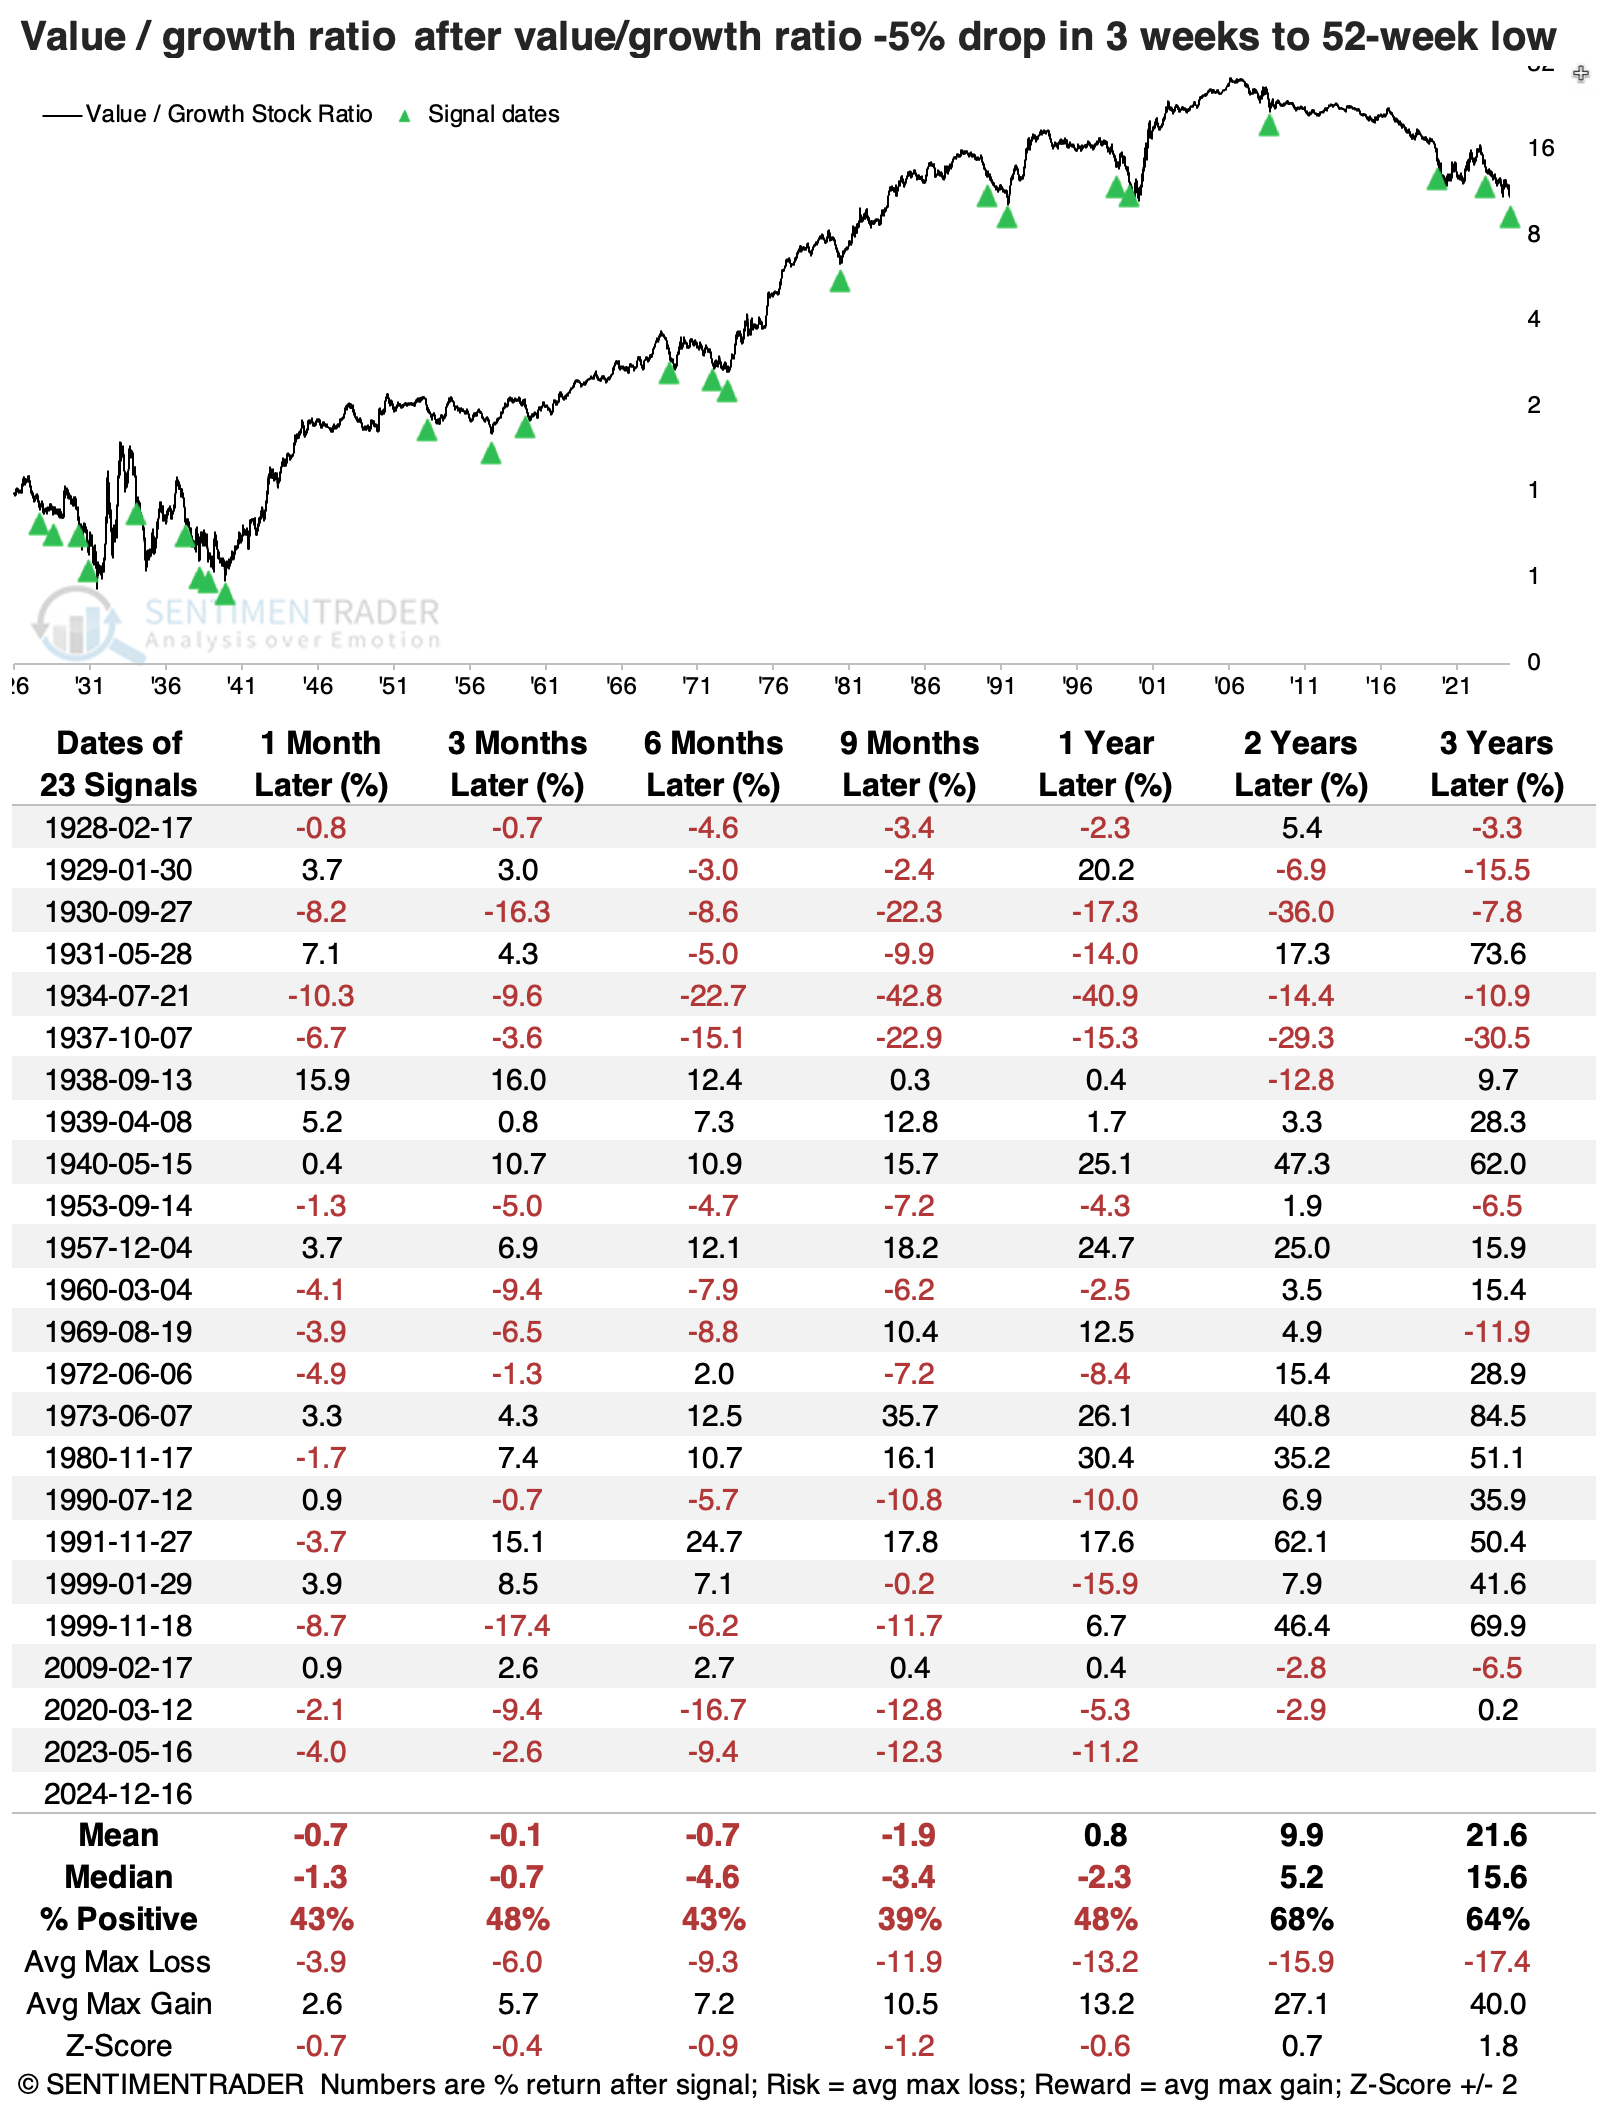
There haven't been many times the ratio slid more than 8% over a few weeks and hit a new one-year low in the process. Just eyeballing the chart, they look like decent opportunities to expect mean reversion.
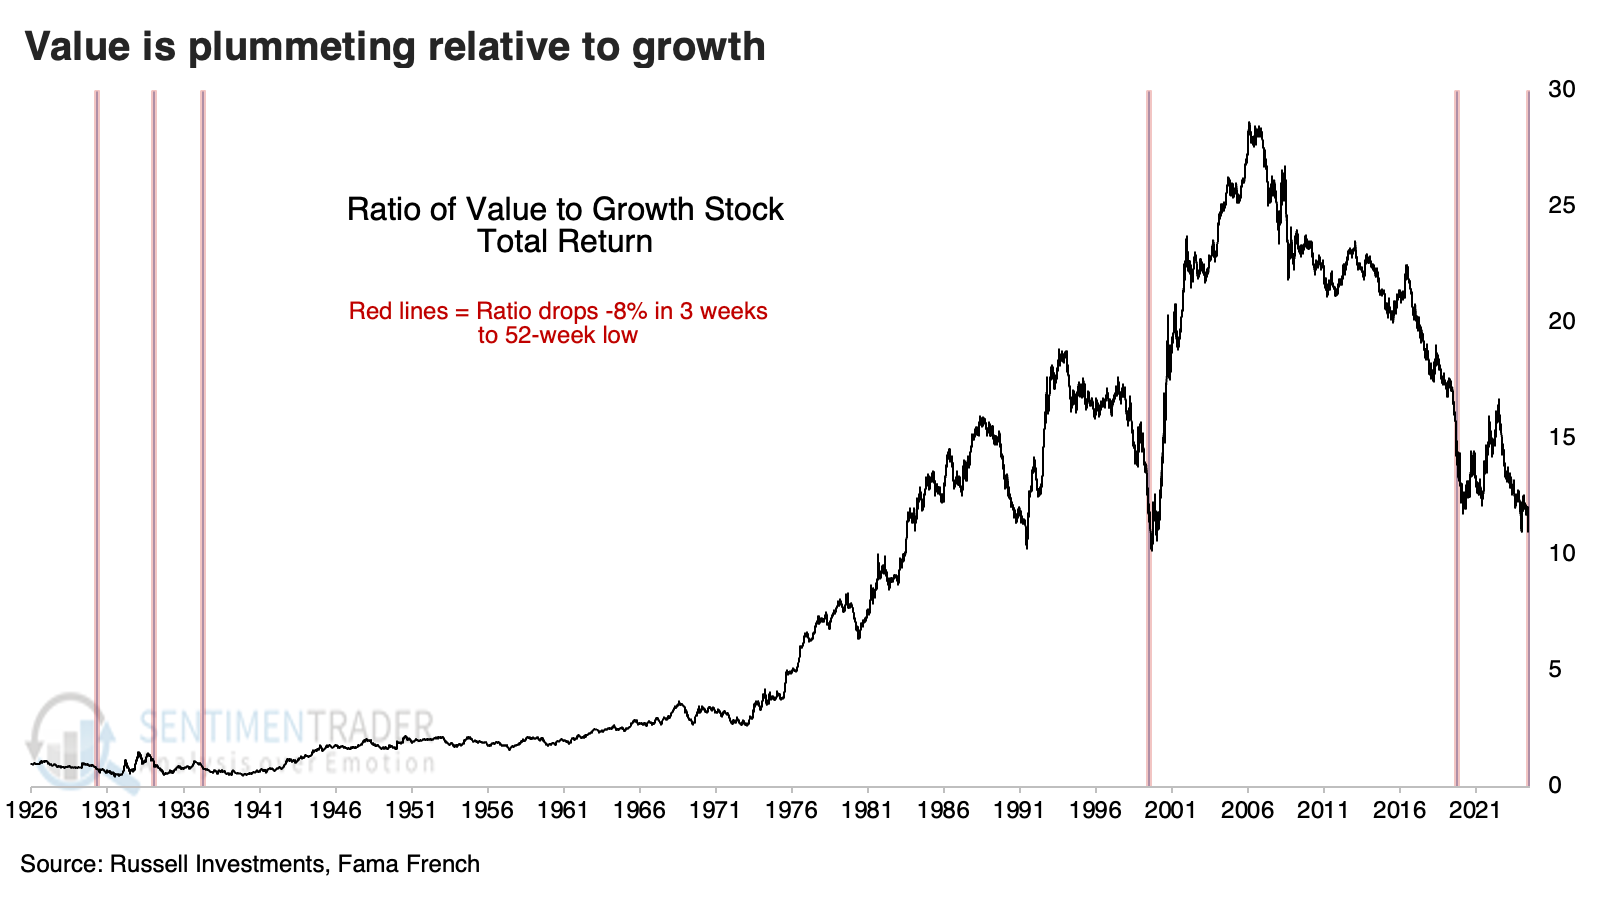
It's easier to see repercussions when using a log scale, and then it doesn't look quite so bullish for mean-reversionists.
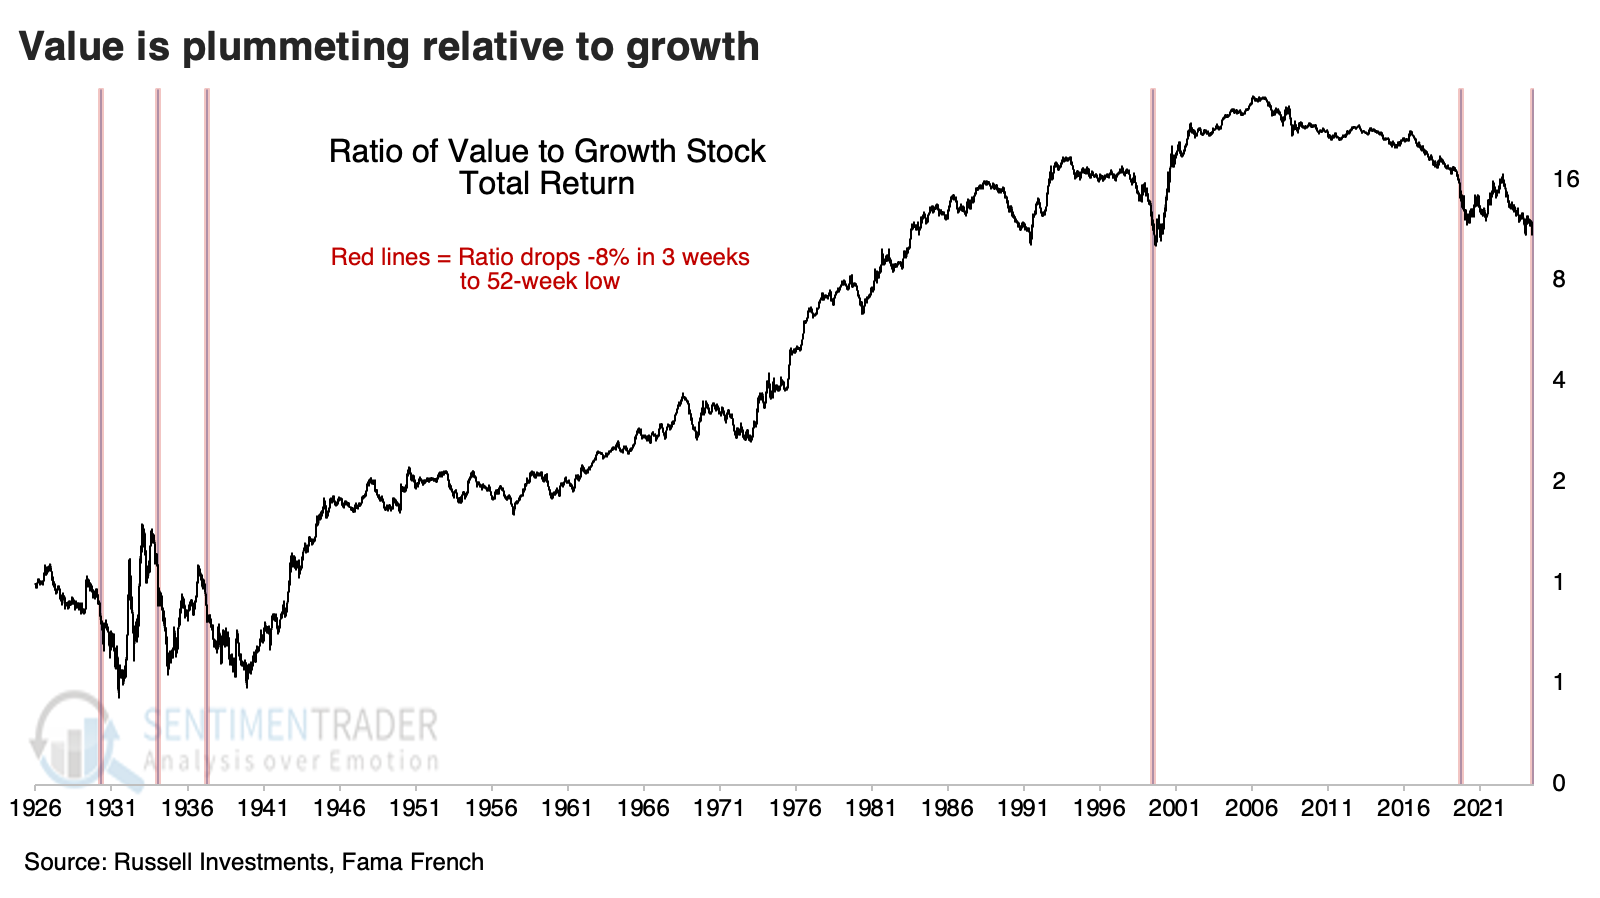
Indeed, the ratio suffered further losses every time up to nine months later. Not one of the (admittedly tiny) precedents marked the low for the ratio - value kept sliding relative to growth for up to nine months.
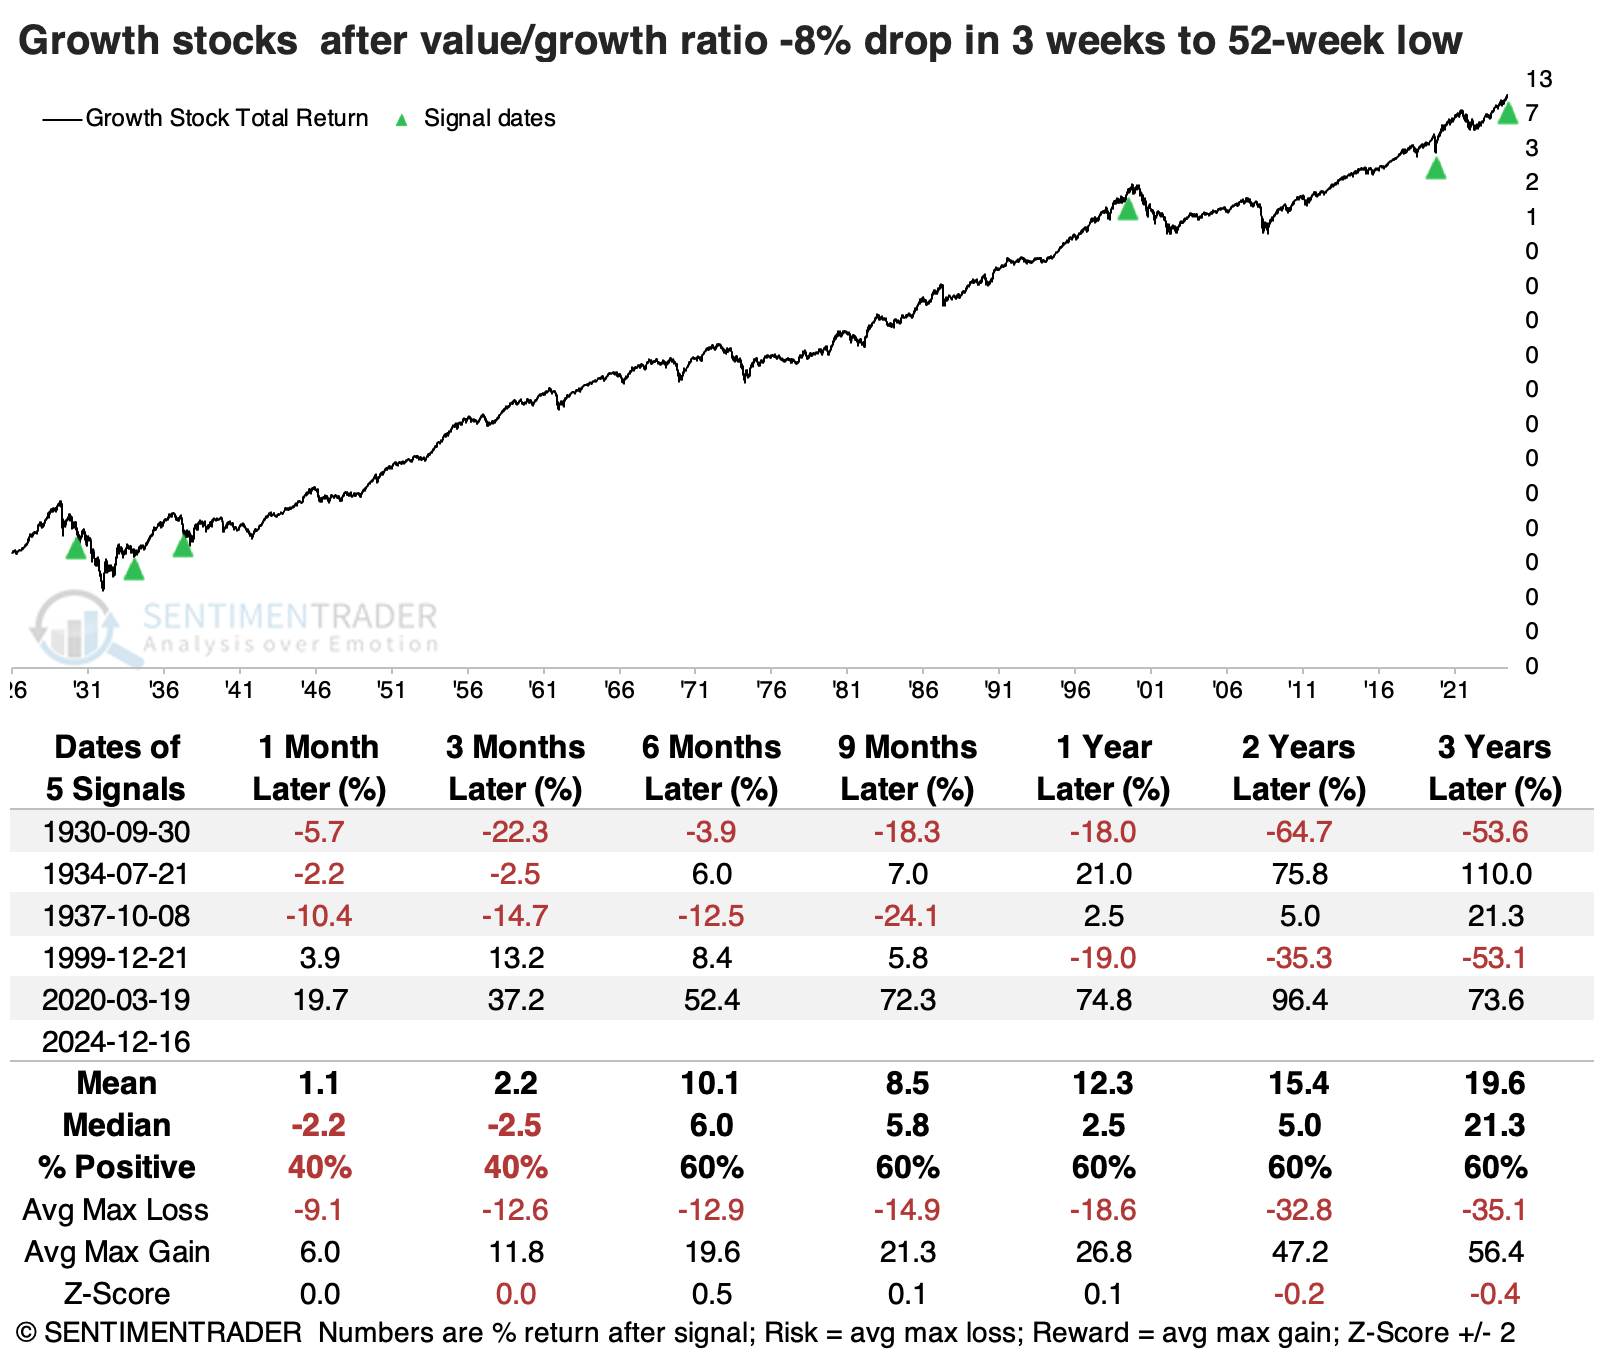
Growth stocks showed mixed returns, with two large gains in total return over the following year and two large losses. Curiously, one of the signals triggered ahead of one of the worst periods for growth stocks (near the peak of the internet bubble) and also one of the best (the pandemic panic).
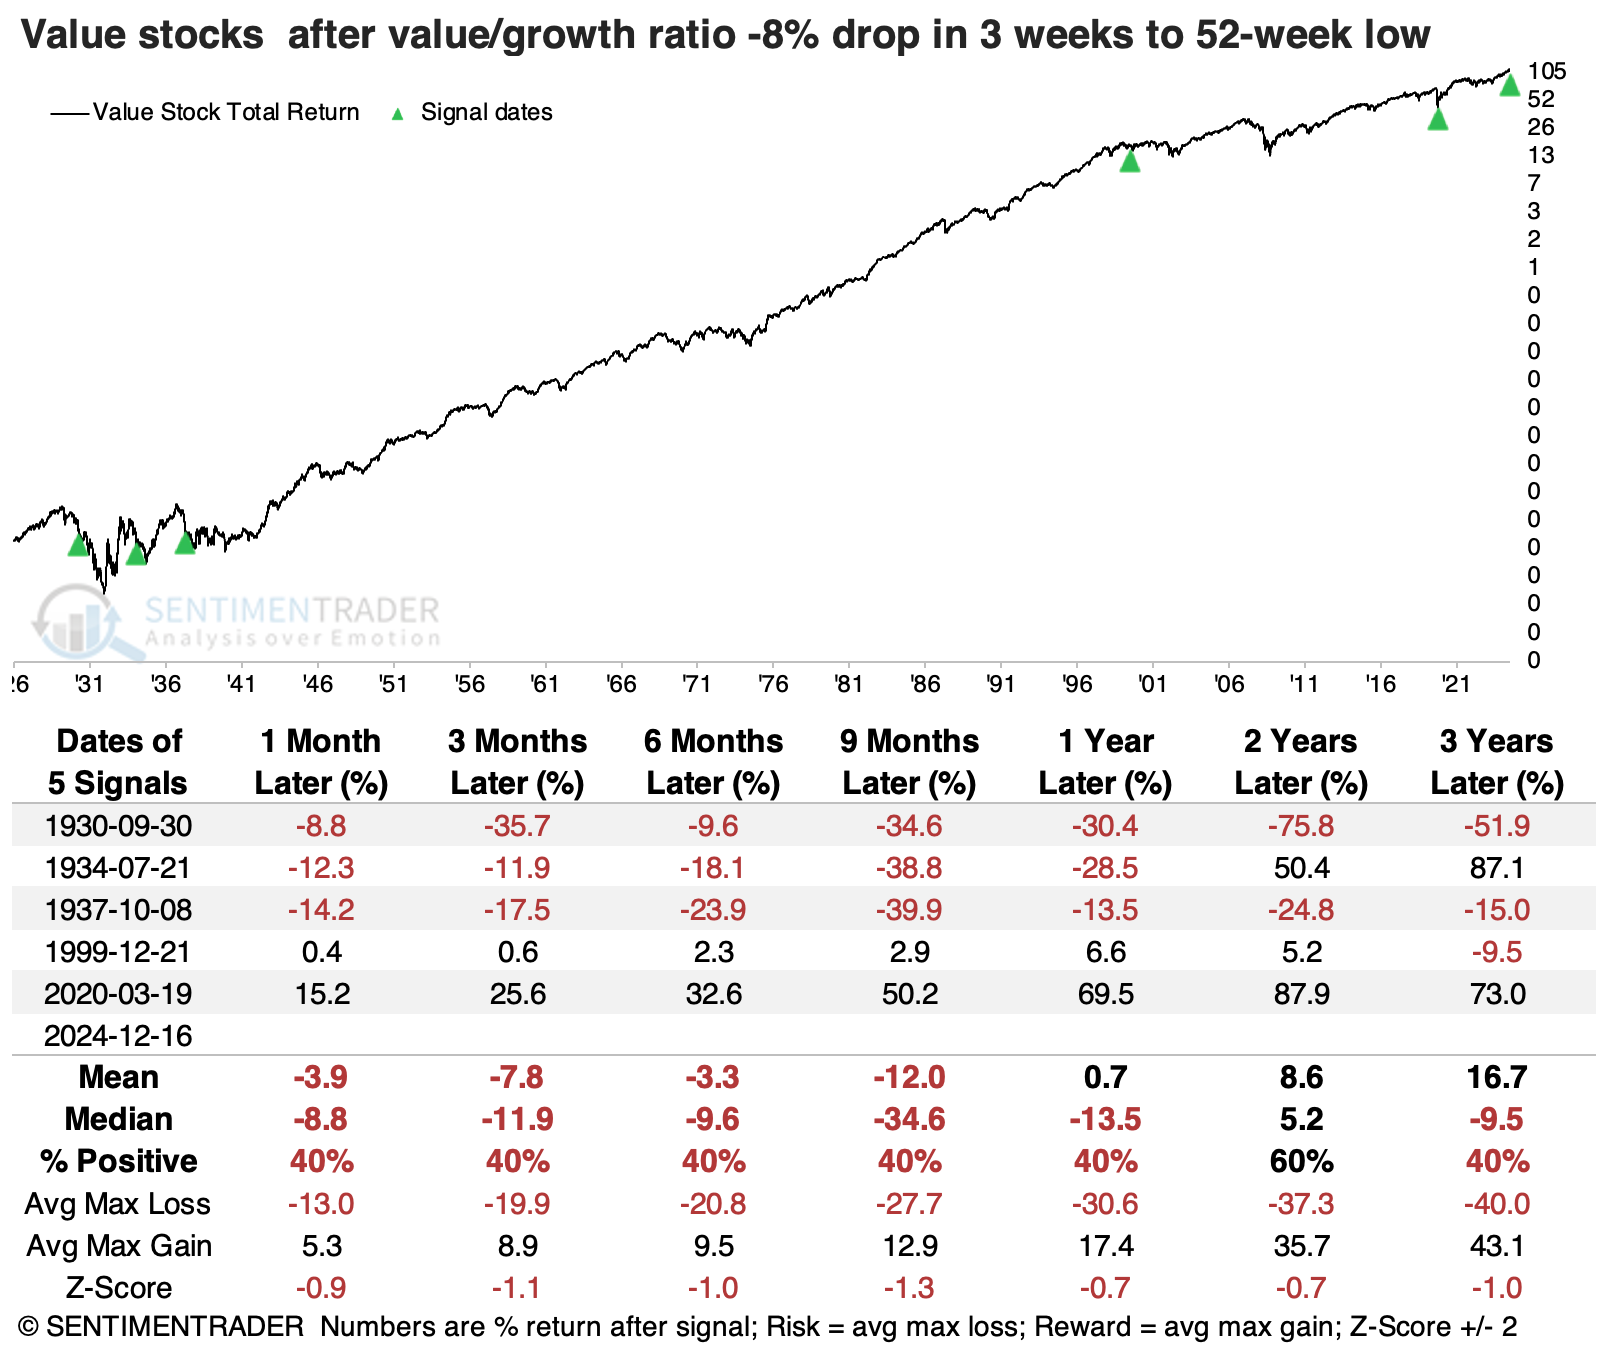
Value stocks suffered more consistently, though the losses were mostly confined to the 1930s. The 1999 signal preceded a modest gain versus horrid losses for growth stocks, a massive win for value. The post-pandemic signal showed smaller gains than growth stocks.
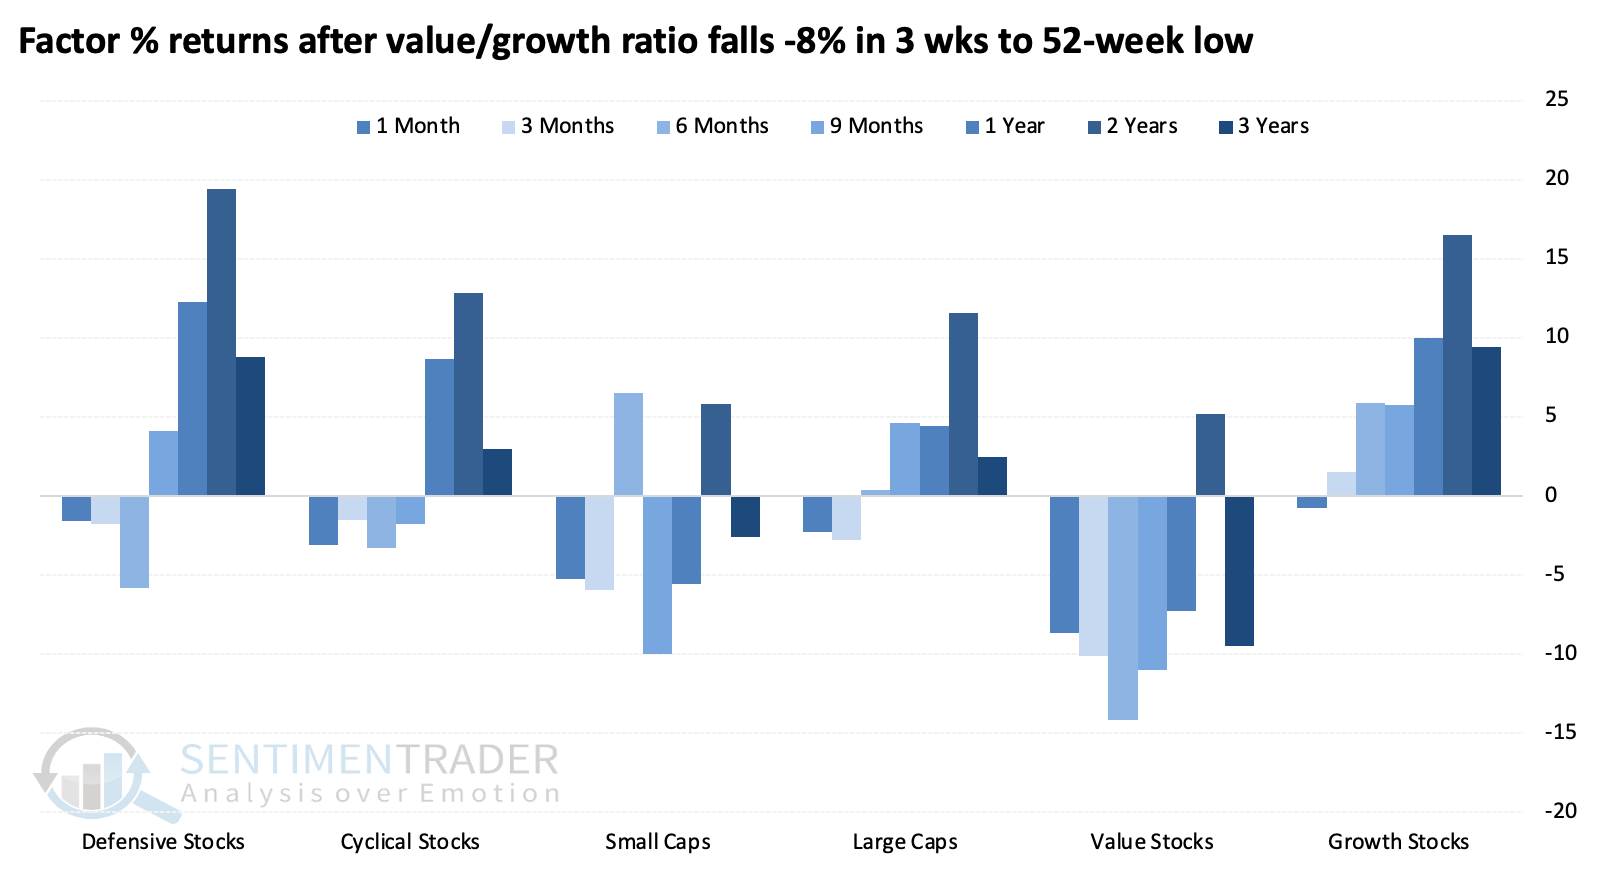
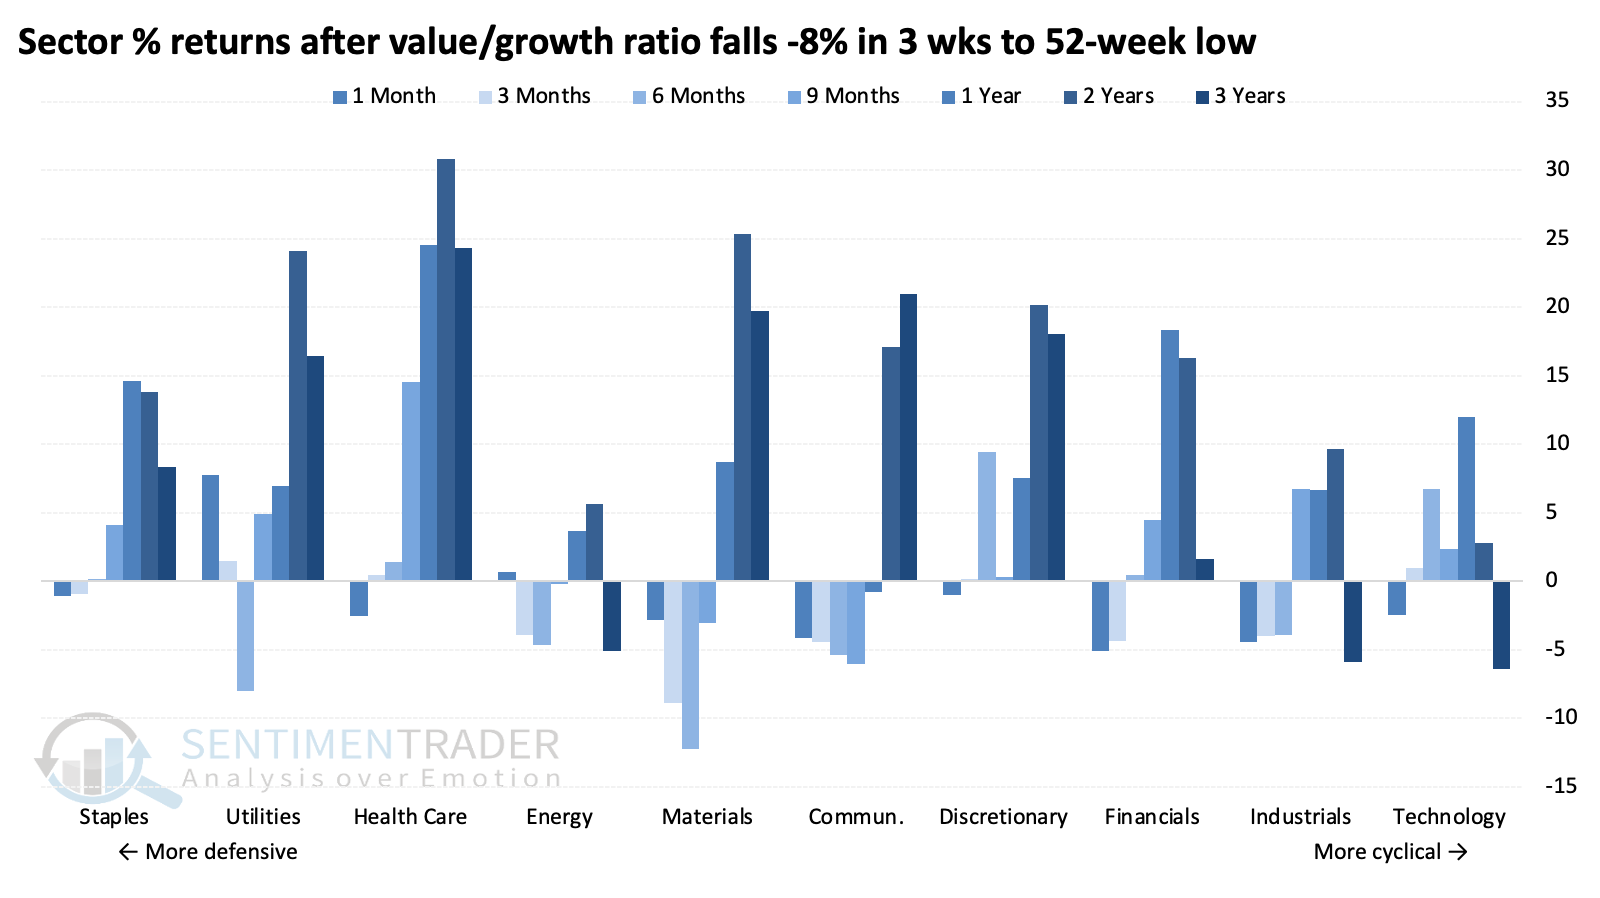
It's odd that defensive and growth stocks showed the best longer-term returns among factors. Much of this is due to the extreme discrepancy following the internet bubble bursting in 2000.
We can see this more granularly in sector returns. Health care stocks enjoyed the largest and most consistent gains, followed by staples and utilities - the most defensive sectors.
Looking at lesser extremes
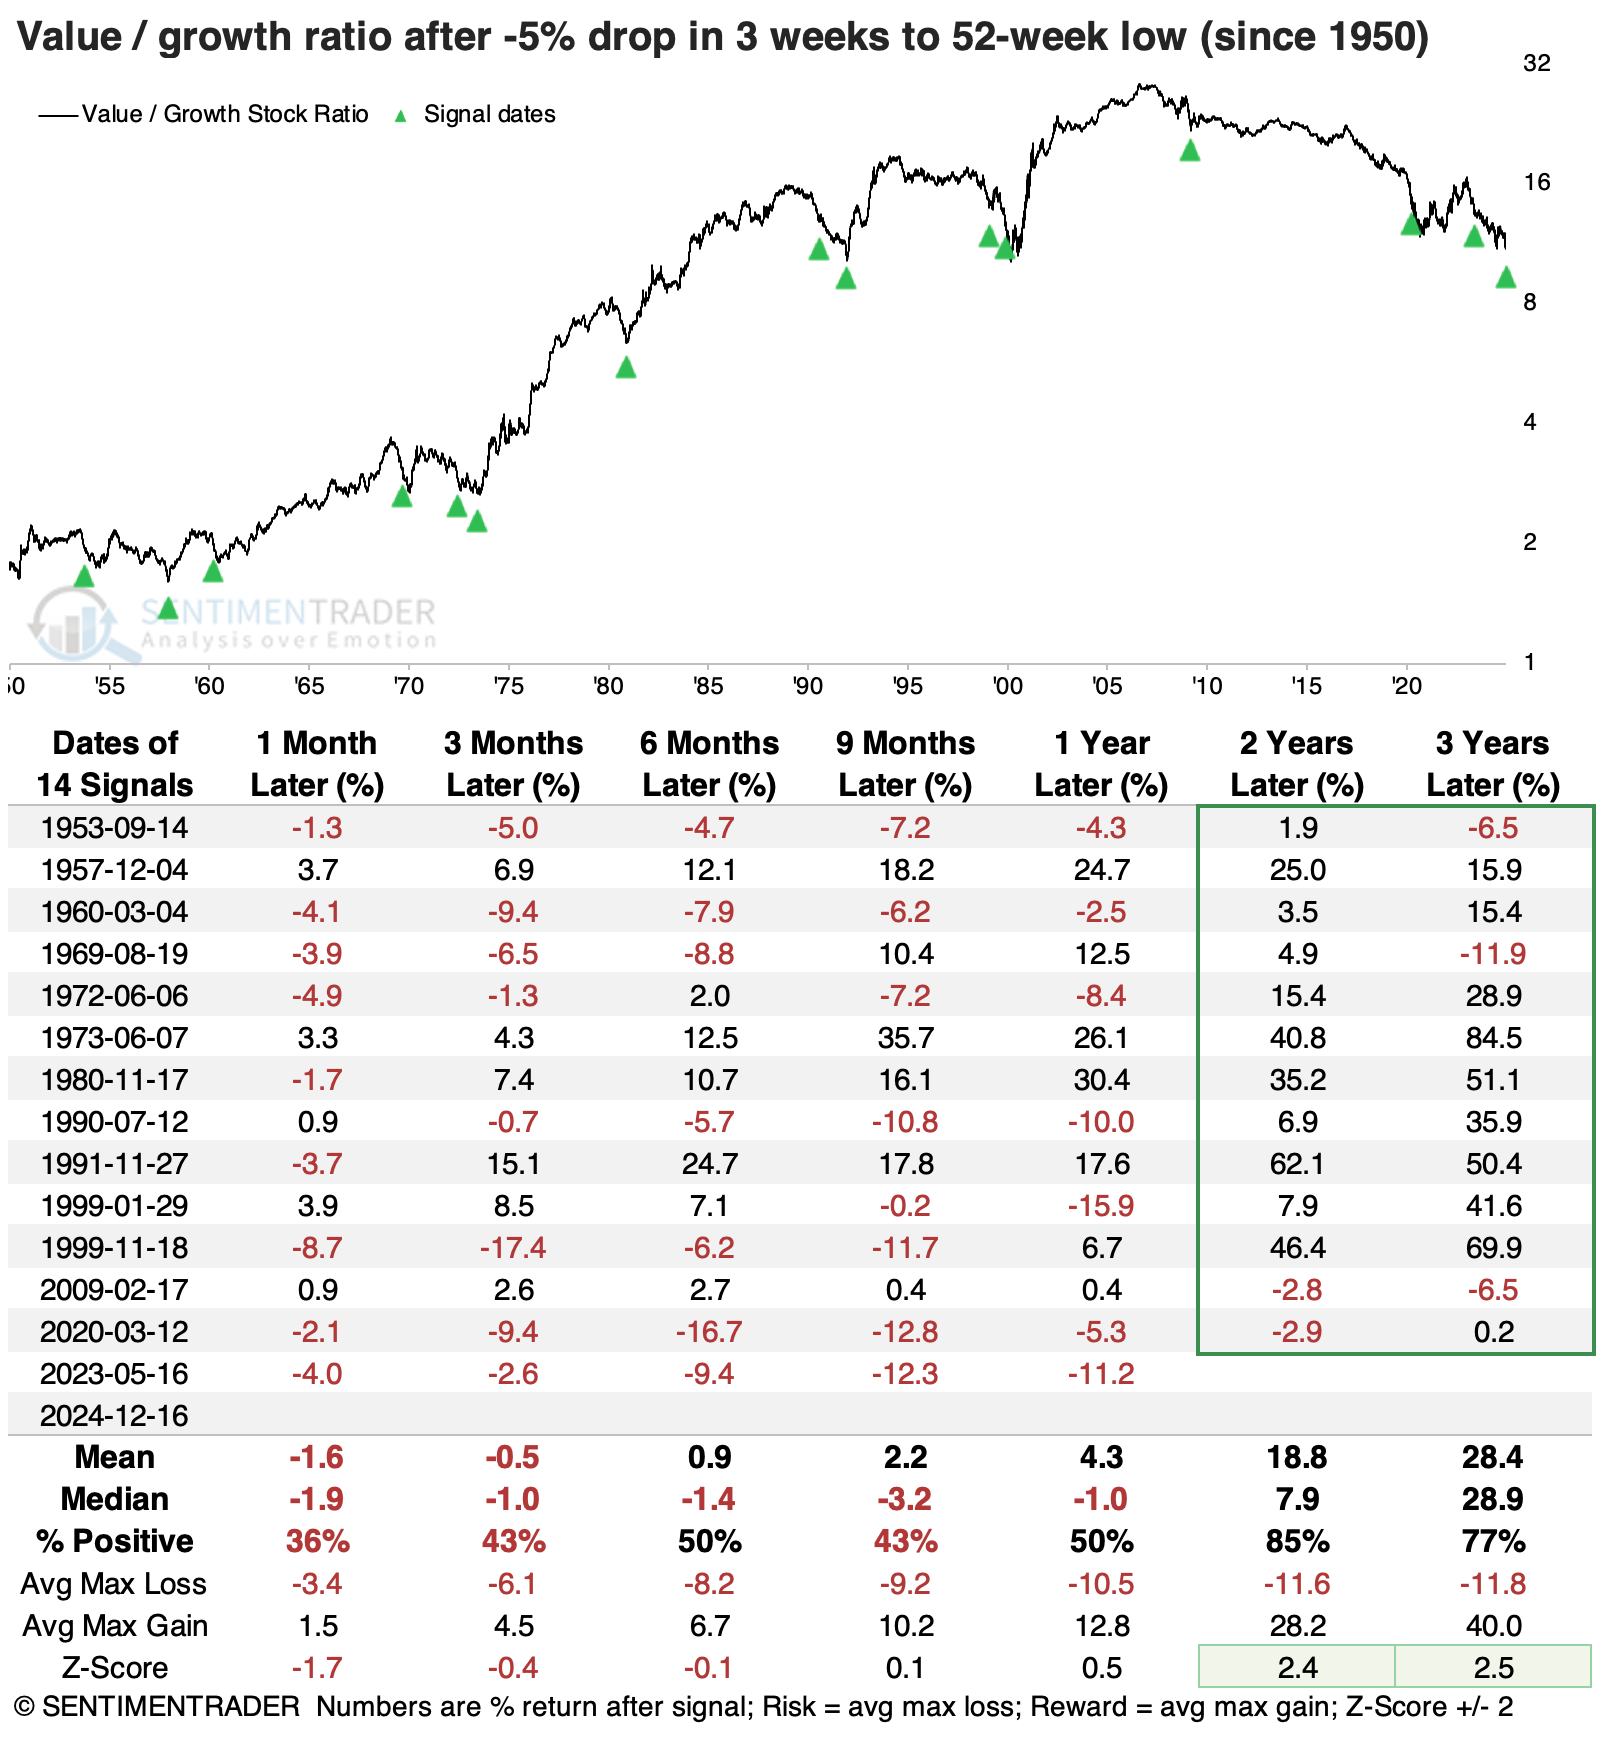
It's tough to read much into such a tiny sample size, especially since only two of the signals were triggered in the past couple of decades. Lowering the three-week decline to -5% (instead of -8%) dramatically increases the number of precedents. Unfortunately, for those looking for mean reversion, value still tended to underperform growth.
However, much of that consternation was caused by the Great Depression. If we only consider signals since the U.S. emerged from that period, the long-term relative returns for value stocks improved significantly. Over the following two to three years, value outperformed growth most of the time, and the few exceptions tended to be minor.
A historic losing streak
Part of the reason why the ratio of value to growth stocks has plunged is that growth stocks are doing well, pumped up by some of the gigantic large caps that portfolio managers want to show on their year-end books.
But the primary reason is that investors have been shunning value stocks to a historic degree. For only the 2nd time since 1926, the total return on value stocks has declined for 12 consecutive sessions. The only longer streak ended at 14 days on October 31, 1978, after which the value factor went on to gain +24.4% over the following year.
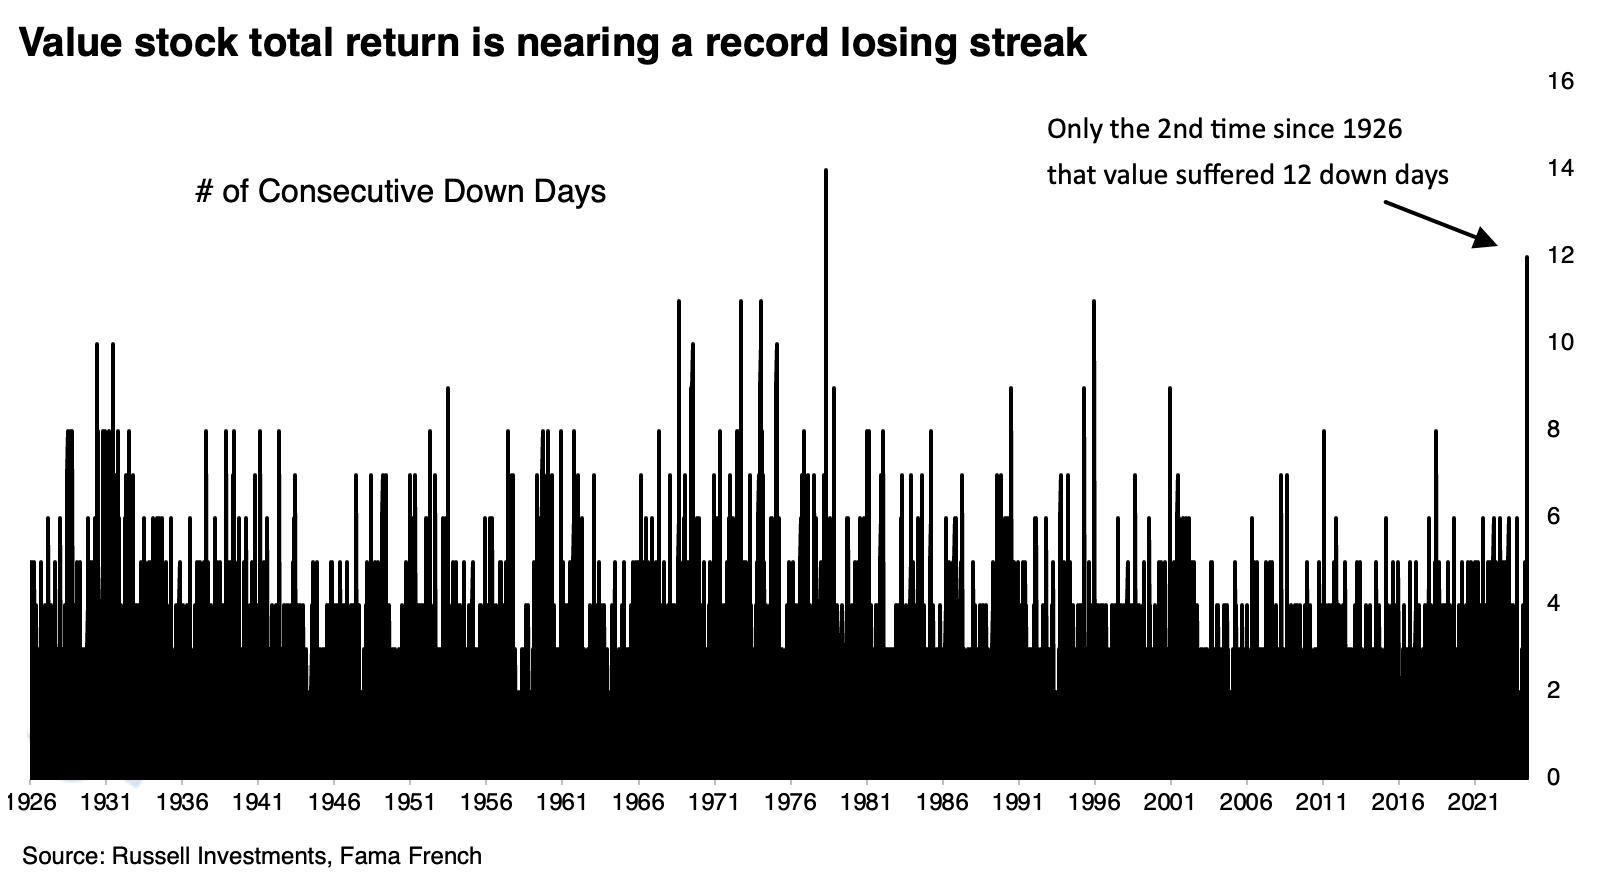
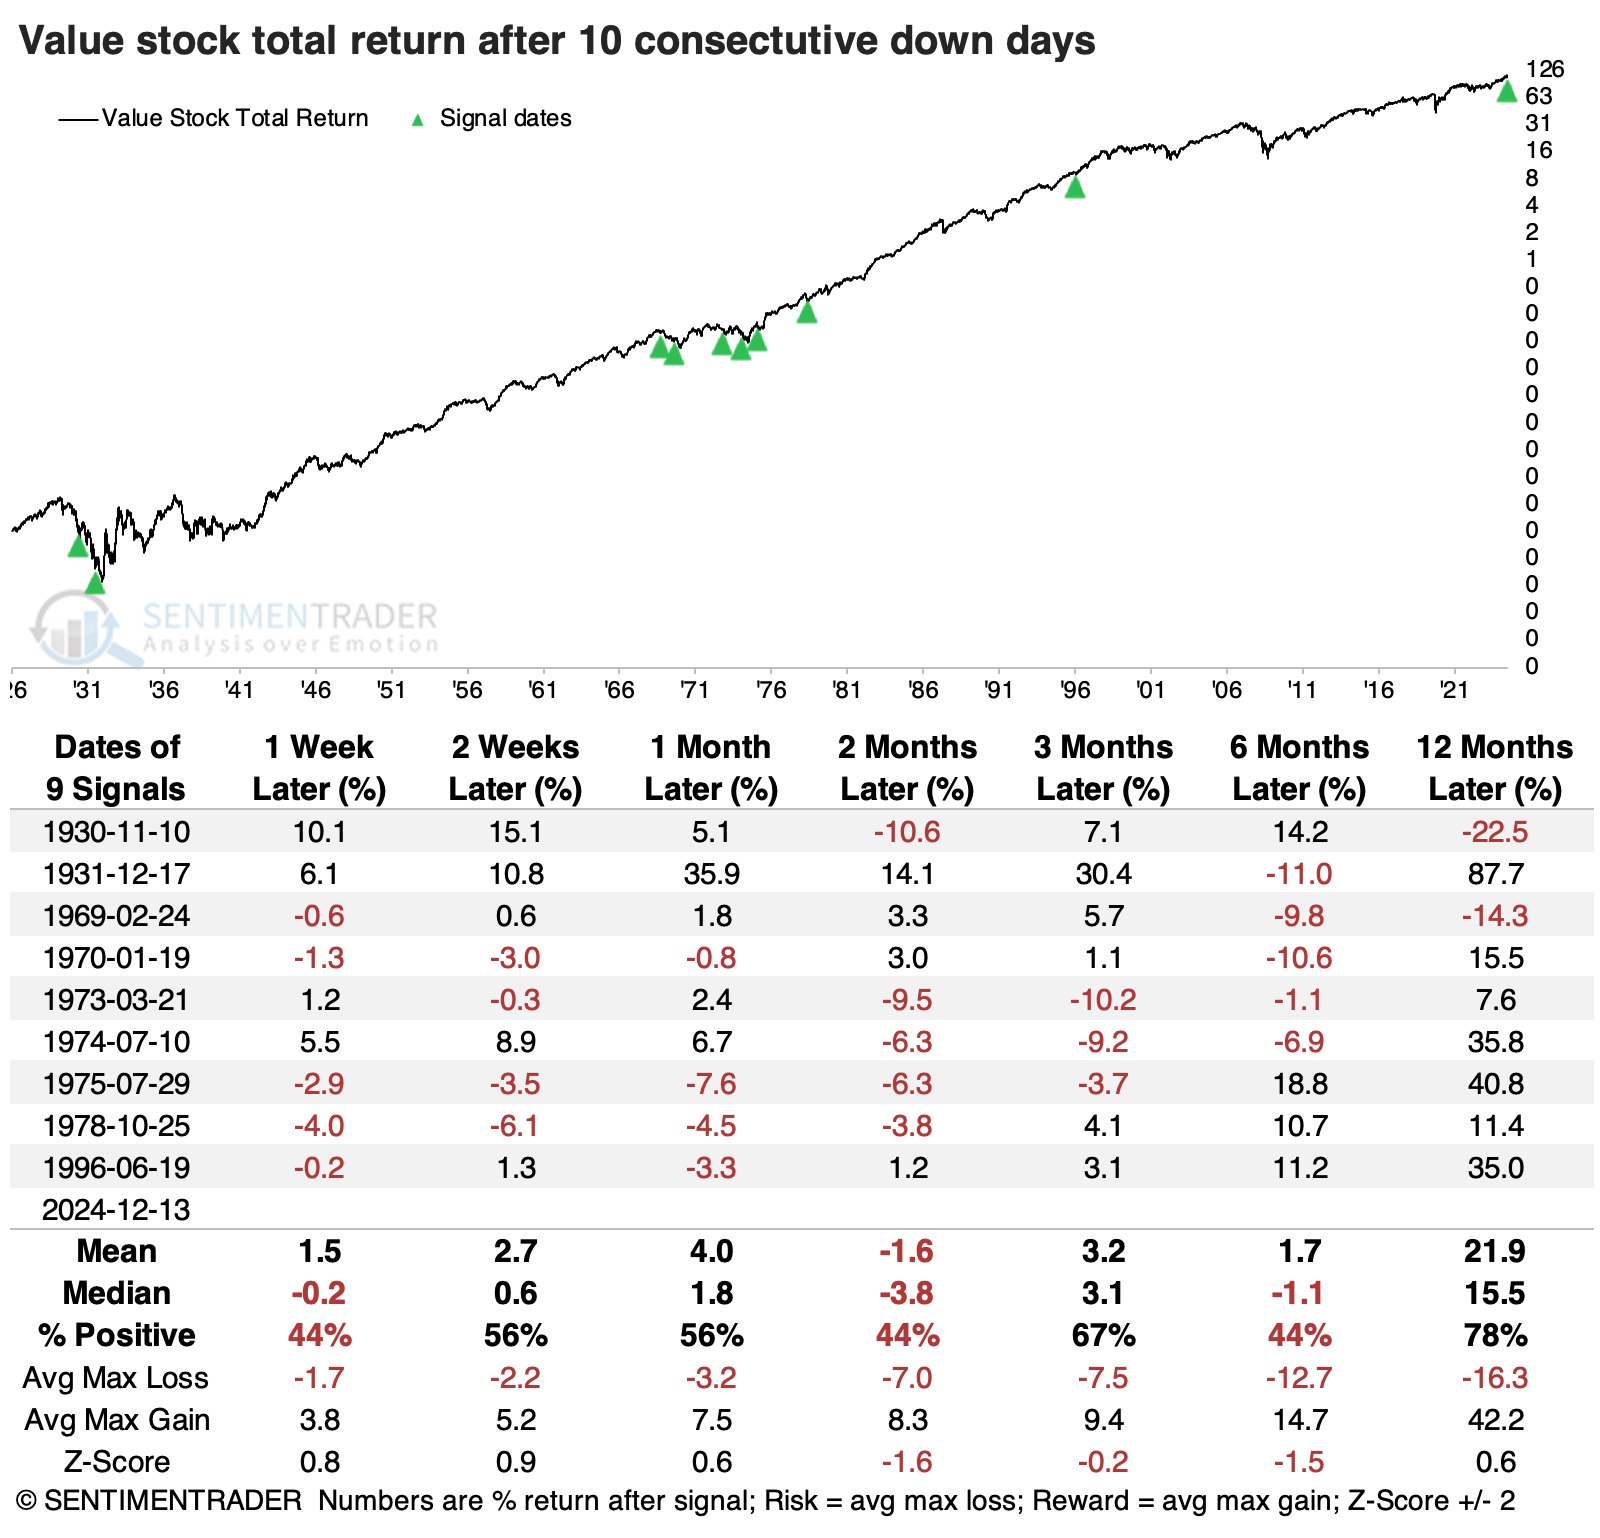
Lesser extremes, say 10 consecutive down days, weren't necessarily a good excuse to buy, though the last four signals all witnessed exceptionally positive ratios of reward to risk over the following year.
What the research tells us...
Whenever an index, or a ratio of indices, falls precipitously to a multi-year low, it's tempting to think it just has to be a contrarian opportunity. Sometimes it is, maybe even most of the time. The problem with those looking for this opportunity in small-cap or value stocks is that there have been a handful of times in recent years when it seems like that mean reversion should have taken place. And it didn't.
There is more evidence that a skew toward value and away from growth makes sense now, more than before. During modern history, let's say since 1950, value has tended to show significantly better long-term returns than growth after suffering a pounding, as it has in recent weeks.