
A historic downside reversal in the S&P 500

Key points:
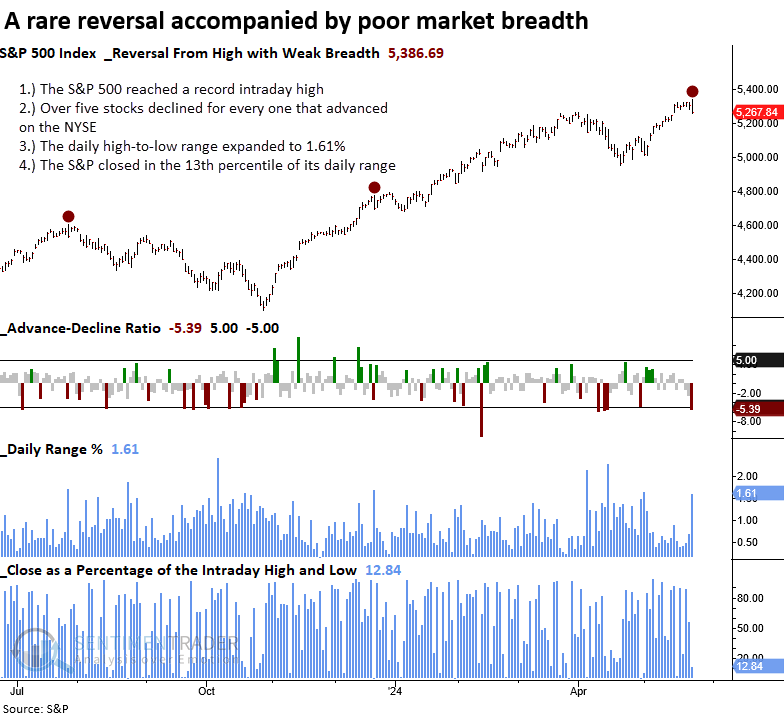
- After a record intraday high, the S&P 500 tumbled, with market breadth turning decidedly negative
- Similar conditions suggest the world's most benchmarked index could be near-term rangebound
- Six months later, the S&P 500 was higher in all but one case, suggesting the pattern does not align with significant market peaks
Dramatic one-day reversal patterns create eye-catching headlines but seldom signal a significant market peak
Following the excitement around Nvidia's earnings, traders capitalized on the gap-up opening in the S&P 500 to a record intraday high by taking profits, triggering a significant downside reversal. The selling pressure broadened the S&P 500's trading range significantly, with the index closing near the lowest level of the day. Additionally, the reversal was marked by poor market breadth on the NYSE, where the advance-decline ratio showed a concerning imbalance, with five stocks declining for every one that advanced.
The downside reversal observed in the S&P 500 was rare. In fact, only one other instance has occurred since the collection of intraday high and low data began in 1957. That signal occurred in January 2011.
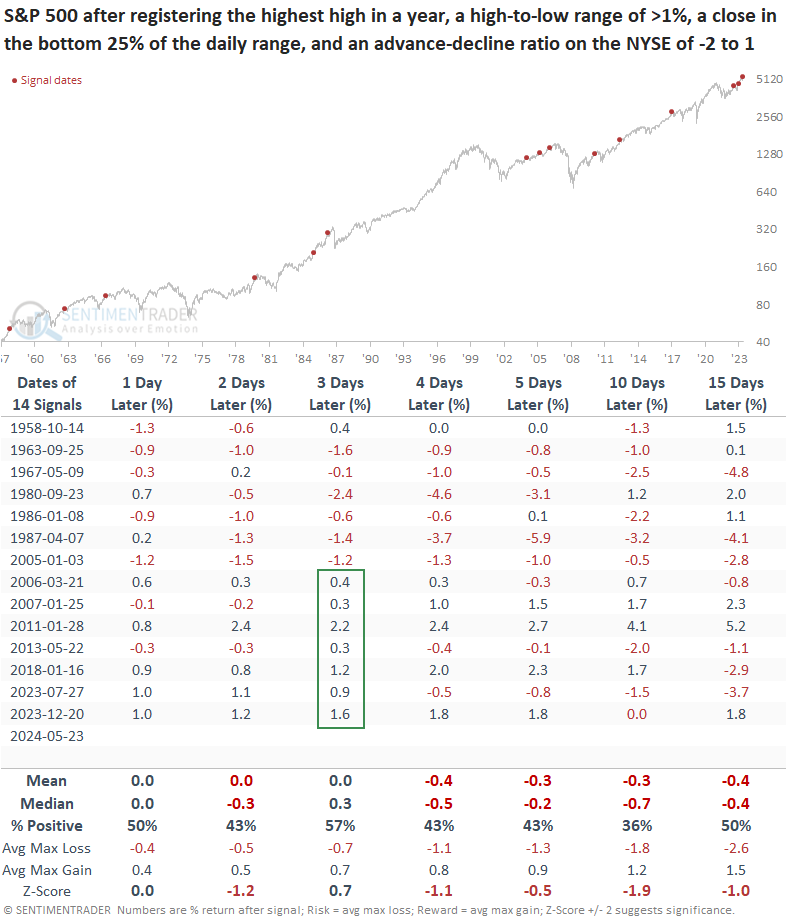
After significantly relaxing the parameters, the study identified 14 other instances, with two examples in the chart below: one leading to a multi-month correction and the other a short-term consolidation.
Similar reversal patterns suggest the potential for a short-term consolidation
Following a downside reversal like the one seen on Thursday, the S&P 500 typically experiences a modest short-term correction. Over the ensuing three weeks, the world's most benchmarked index displayed a negative return at some point in 12 out of 14 instances.
Should a snapback occur, it's likely to happen three days later, which shows seven consecutive winners since 2006.
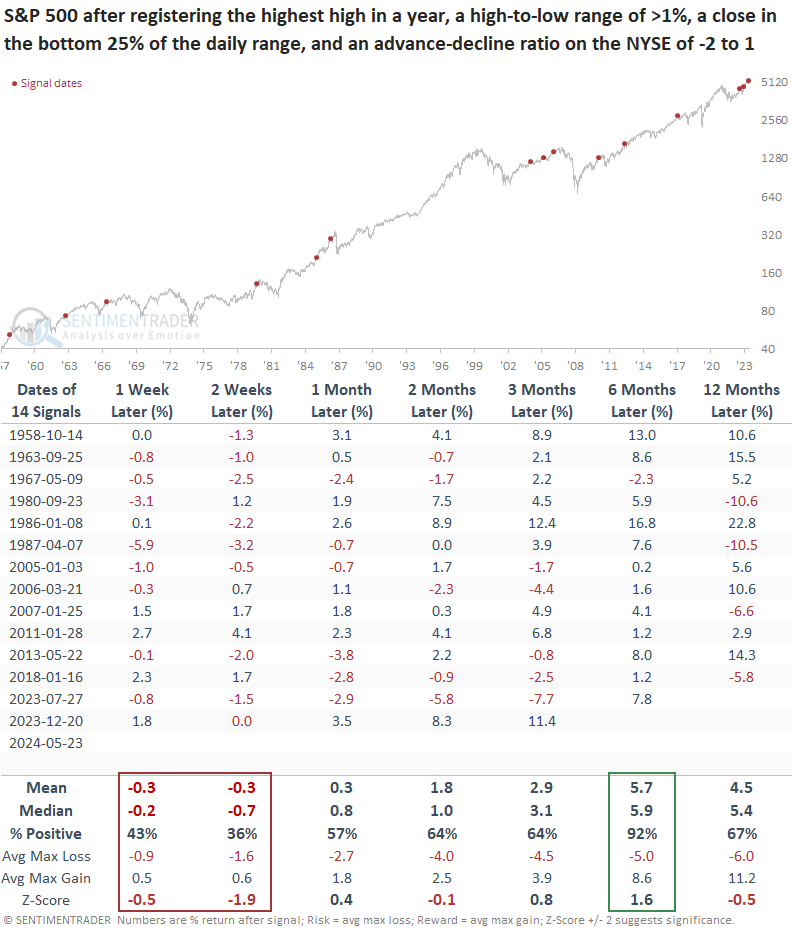
While the short-term outlook could see some backing and filling, these one-day reversal patterns do not align with significant market peaks. The S&P 500 was higher in all but one instance in the subsequent six months. Over this same interval, none of the maximum losses exceeded -10 %, although July 2023 was close with a -9.3 % decline.
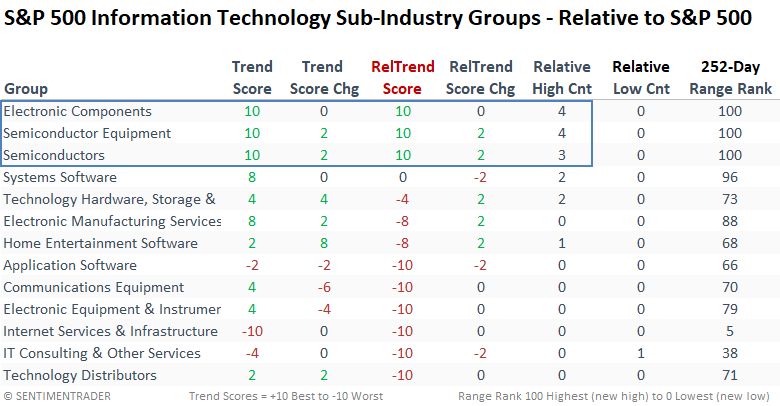
Relative trend scores for Technology show improvement
Following the April correction, I published several research notes highlighting bullish signals for Technology. At the time, the sector's relative trend scores did not look favorable, especially compared to other groups. However, trends began to improve even before Nvidia's earnings release.
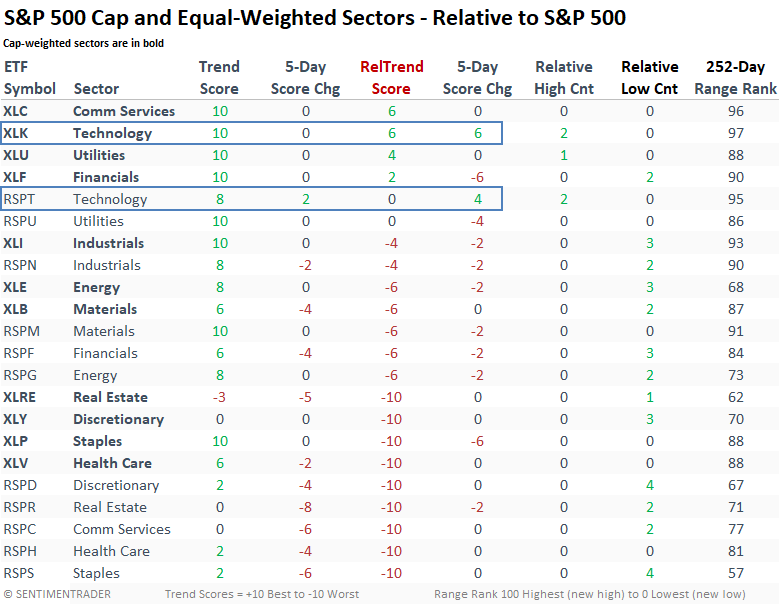
Not much has changed since my last report on Technology; the Electronic Components, Semiconductors, and Semiconductor Equipment sub-industry groups continue to dominate the relative trend score rankings.
What the research tells us...
On Thursday, the S&P 500 experienced a significant downside reversal, ending near its lowest point of the day. The range between the intraday high and low widened significantly, and market breadth on the NYSE was notably poor. Although this might appear alarming to those unfamiliar with market patterns, such one-day events usually signal a period of consolidation rather than a major market peak. Six months later, the S&P 500 was higher 92% of the time, underlining the transient nature of short-term patterns in long-term uptrends. The Technology sector shows signs of a recovery in relative strength trends, although this resurgence is primarily fueled by a few industry groups.