
A historic divergence between the energy sector and crude oil

Key points:
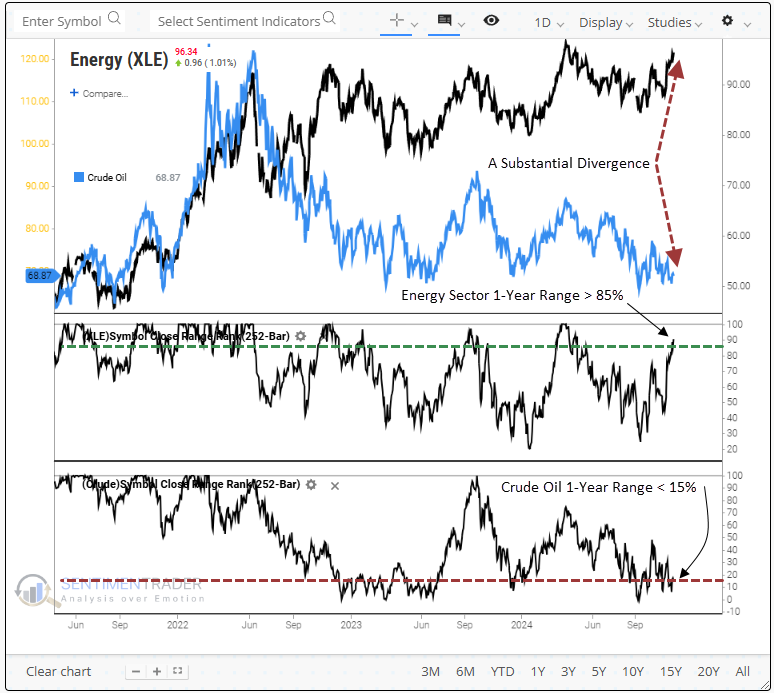
- The S&P 500 energy sector trades near a 1-year high, while crude oil hovers around a 1-year low
- Comparable divergences produced an unfavorable medium-term outlook for the energy sector
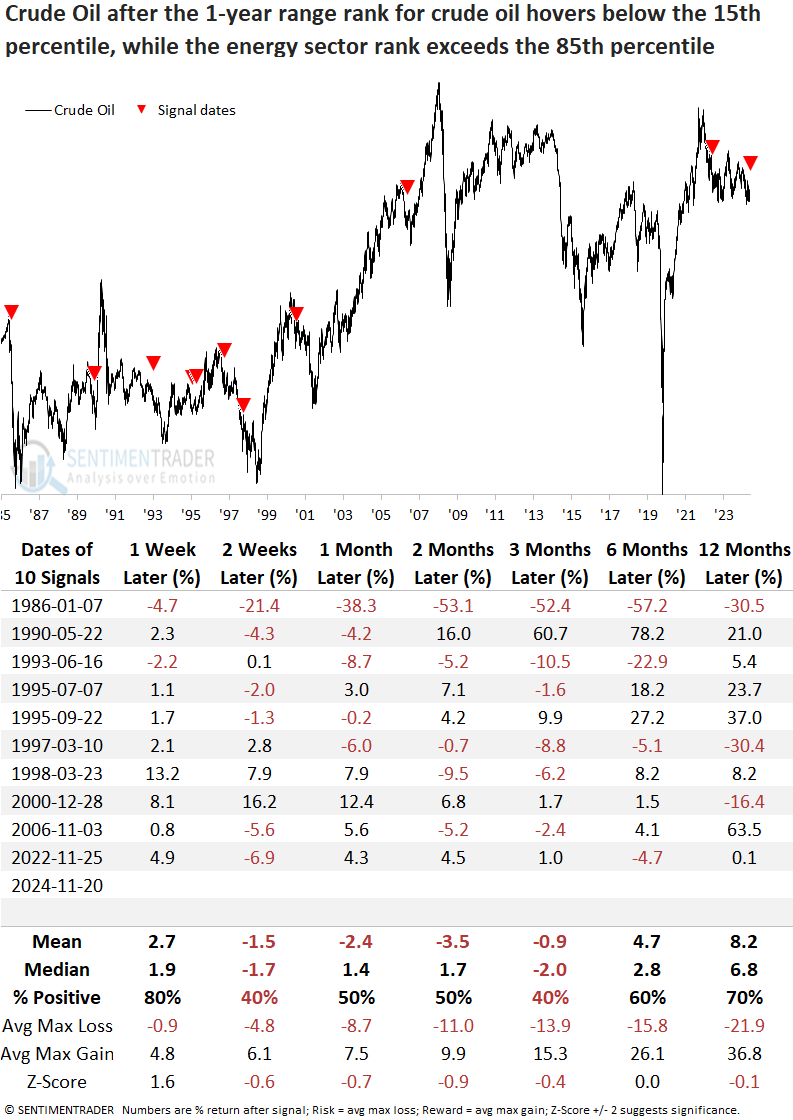
- Crude oil rallied over the next week but stayed relatively flat over the subsequent three months
The energy sector and crude oil are moving in opposite directions
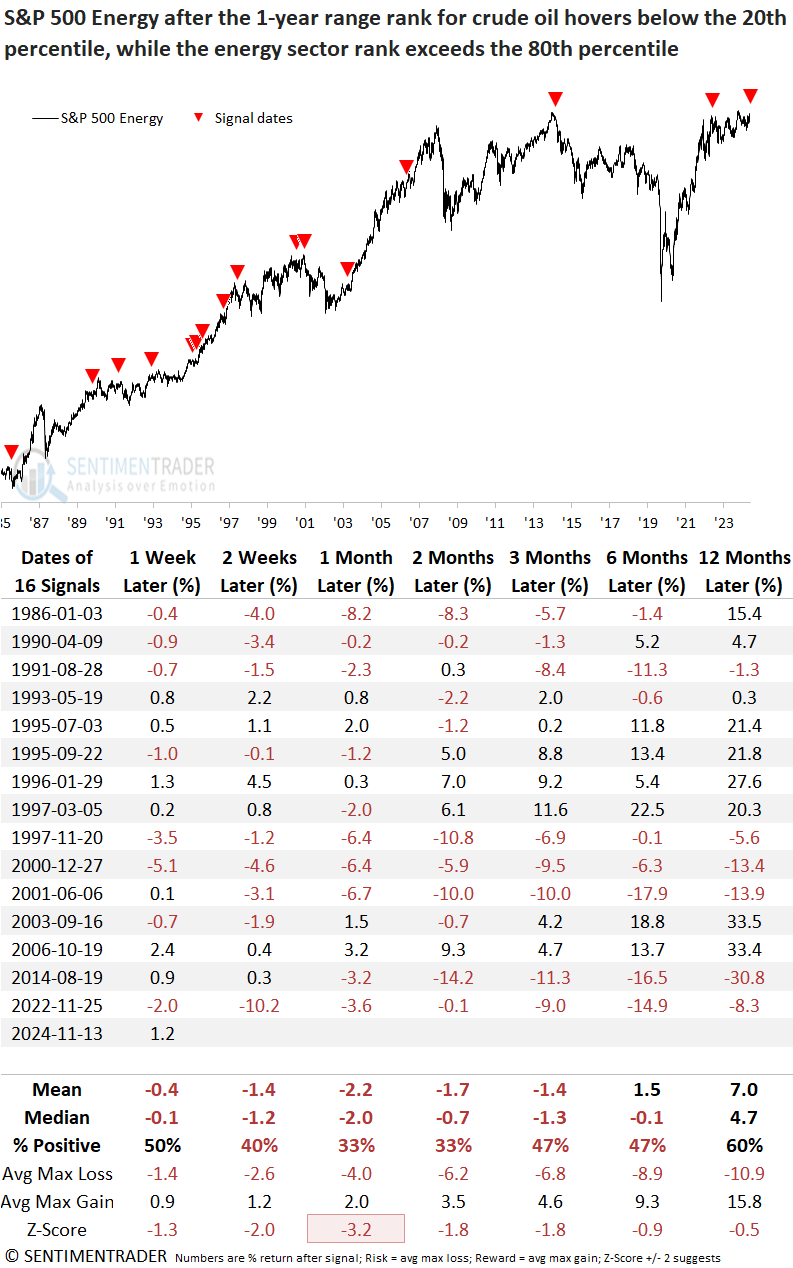
A historic decoupling has emerged between the S&P 500 Energy sector and crude oil prices- a scenario that has occurred only ten other times since 1986. Typically, energy stocks move in tandem with oil prices, so a divergence like the current one warrants our attention.
On Wednesday, the S&P 500 energy sector closed above the 85th percentile of its 1-year range. Conversely, crude oil closed below the 15th percentile of its respective 1-year range.
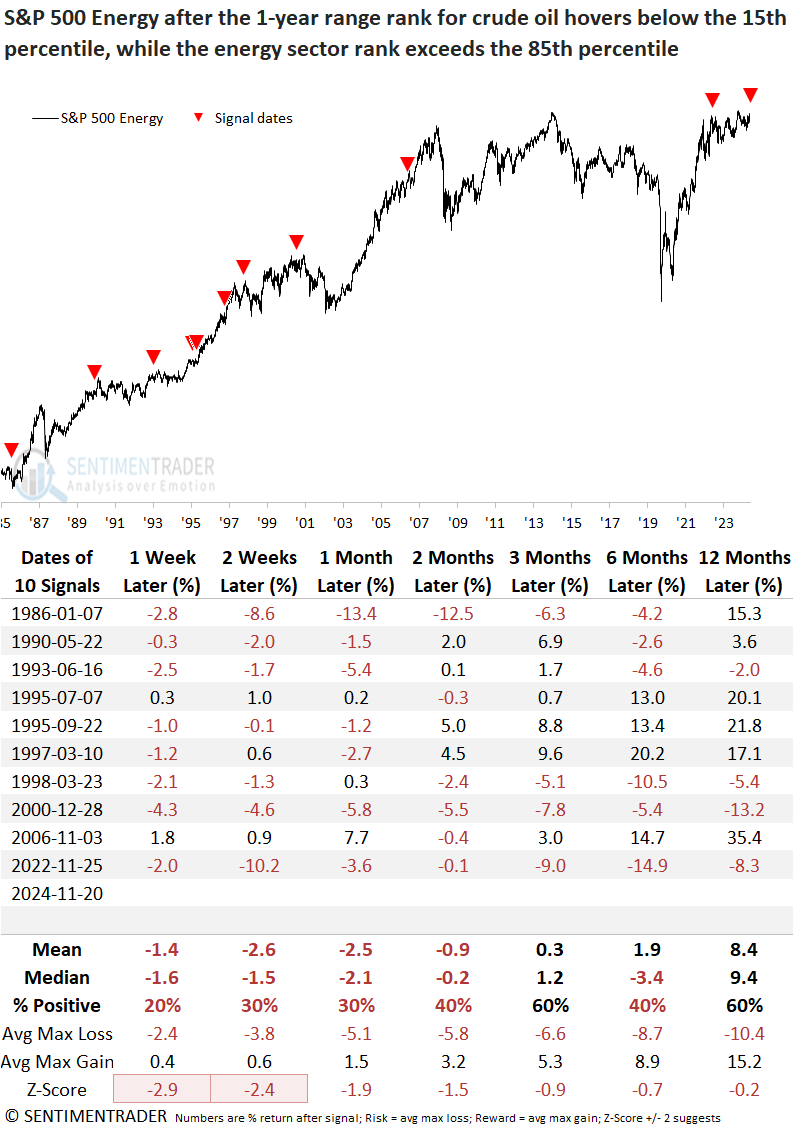
Following the last notable divergence of this magnitude, the S&P 500 energy sector declined 10% over two weeks.
I screened out repeats by requiring the energy sector rank to fall below the 50th percentile before a new signal could occur again.
Similar divergences preceded negative returns for the S&P 500 energy sector
Although the sample size is small, substantial divergences between the energy sector and crude oil prices have historically seen the S&P 500 energy sector "catch down" to oil, with declines occurring 70%-80% of the time from one to four weeks later. Over the subsequent six months, the outlook was primarily negative, with risk outweighing reward in nearly every interval.
Similar divergences preceded stagnant returns for crude oil
Although crude oil tended to rally a week later, rising 80% of the time, returns and consistency over the subsequent three months were uninspiring, suggesting a rangebound market.
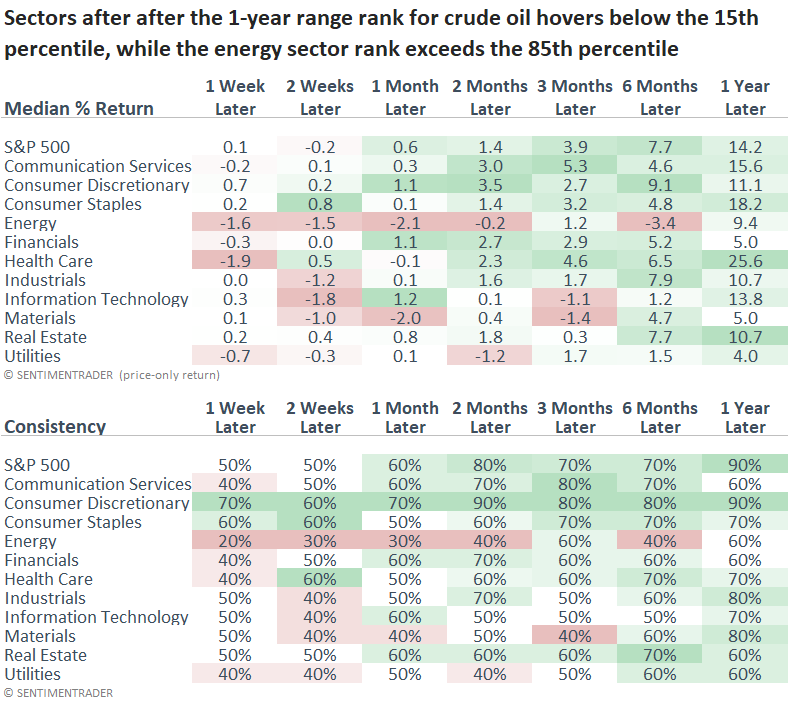
Energy underperformed the S&P 500 over the subsequent year across all time frames, a scenario also shared by materials, another commodity-oriented group.
A larger sample size provides a similar message for energy stocks
Let's expand the sample size by adjusting the parameters to capture signals with a range rank of >= 80% and <= 20%. The analysis conveys a similar message: energy stocks could stumble, narrowing the gap with crude oil.
Other considerations
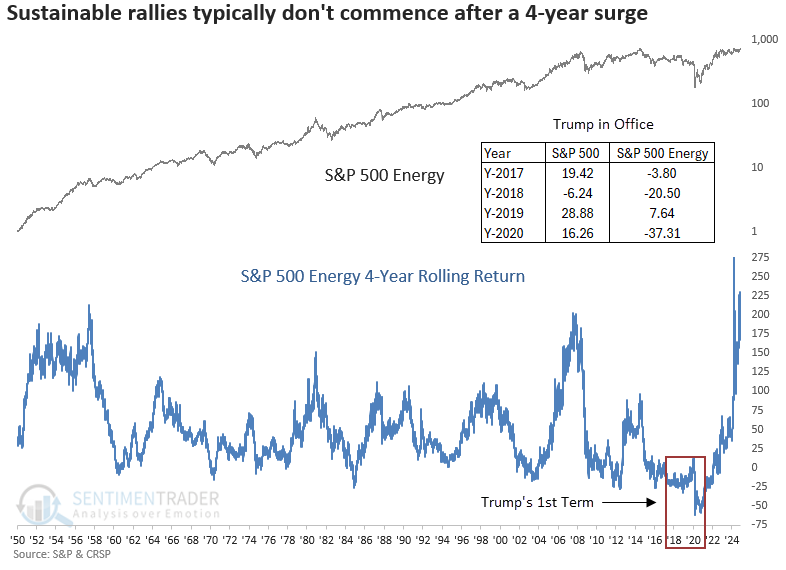
Although the S&P 500 energy sector has consolidated over much of the past two years, the 4-year rate of change remains among the highest observed in the past 70 years. Except for the late 1950s, significant rallies of this nature preceded downside price action for the sector.
While acknowledging that it could be random, during Trump's first term, the energy sector experienced negative returns in three out of four years and underperformed the S&P 500 each year.
Trend scores
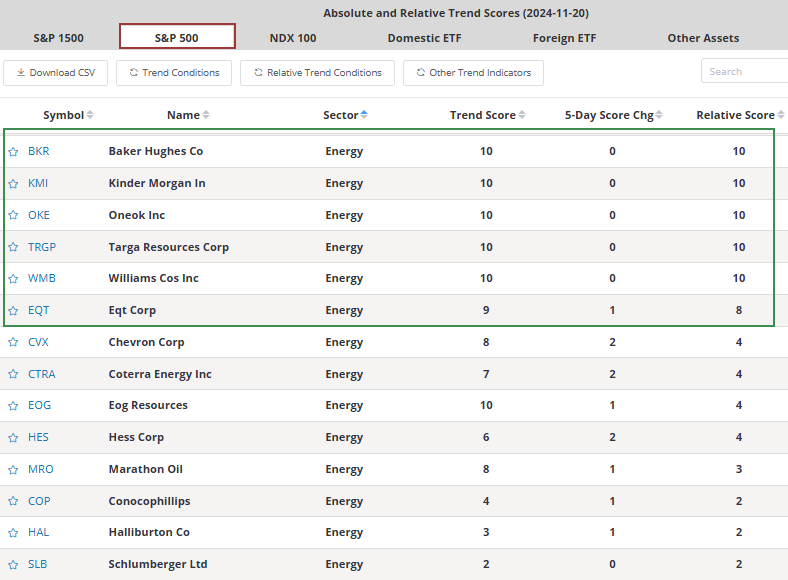
Website subscribers can now view absolute and relative trend scores for over 1500 stocks, with the ability to sort by sector, as illustrated in the table below.
In my research report, "Crude oil swoons to a new 1-year low," I highlighted several energy stocks in the oil and gas storage and transportation sub-industry that exhibited bullish trends, defying the overall sector's subdued outlook.
Those stocks, WMB, TRGP, OKE, and KMI, have done phenomenally well, rising from 27% to 43% since that report was published. Even more astounding is how much they have increased since the 2020 Covid lows. With a stock like TRGP up over 3000%, one has to wonder how much gas is left in the tank.
What the research tells us...
The energy sector and crude oil have diverged to an unprecedented degree, with the industry hovering near the upper end of its 1-year range as the commodity lingers near the bottom of its 1-year range. Historically, such divergences have often resolved with the energy sector declining over a medium-term basis, closing the gap with crude oil as the commodity tended to move sideways. While recent gains in energy stocks have prompted some market commentators to advocate for a rotation out of technology and into energy, it's crucial to remember that a sustainable energy stock rally is unlikely to occur without a supportive tailwind from oil.