
A historic divergence between industrial and transportation indexes

Key points:
- The Dow Jones Industrial Average closed at a new high, with the Transports severely lagging
- Similar divergences weren't ominous, with the Industrials rising 75% of the time a year later
- Using the S&P 500 Industrials or the S&P 500 in place of the Dow Industrials produced more favorable outcomes
Does the non-confirmation from the Transports put the rally in jeopardy
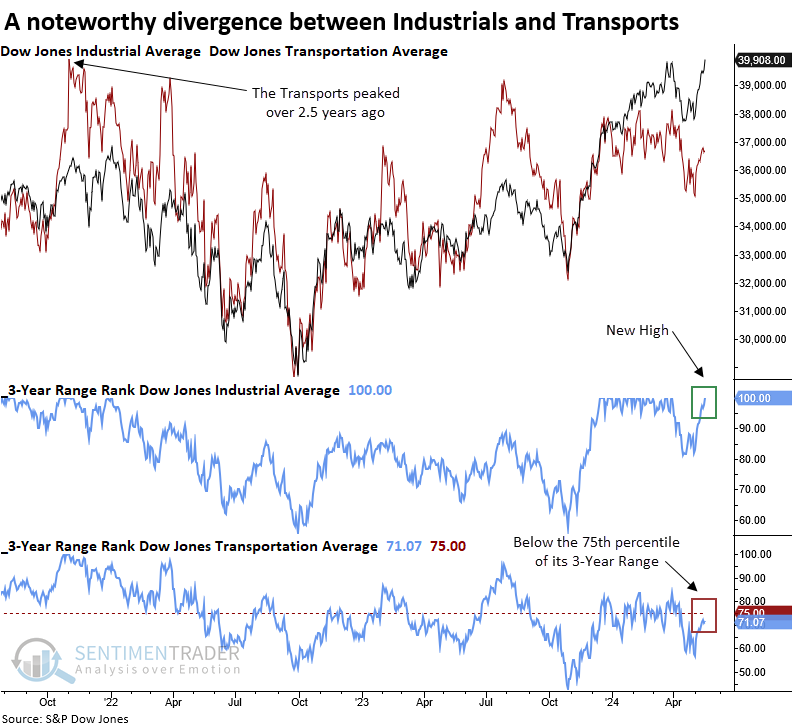
According to Dow Theory, a rising trend in both the Dow Jones Industrial Average (the manufacturers of goods) and the Dow Jones Transportation Average (the companies that transport the goods) indicates a healthy economy, which is positive for stock performance.
Over the past week, I've noticed numerous mentions pointing out the lack of confirmation from the Dow Jones Transportation Average, as the Dow Jones Industrial Average has reached several new record highs.
Although Dow Theory remains on a buy signal from July 2023, the transports have not registered a new high in two and half years, which made me wonder when a divergence of this duration has occurred in the past and what, if any, message we can derive from other precedents.
I applied a 3-year range rank to both indexes to capture other periods similar to now. The industrial sector showed a rank of 100%, indicating a new high. In contrast, the transport sector displayed a rank of 71%, a stark difference between the two groups that should be rising in unison.
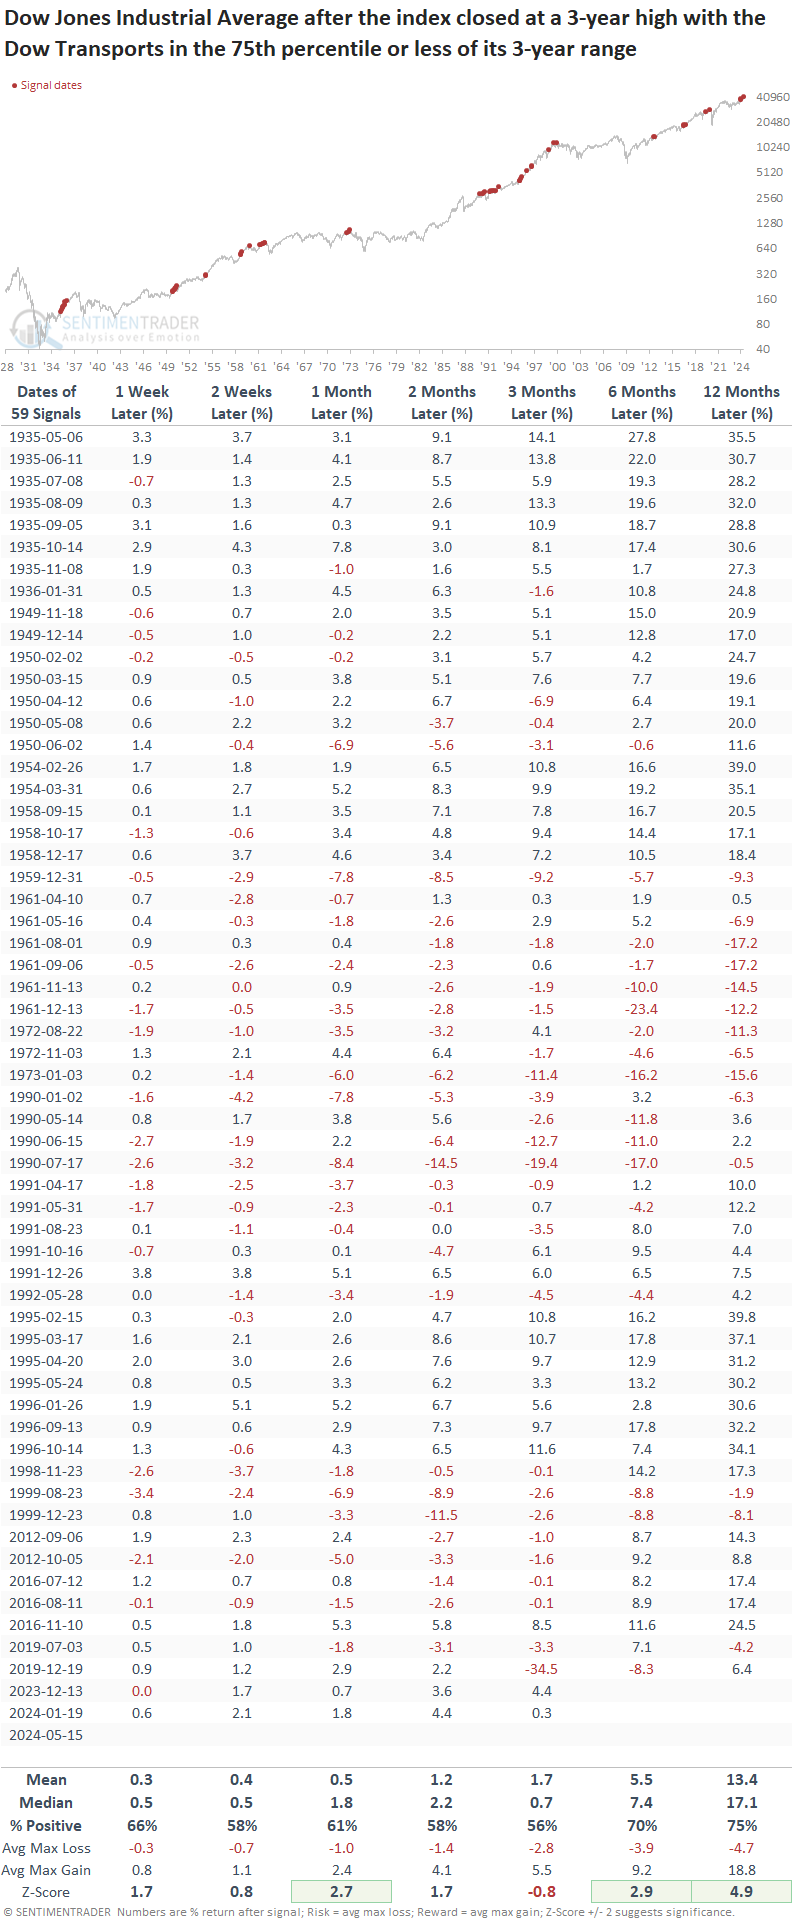
Similar range rank divergences exhibited positive returns
Following instances when the Dow Jones Industrial Average closed at a 3-year high with the Transportation Average's 3-year range rank in the 75th percentile or less, the Industrials rose 75% of the time over the subsequent year, with a median return of 17%, which exhibited significance relative to random returns.
These divergences usually appear in clusters. The variations in returns and win rates between the initial (very positive) and final (significantly diminished) signals highlight the importance of a rules-based sell signal, which Dow Theory offers.
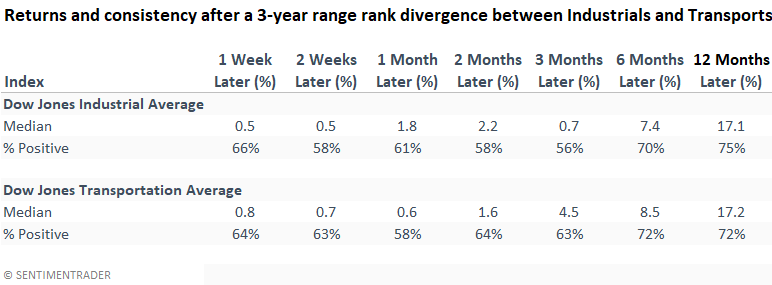
Suppose I compare the Industrials to the Transports. In that case, the transports have a slight edge over the next three to twelve months, pointing to a potential catch-up trade by the laggard.
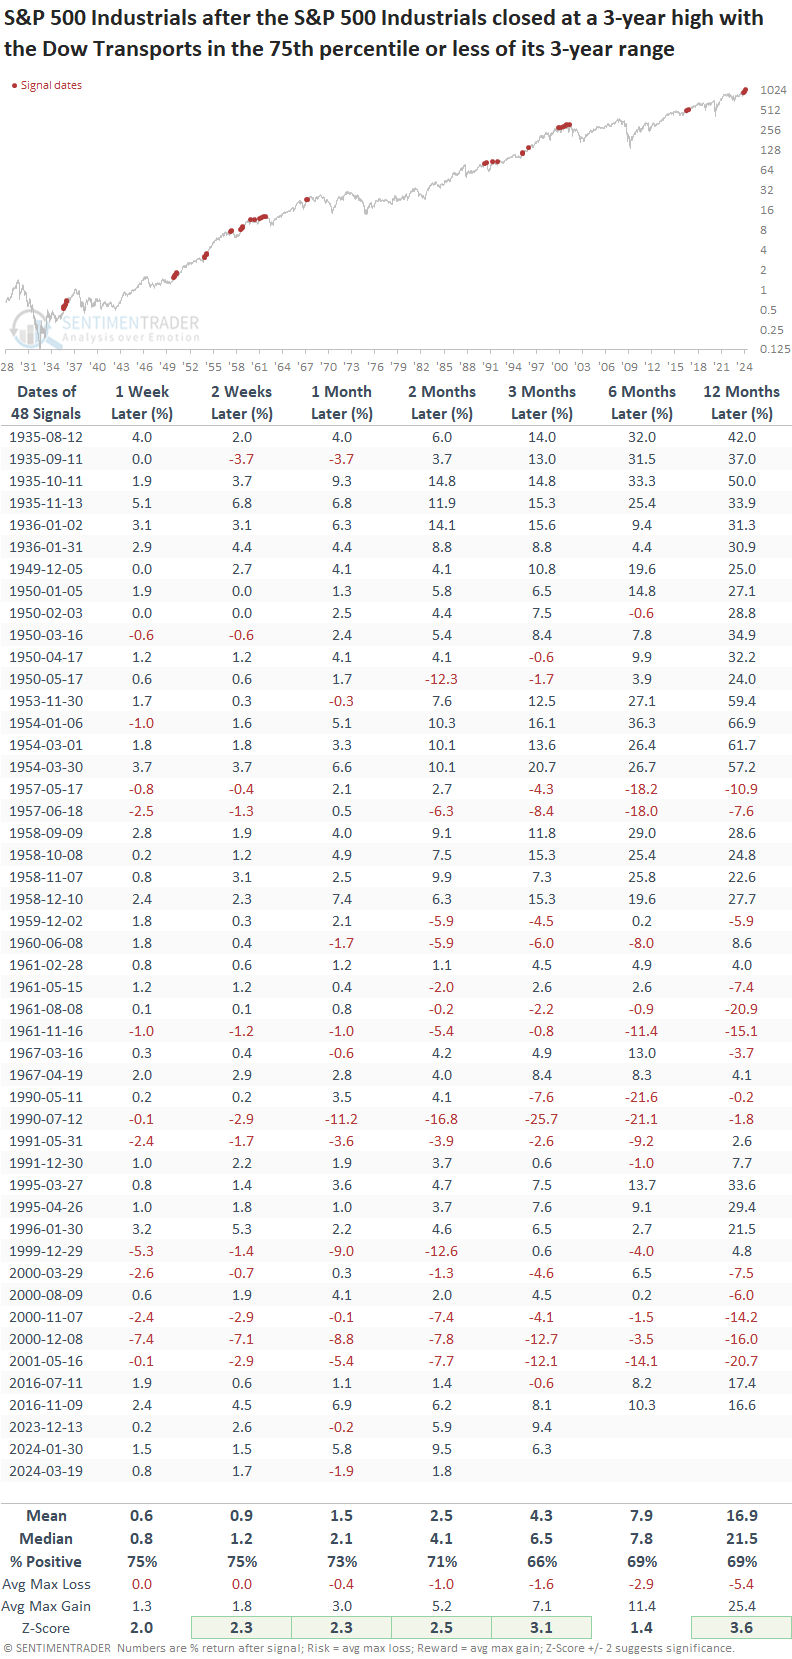
Given that the Dow Jones Industrial Average no longer reflects industrial companies but rather a more diverse group of stocks across various sectors, let's substitute the S&P 500 Industrials for the Dow Jones Industrial Average. Followers of Dow Theory might consider this replacement on a go-forward basis.
Interestingly, there were fewer signals, some of which were associated with signficant drawdowns like 73-74, which resulted in a more favorable outlook across most time horizons.
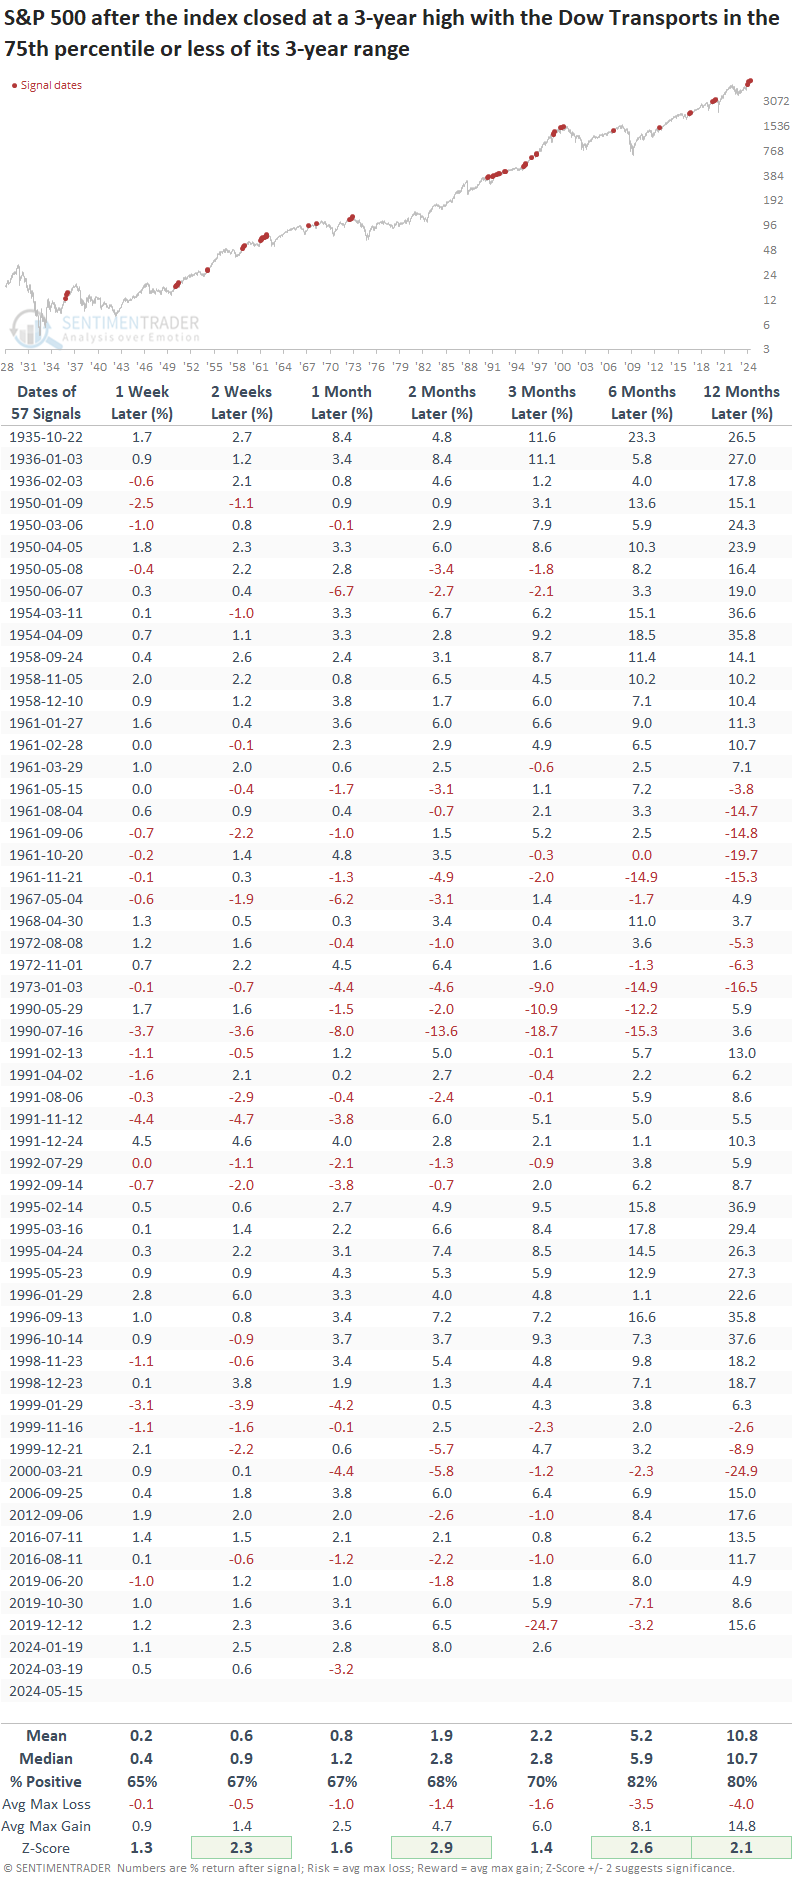
Another consideration would be comparing the S&P 500 to the Dow Jones Transportation Average. If The Dow Jones Industrial Average no longer represents Industrial companies, I think it's more appropriate to use a benchmark containing 500 stocks rather than one with 30 members.
In cases where the S&P 500 reached a 3-year high with the Transports residing in the 75th percentile or less versus its 3-year range, the outlook for the world's most benchmarked index was solid, notwithstanding a handful of instances that aligned with signficant market peaks like 1962, 1973, 1990, and 1999, similar to the Dow Industrials versus Transports comparison.
What the research tells us...
The Dow Jones Transportation Average has lagged behind the Dow Jones Industrial Average, raising concerns among some market participants who view the transportation sector as a leading economic indicator. However, this divergence may not carry the same weight as the U.S. has shifted from a manufacturing-based economy to a more service-oriented one. Because of this transition, a manufacturing or transportation recession does not always coincide with a broad economic contraction. Although a divergence between Industrials and Transports warrants attention, the indexes tend to get back in sync, rising in unison.