
A historic divergence between homebuilders and the broad market

Key points:
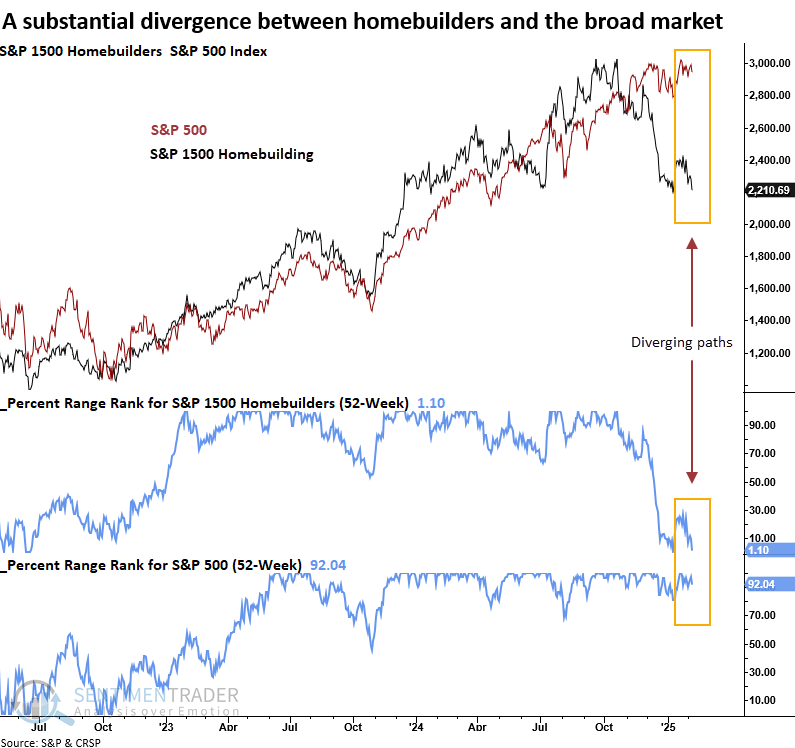
- Homebuilders trade near a 52-week low, while the S&P 500 hovers around a 52-week high
- Similar divergences preceded a challenging period for homebuilding stocks over the next quarter
- The broad market and cyclical sectors struggled as defensive groups outperformed
Are homebuilding stocks foreshadowing a growth scare or something more ominous
On Friday, the S&P 1500 homebuilding sub-industry group finished slightly above its 52-week low, contrasting sharply with the broader market, which remains near an all-time high. Since 1964, a divergence of this magnitude has only occurred eight other times.
As discussed in the January webinar, the U.S. economy has transitioned from a real/asset-heavy model to a more digital/asset-light structure. Consequently, slowdowns in real-economy industries like manufacturing and transportation exert less influence on overall growth compared to the past. When these industries experience a decline in isolation, it typically leads to a growth scare rather than a broad economic contraction.
Homebuilding stocks, a real-economy group susceptible to interest rate fluctuations, seem to be pricing in continued stagnation in housing as elevated home prices and borrowing costs strain affordability. The critical question remains: Could a slump drag down the broader economy, or does it result in a growth scare, similar to what we've seen with other cyclical industries?
Similar divergences produced an abysmal outlook for the builders
Whenever homebuilders closed in the bottom 2% of their 52-week range while the S&P 500 remained in the 90th percentile or higher of its respective range, the S&P 1500 Homebuilders industry consistently declined, falling 100% of the time over the next two and three months.
I screened out repeats by requiring the range rank for the S&P 500 to cross below 50% before a new alert could trigger again.
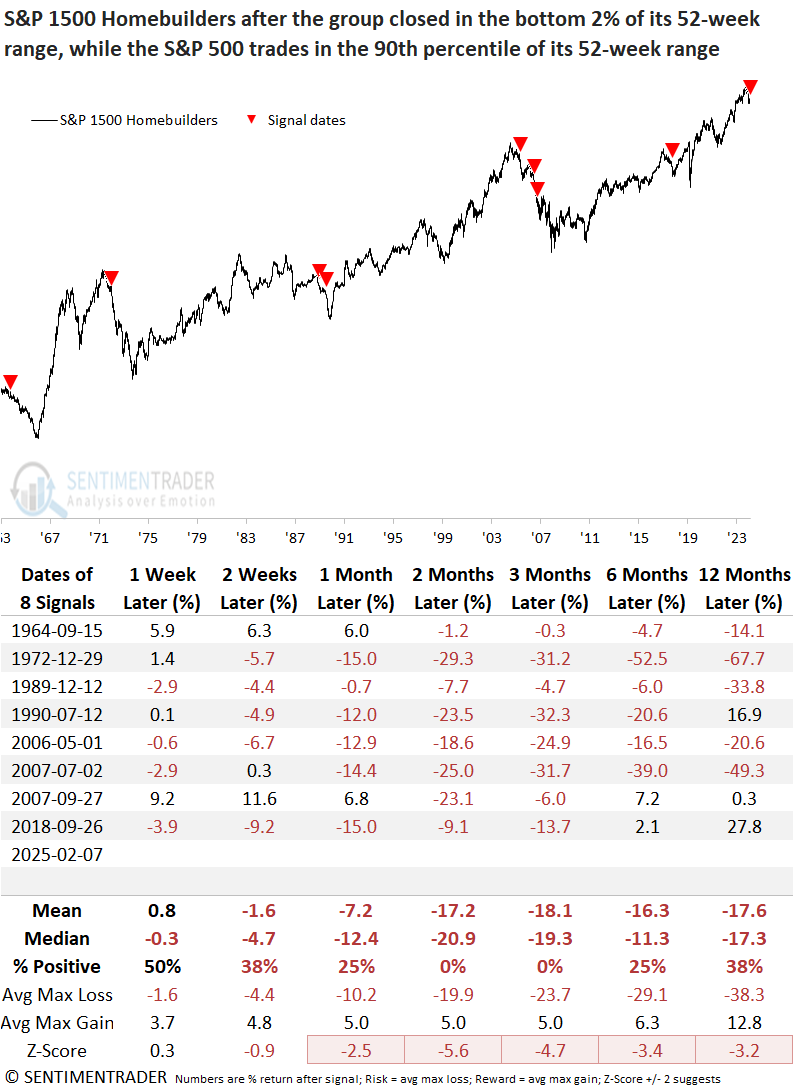
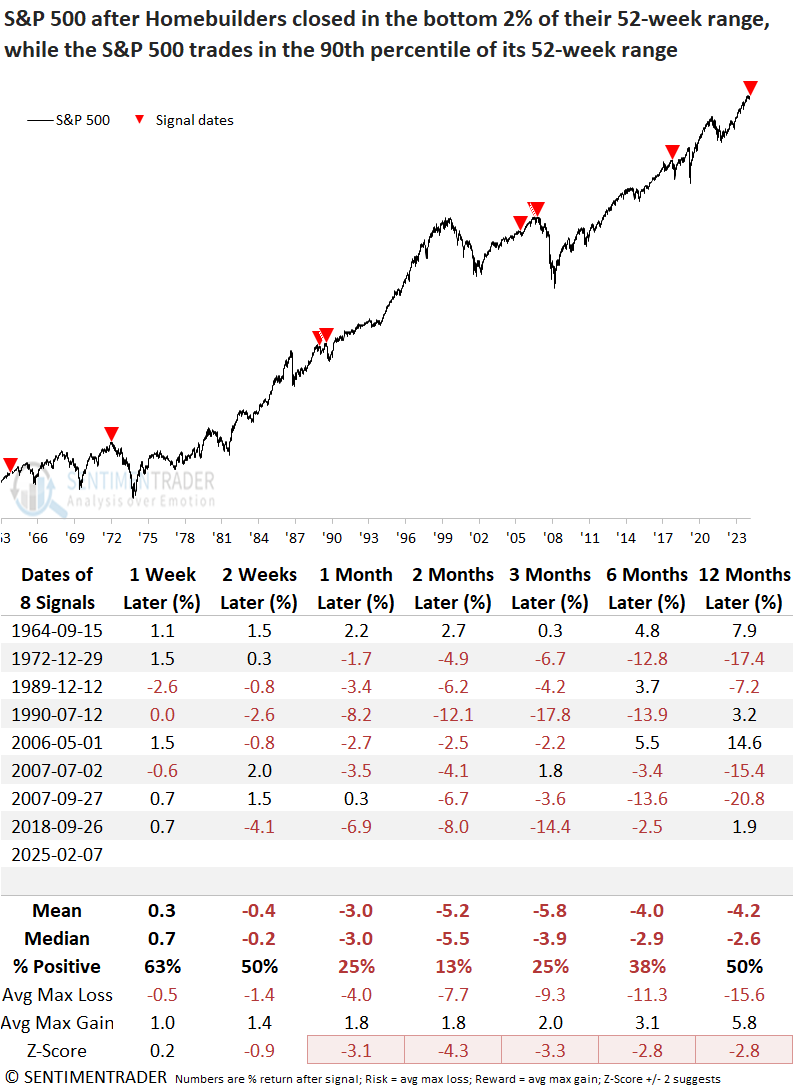
Substantial divergences between the builders and the S&P 500 often preceded or coincided with significant market tops. Over the subsequent two months, the world's most benchmarked index declined in all but one instance.
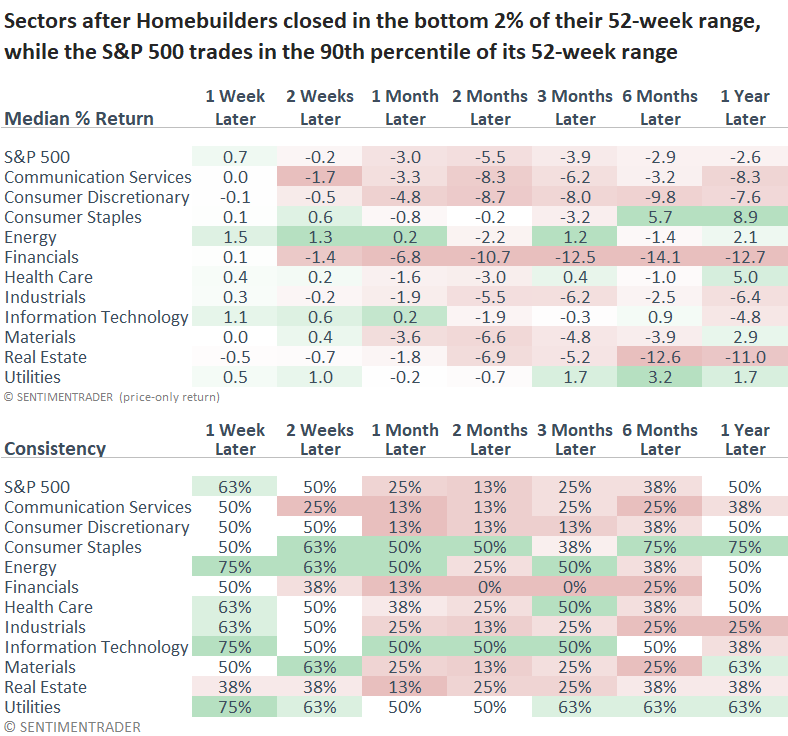
Given the negative outlook for the broad market, it's not surprising to see cyclical sectors participate on the downside as defensive groups outperformed. Financials, the most critically important group for identifying potential problems around market tops, displayed the weakest outlook. However, as I shared in several reports, financials currently display healthy trends, contrasting these precedents and suggesting this time is different, at least for now.
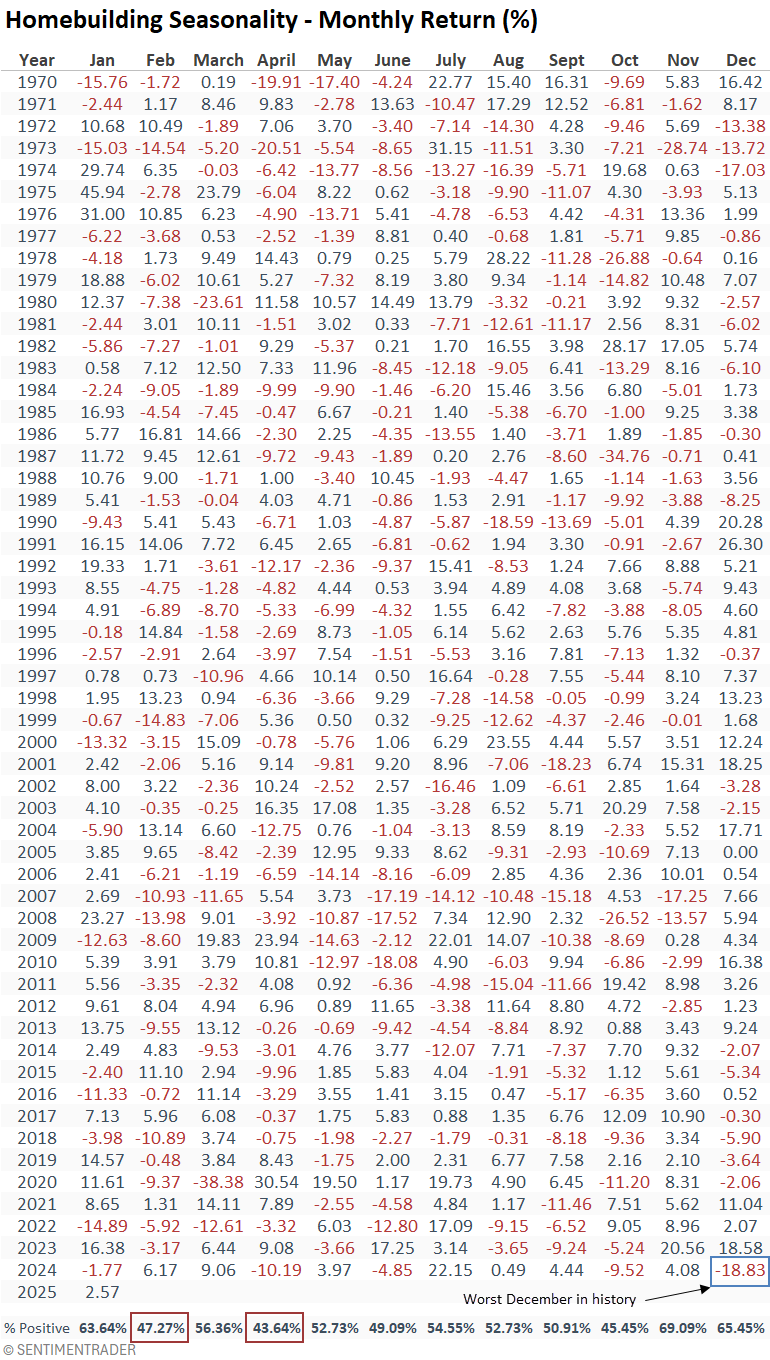
Seasonality
Builders have entered a phase historically marked by the first and third-worst win rates for any month since 1970. Additionally, it's worth noting that December 2024 recorded the worst return for that month in history.
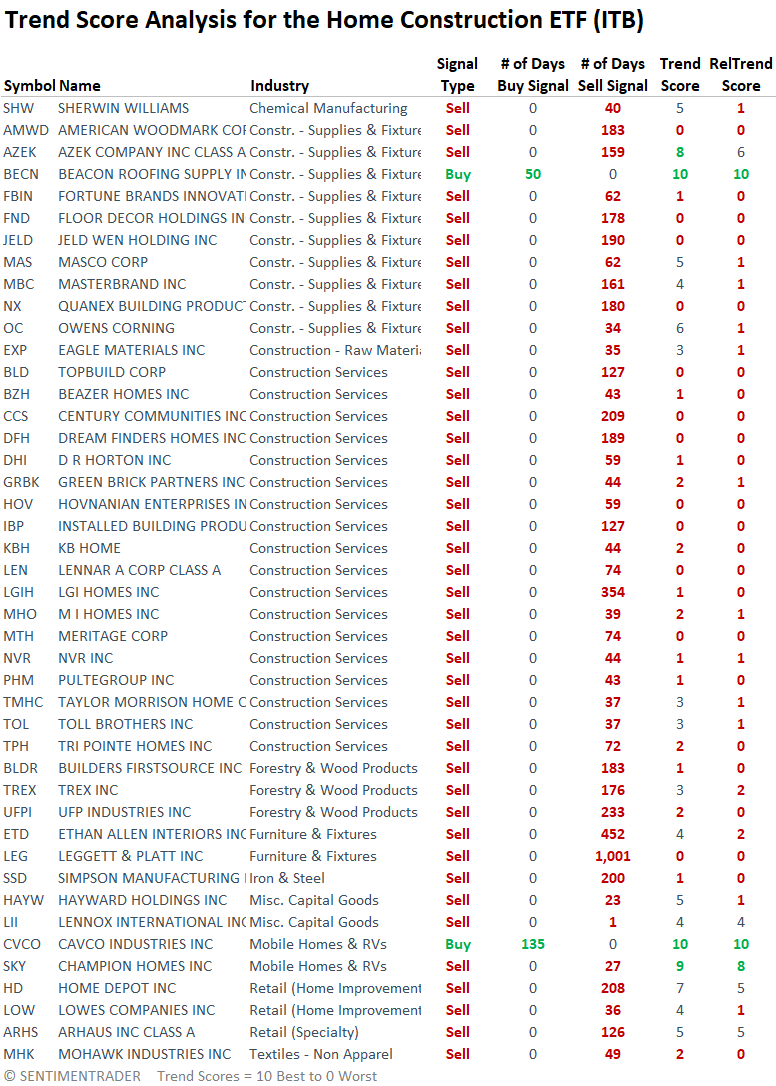
An unfavorable backdrop for stocks in the housing ecosystem
A review of trend and relative trend scores for stocks within the Home Construction ETF (ITB) indicates that most members display unfavorable trends. My trend score system highlights this weak environment, showing only two stocks, Beacon Roofing and Cavco Industries, maintain a buy signal.
Investors should avoid stocks in this group, while traders looking for short-sale opportunities will find plenty of potential here. Waiting for a bounce might be a wise approach.
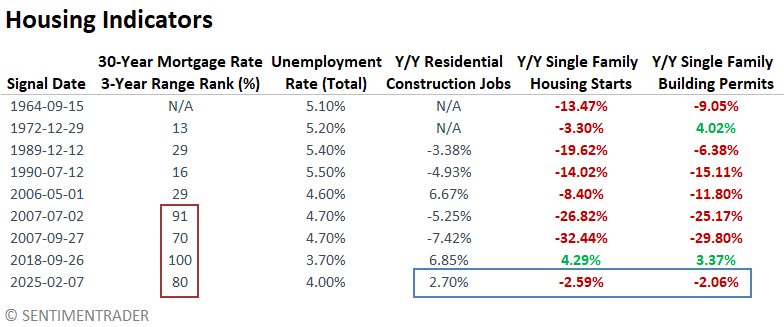
Historical comparison
As noted earlier, the housing market's primary obstacle is unaffordability, with elevated house prices and mortgage rates contributing to a stagnating market. The 30-year mortgage rate currently hovers around 7%, higher than 80% of all other readings over the last three years, a scenario that mirrors conditions seen in 2007 and 2018. However, other metrics like unemployment, residential construction job growth, housing starts, and building permits do not suggest a significant problem like 2007 is on the horizon.
What the research tells us...
Homebuilding stocks have diverged sharply from the broader market, trading near annual lows while the S&P 500 hovers near a high. This striking disconnect indicates underlying issues in the housing sector, most likely stemming from high mortgage rates and house prices. Similar divergences have preceded an extremely negative outlook for builders. While underlying conditions in housing may have differed throughout history, whatever the cause, it has been systemic enough to cause the broad market to turn down, often coinciding with significant market peaks. It's unclear whether a slowdown in housing could lead to a growth scare, economic contraction, or nothing at all. Still, investors would be wise to avoid housing-related stocks and stay alert for potential fallout from a higher-for-longer rate scenario.