
A historic divergence between healthcare and the broad market

Key points:
- Long-term trend conditions for healthcare stocks have weakened, deviating from the broad market
- Similar divergences suggest the healthcare sector could struggle over the subsequent year
- The healthcare sector underperformed the S&P 500 and most sectors in almost all time frames
Most S&P 500 healthcare stocks are now in a long-term downtrend
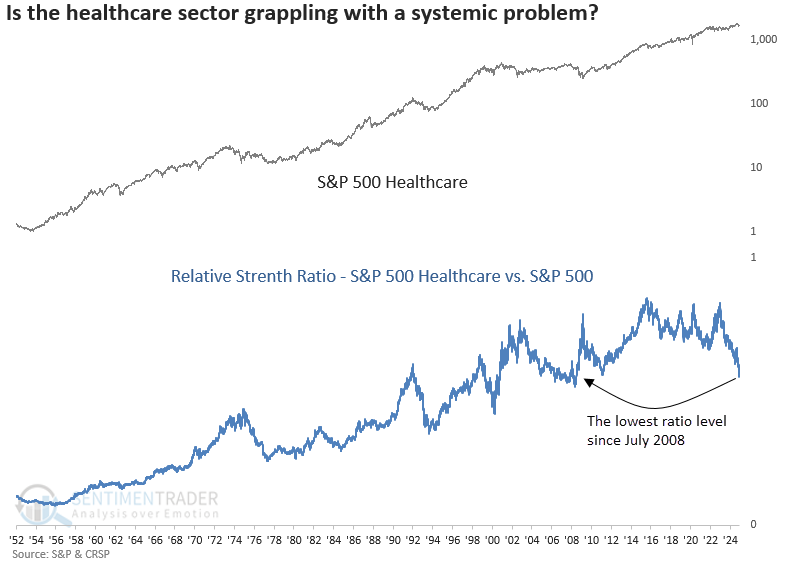
Although the traditionally defensive healthcare sector typically advances with the broad market during uptrends, it frequently exhibits weak relative performance in such environments. This trend has become particularly pronounced since the 2022 market bottom, with the relative ratio comparing the S&P 500 healthcare sector to the S&P 500 recently plunging to a 15-year low, a level last observed in July 2008.
With an unfavorable relative performance backdrop persisting for some time, the sector could experience an additional headwind as most healthcare stocks are now entrenched in long-term downtrends, sharply contrasting with the broader market.
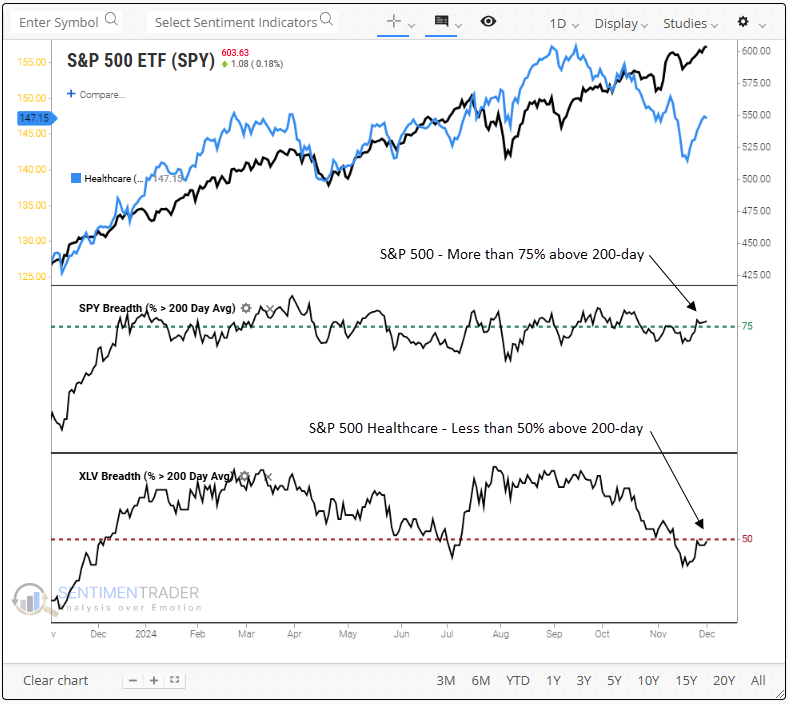
For only the ninth time in more than 70 years, the percentage of S&P 500 healthcare stocks trading above their 200-day moving average dropped below 50% as the S&P 500 maintains over 75% of its members above their respective 200-day average.
This rare divergence last occurred during the Dotcom bubble in 1999; before that, it emerged in 1993, when potential healthcare reform led to a devastating bear market in healthcare stocks.
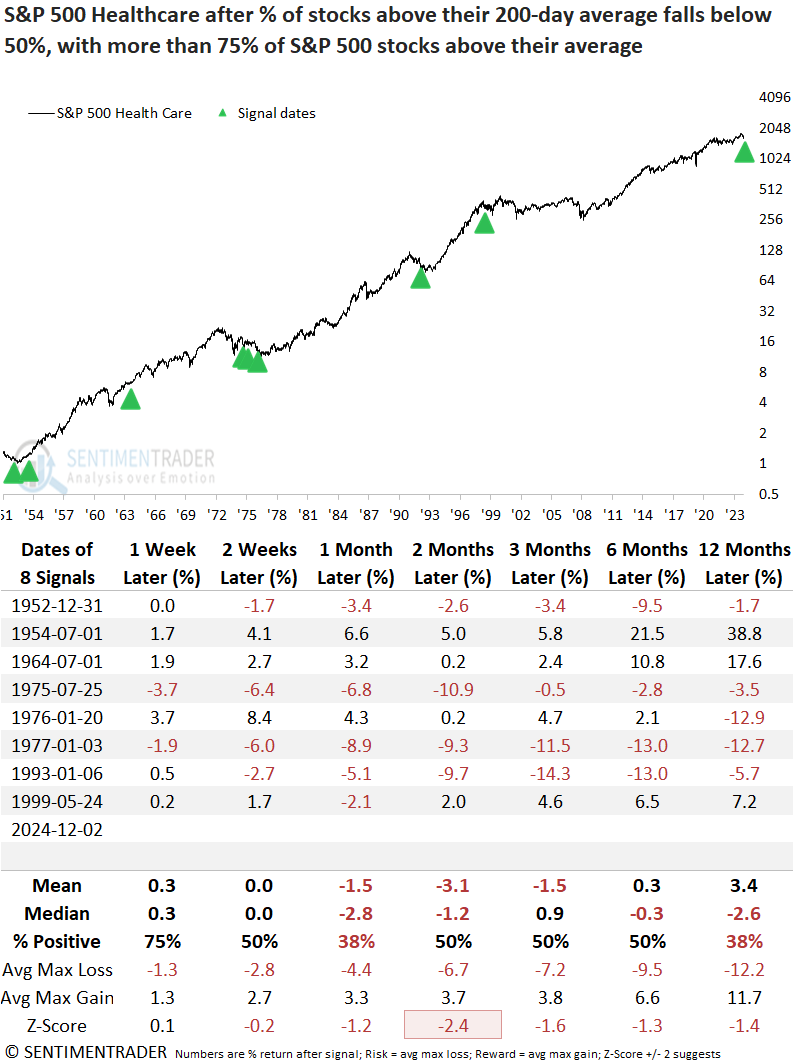
Similar divergences preceded a lackluster environment for the healthcare sector
Precedents when less than 50% of S&P 500 healthcare stocks closed above their 200-day average, despite over 75% of S&P 500 members residing above their respective long-term average, have typically resulted in flat to slightly negative returns for the S&P 500 healthcare sector over the subsequent year. Moreover, the associated risks surpassed the potential rewards during these periods.
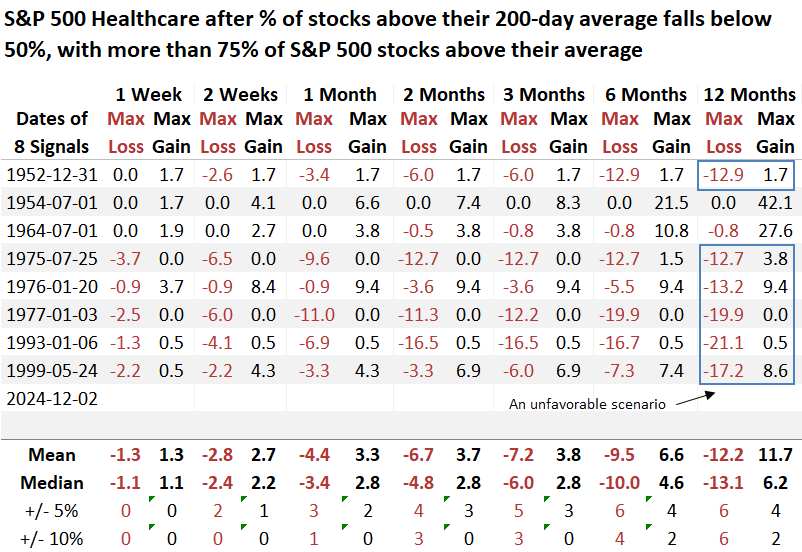
Over the subsequent year, six out of eight precedents experienced a maximum loss surpassing 10%, and in each case, the loss exceeded the gain.
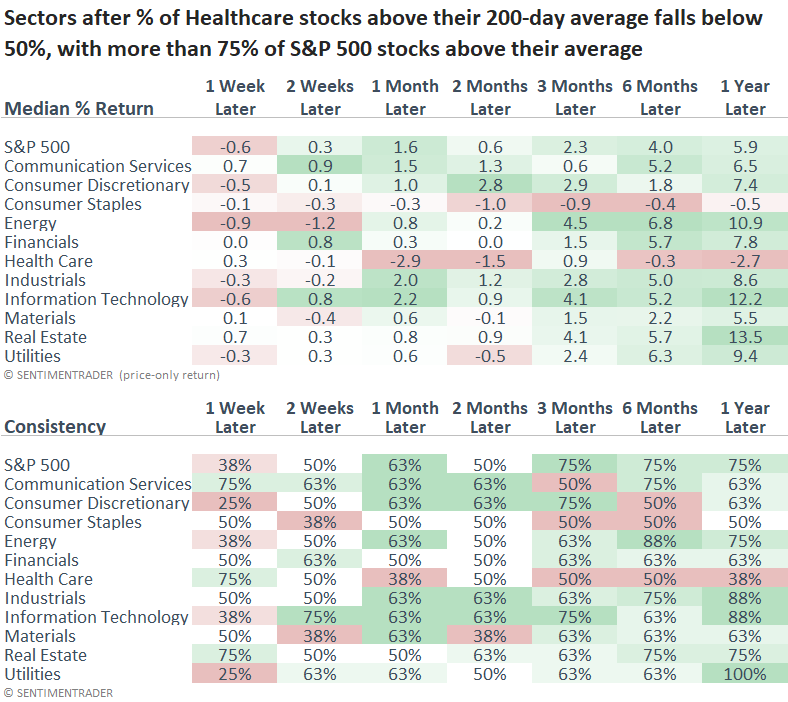
Twelve months later, the S&P 500 Healthcare sector ranked as the worst-performing sector and trailed the broad market in all measured intervals apart from the one-week timeframe.
Big-picture perspective
As noted earlier, the relative ratio of the S&P 500 Healthcare sector to the S&P 500 recently hit its lowest level since July 2008. Although it saw an accelerated decline post-election, the question arises whether a systemic issue is plaguing the sector, given that the ratio peaked in 2015.
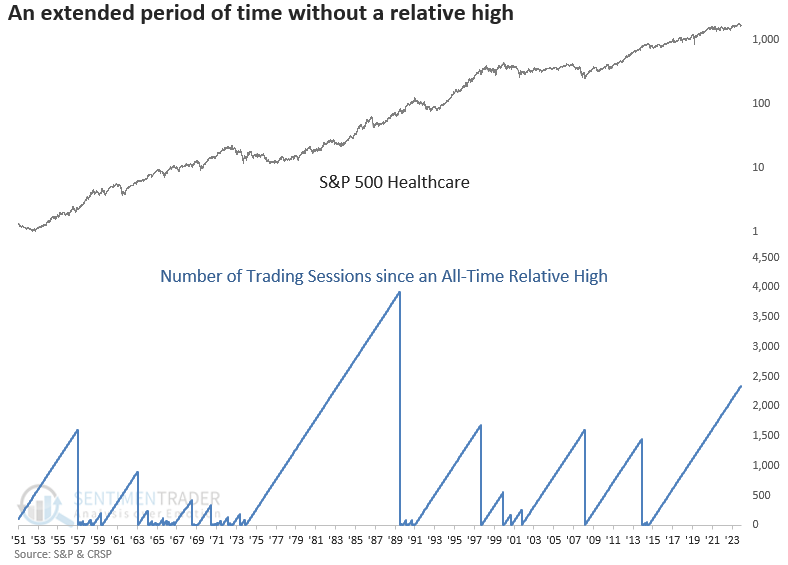
Since the S&P 500 healthcare sector's relative ratio peaked in 2015, it has now gone 2,348 trading sessions without reclaiming that level, the second-longest stretch ever recorded. This prolonged period calls into question whether the sector suffers from some systemic problem reminiscent of 1975-1990.
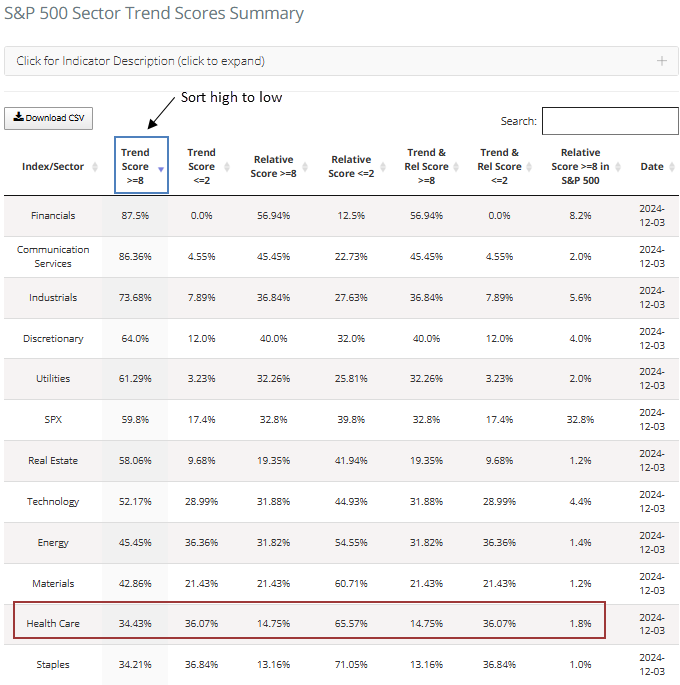
Trend and relative trend scores
Our website's trend score summary page provides a comprehensive view of S&P 500 sector trends, helping users quickly identify whether a group exhibits positive or negative trends across several metrics. As illustrated in the table below, stocks within the healthcare sector display unfavorable trends.
What the research tells us...
The healthcare sector has experienced significant relative underperformance, struggling to keep pace with the broader market, a common scenario during uptrends. Although the relative weakness is not surprising, the recent deterioration in long-term price trends for stocks comprising the S&P 500 healthcare sector leaves another dark cloud overhanging the group. Similar divergences between healthcare stocks and the broad market produced an unfavorable outlook for the industry over the subsequent year, suggesting the relative underperformance persists. However, at some point, it could get so bad it's good, and investors will want to keep an eye on this group for a mean reversion opportunity.