Products
SentimenTrader Trading Tools
‍
Backtest Engine
My Trading Toolkit
Correlation Analysis
Seasonality
Market Prediction
Indicators & Data API
‍
Proprietary Indicators & Charts
Market Data API
Strategies & Scanner
‍
50+ Trading Strategies
Smart Stock Scanner
Smart Option Scanner
Research Reports
‍
Research Solutions
Reports Library
Free Resources
Simple Backtest Calculator
Simple Seasonality Calculator
The Kelly Criterion Calculator
Sentiment Geo Map
Public Research Reports
Education
Sentiment Indicators
Technical Indicators
Pricing
Company
About
In the News
Testimonials
Client Success Stories
Contact
Log inLoginSign up
< BACK TO ALL REPORTS

A historic divergence between gold miners and gold

Dean Christians
2023-11-29
The contrasting trajectories between a gold mining index and gold have reached one of the widest divergences in over 50 years. Similar precedents led to a substantial catch-up trade for mining stocks.

Key points:

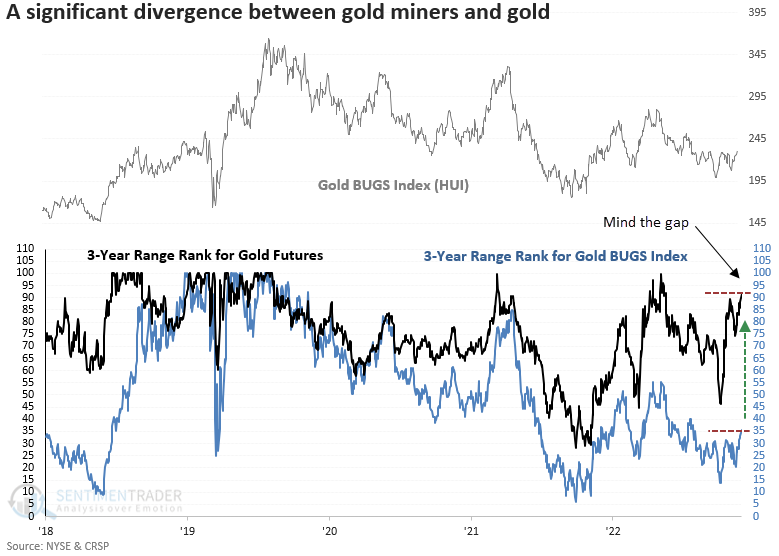
  • Gold miners reside in the lower half of their 3-year range, while gold trades near the upper end
  • Similar divergences led to a rally in the miners every time over the subsequent six and twelve-month periods
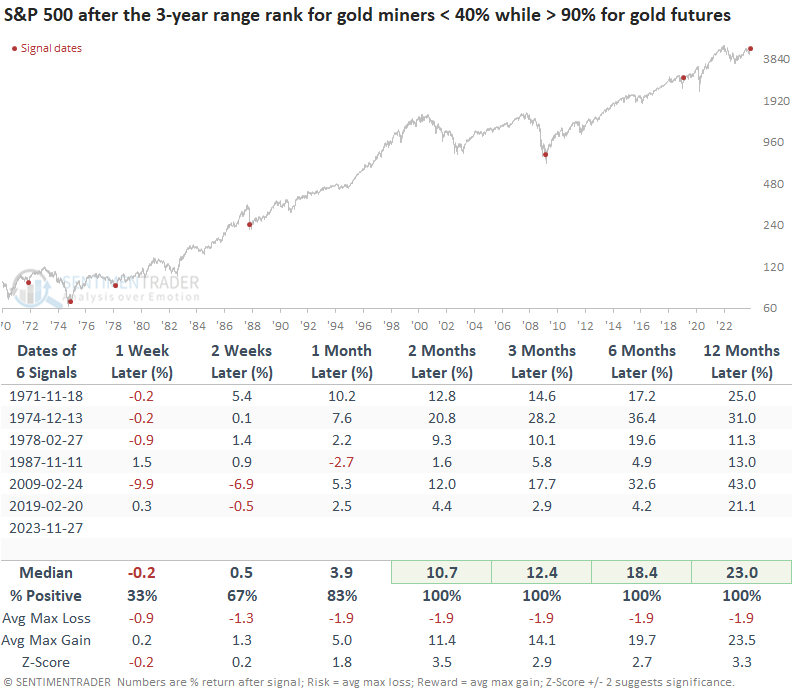
  • Gold futures struggled, and the S&P 500 was higher every time from two to twelve months later

Should we expect a catch-up rally from gold mining stocks?

Gold's impressive ascent, triggered by a historic oversold condition and fueled by Middle East tensions, has brought about a striking divergence between gold miners and the precious metal. 

For only the 7th time in more than five decades, gold futures closed higher than 91% of all other prices over the trailing three years as a gold mining index resided in the bottom half of its range with a reading of 36%, creating a massive divergence.

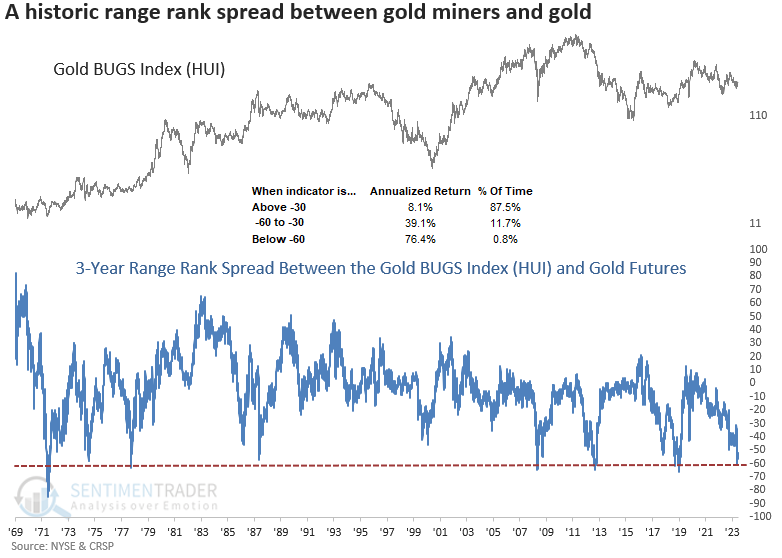
When I calculate the difference between the two range ranks, the spread recently fell to -60, a phenomenon observed in less than 1% of cases since 1969. While rare, readings below -60 tend to ignite an explosive rally, with annualized returns exceeding 76%. 

Similar range rank divergences suggest gold miners rally

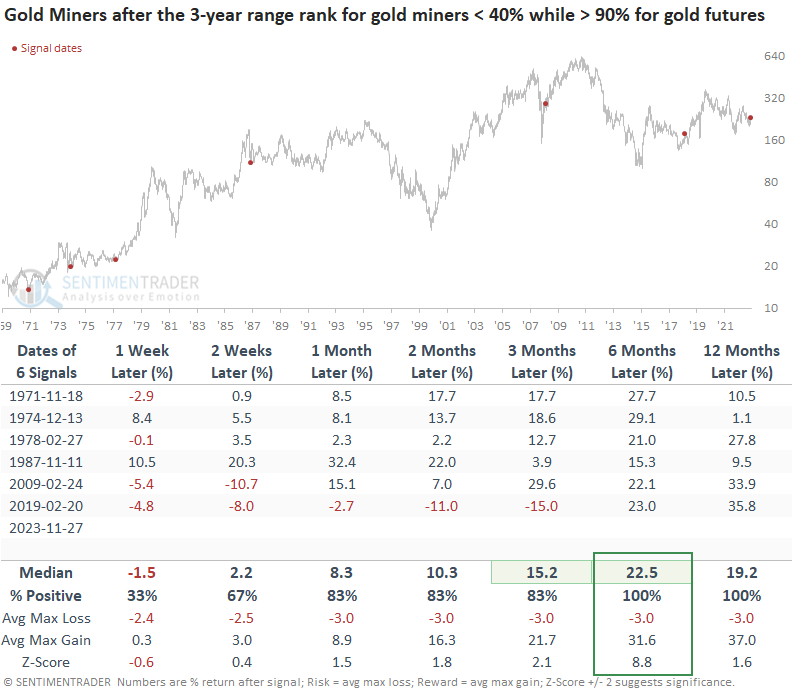
While the sample size is small, whenever the 3-year range rank for gold miners resides below 40% while the rank for gold futures exceeds 90%, the Gold BUGS Index (HUI) was higher over the subsequent six and twelve months every time.

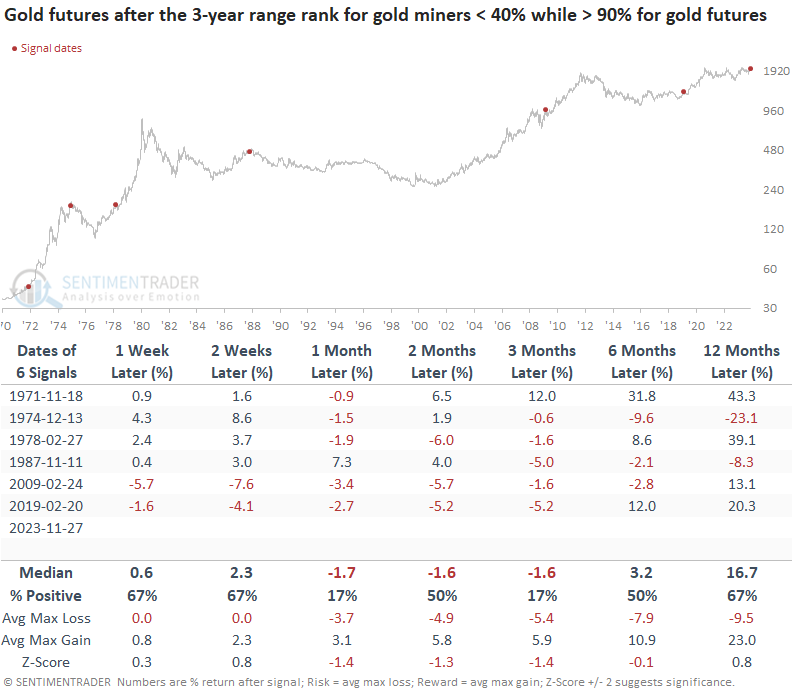
While gold tends to rally over the next few weeks, the medium-term outlook is not encouraging. From a long-term perspective, the path is pretty straightforward. Either gold is about to top like 1974 and 1987, or it's in a sustainable uptrend like the other precedents. A decisive breakout above the previous resistance around 2051 would suggest the latter.

Why do gold miners rally when gold struggles?

One plausible reason gold miners rally as gold struggles is an overall favorable backdrop for the stock market. The S&P 500 was higher every time from two to twelve months later. 

Focusing on the signal dates illustrated on the chart highlights that these divergences coincide with bullish inflection points for the broad market. i.e., gold miners suffered under the weight of an overall market drawdown as gold held up in a flight to safety trade. When it reverses, miners rally, and gold struggles. 

My colleague, Jay Kaeppel, recently published a three-part series on a cycle calendar for gold mining stocks. Please click here, here, and here to review. 

What the research tells us...

Commodity-based assets, like gold mining stocks, often face challenges in sustaining long-term upward trends due to the mean-reverting nature of commodities. This characteristic makes adopting a buy-and-hold strategy challenging. Nonetheless, during cyclical upswings, returns can be spectacular over a short period. The current historical discount of gold mining stocks compared to gold, based on a three-year range rank, suggests that we might be witnessing one of those opportune moments in history to participate in an upswing. After similar divergences, the Gold BUGS Index (HUI) was higher over the subsequent six and twelve-month time frames every time.

PRODUCTS
SentimenTrader
Trading Tools
Indicators & Data API
‍
Strategies & Scanner
‍
Research Reports
FREE
RESOUrCES
Simple Backtest
Calculator
Simple Seasonality
Calculator
The Kelly Criterion
Calculator
Sentiment Geo Map
‍
Public Research Reports
‍
Education
Sentiment Indicators
‍
Technical Indicators
‍
Pricing
Bundle pricing
‍
FAQ
‍
Announcements
‍
COMPANY
‍
About
‍
In the News
‍
Testimonials
‍
Client Success Stories
CONTACT
‍
General Inquiries
‍
Media Inquiries
‍
Financial Professionals Inquiries
‍
© 2026 Sundial Capital Research Inc. All rights reserved.
Setsail Marketing
TermsPrivacyAffiliate Program
Risk Disclosure: The information and tools provided are for research and analytical purposes only and are not intended as investment advice. Market analysis involves uncertainty, and outcomes may differ from expectations. Users should conduct their own due diligence and consider their individual circumstances before making any financial decisions. Past performance is not necessarily indicative of future results.

Hypothetical Performance Disclosure: Hypothetical performance results have many inherent limitations, some of which are described below. No representation is being made that any account will or is likely to achieve profits or losses similar to those shown; in fact, there are frequently sharp differences between hypothetical performance results and the actual results subsequently achieved by any particular trading program. One of the limitations of hypothetical performance results is that they are generally prepared with the benefit of hindsight. In addition, hypothetical trading does not involve financial risk, and no hypothetical trading record can completely account for the impact of financial risk of actual trading. for example, the ability to withstand losses or to adhere to a particular trading program in spite of trading losses are material points which can also adversely affect actual trading results. There are numerous other factors related to the markets in general or to the implementation of any specific trading program which cannot be fully accounted for in the preparation of hypothetical performance results and all which can adversely affect trading results.

Testimonial Disclosure: Testimonials appearing on this website may not be representative of other clients or customers and is not a guarantee of future performance or success.