Products
SentimenTrader Trading Tools
‍
Backtest Engine
My Trading Toolkit
Correlation Analysis
Seasonality
Market Prediction
Indicators & Data API
‍
Proprietary Indicators & Charts
Market Data API
Strategies & Scanner
‍
50+ Trading Strategies
Smart Stock Scanner
Smart Option Scanner
Research Reports
‍
Research Solutions
Reports Library
Free Resources
Simple Backtest Calculator
Simple Seasonality Calculator
The Kelly Criterion Calculator
Sentiment Geo Map
Public Research Reports
Education
Sentiment Indicators
Technical Indicators
Pricing
Company
About
In the News
Testimonials
Client Success Stories
Contact
Log inLoginSign up
< BACK TO ALL REPORTS

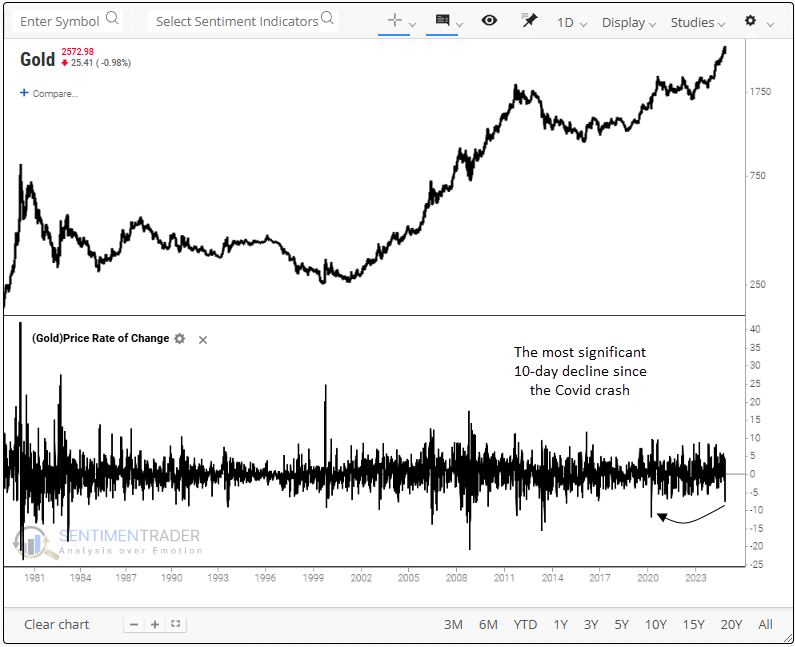
A historic decline in gold from a multi-year high

Dean Christians
2024-11-14
For only the 11th time in history, gold declined more than 7% from a 3-year high. After similar signals, the precious metals rallied 80% of the time over the subsequent two weeks. Although a relief rally looks encouraging, traders should stay alert to the possibility that the rapid correction might usher in a more extended consolidation phase in an uptrend.

Key points:

  • Gold futures declined over 7% in ten sessions from a 3-year high
  • Following similar pullbacks, the precious metal rallied 80% of the time over the next two weeks 
  • Despite the sharp decline, long-term trend-following indicators remain in a favorable position

Should we be concerned about the swift decline in Gold?

In the past ten sessions, gold has fallen by over 7%, a decline that has occurred 51 times since 1975. However, when measured from a 3-year high to capture precedents similar to now, the number of instances drops to 11, a rare event.

With the precious metal firmly in an uptrend, having reached a 3-year high on 43 separate occasions over the last year, investors now face a crucial question: is the recent pullback an early warning of an impending trend change, or just a healthy pause in a bull market?

Similar declines from a 3-year high preceded a near-term bounce

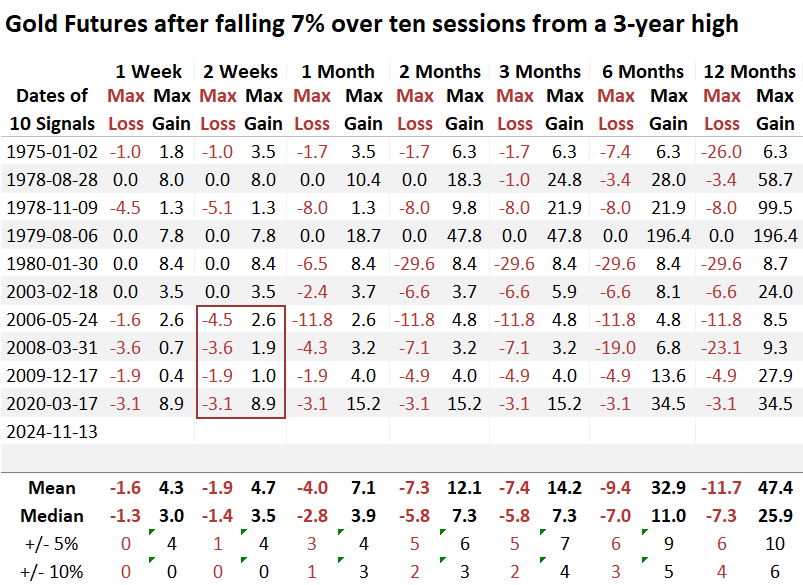
Whenever gold declined 7% in ten sessions from a 3-year high, the precious metal tended to bounce back in the near term, rising 80% of the time over the subsequent two weeks. However, from one to three months later, the rally stalled and, in some cases, saw further downside price action. That was especially the case since 2003. 

Gold futures rose 70% of the time a year later, with a median gain of 16.5%, outpacing the 59% win rate and 8.9% return over the study period for that interval. In two cases, 1975 and 1980, the swift decline marked a significant top.

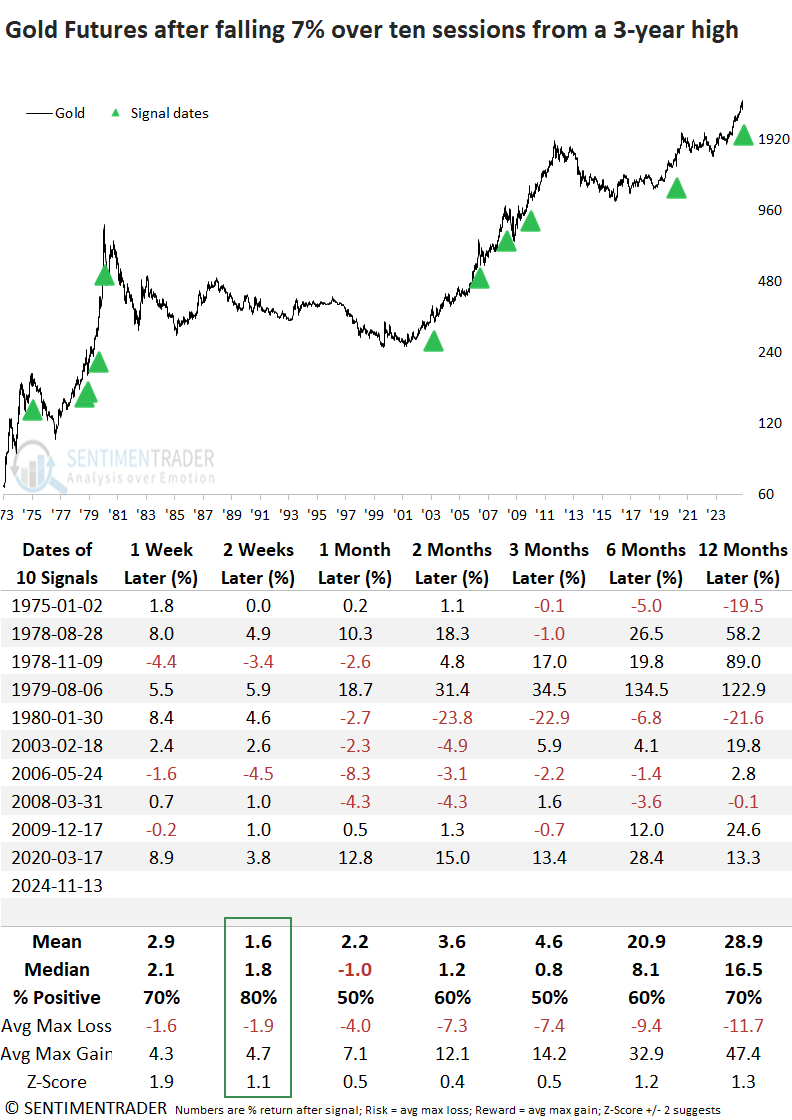
Since 2003, gold has recorded a gain in four out of five instances at the two-week mark. However, the max loss exceeded the max gain in the last four cases, indicating that the precious metal could experience further downside before rallying should price action mirror more recent events.

Don't rule out sideways price action

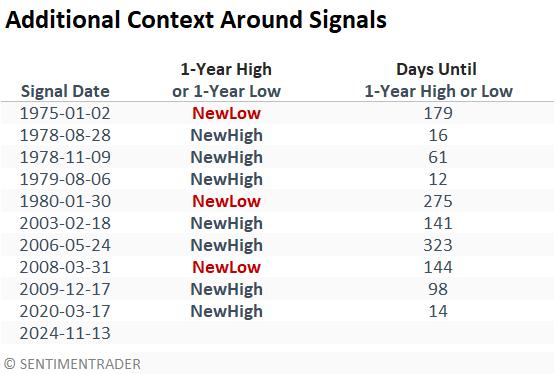
Although a new one-year high precedes a one-year low in 70% of cases, an immediate rebound to fresh highs appears unlikely. In similar scenarios, the time to reach a new high averaged 95 days, with a median of 61 days. 
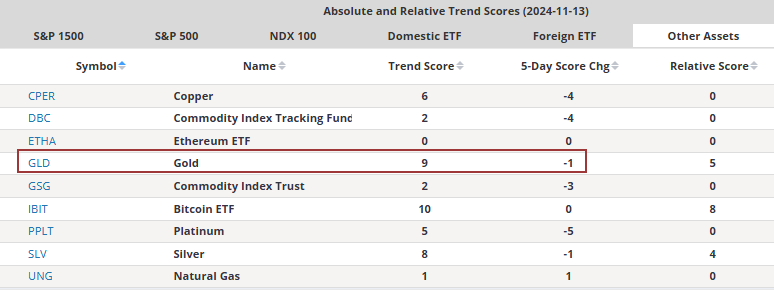
Trend Scores

Subscribers can now review trend and relative trend scores for gold and other assets on the website. Click here to explore.

The gold ETF (GLD) currently displays 9 out of 10 trend-following indicators in favorable conditions. So, despite the recent swoon, gold remains constructive from a long-term trend-following perspective. 

What the research tells us...

Gold recently saw a notable decline, dropping over 7% from a multi-year high, potentially as a delayed reaction to rising Treasury yields or a stronger U.S. dollar. After similar declines, gold rebounded 80% of the time over the following two weeks. Despite this initial bounce, gold tended to stall, often consolidating from one to three months. A year later, the precious metal was higher 70% of the time, and it was likely to hit a 1-year high before a 1-year low. However, it required some patience, as new highs were months away. I encourage subscribers to monitor the new trend score page to keep abreast of the latest developments in gold.

As Ed Seykota was found of saying "The trend is your friend until the end when it bends." 

PRODUCTS
SentimenTrader
Trading Tools
Indicators & Data API
‍
Strategies & Scanner
‍
Research Reports
FREE
RESOUrCES
Simple Backtest
Calculator
Simple Seasonality
Calculator
The Kelly Criterion
Calculator
Sentiment Geo Map
‍
Public Research Reports
‍
Education
Sentiment Indicators
‍
Technical Indicators
‍
Pricing
Bundle pricing
‍
FAQ
‍
Announcements
‍
COMPANY
‍
About
‍
In the News
‍
Testimonials
‍
Client Success Stories
CONTACT
‍
General Inquiries
‍
Media Inquiries
‍
Financial Professionals Inquiries
‍
© 2026 Sundial Capital Research Inc. All rights reserved.
Setsail Marketing
TermsPrivacyAffiliate Program
Risk Disclosure: The information and tools provided are for research and analytical purposes only and are not intended as investment advice. Market analysis involves uncertainty, and outcomes may differ from expectations. Users should conduct their own due diligence and consider their individual circumstances before making any financial decisions. Past performance is not necessarily indicative of future results.

Hypothetical Performance Disclosure: Hypothetical performance results have many inherent limitations, some of which are described below. No representation is being made that any account will or is likely to achieve profits or losses similar to those shown; in fact, there are frequently sharp differences between hypothetical performance results and the actual results subsequently achieved by any particular trading program. One of the limitations of hypothetical performance results is that they are generally prepared with the benefit of hindsight. In addition, hypothetical trading does not involve financial risk, and no hypothetical trading record can completely account for the impact of financial risk of actual trading. for example, the ability to withstand losses or to adhere to a particular trading program in spite of trading losses are material points which can also adversely affect actual trading results. There are numerous other factors related to the markets in general or to the implementation of any specific trading program which cannot be fully accounted for in the preparation of hypothetical performance results and all which can adversely affect trading results.

Testimonial Disclosure: Testimonials appearing on this website may not be representative of other clients or customers and is not a guarantee of future performance or success.