Products
SentimenTrader Trading Tools
‍
Backtest Engine
My Trading Toolkit
Correlation Analysis
Seasonality
Indicators & Data API
‍
Proprietary Indicators & Charts
Market Data API
Strategies & Scanner
‍
50+ Trading Strategies
Smart Stock Scanner
Research Reports
‍
Research Solutions
Reports Library
Free Resources
Simple Backtest Calculator
Simple Seasonality Calculator
The Kelly Criterion Calculator
Sentiment Geo Map
Public Research Reports
Pricing
Company
About
In the News
Testimonials
Client Success Stories
Contact
Log inLoginSign up
< BACK TO ALL REPORTS

A Historic Battle Between Global Stocks and U.S. Industries

Jason Goepfert
2021-06-11
There has been a surge in global indexes hitting 52-week highs, far outpacing the percentage of U.S. industries hitting new highs.

Global markets are picking up, and many of them have been hitting new highs.

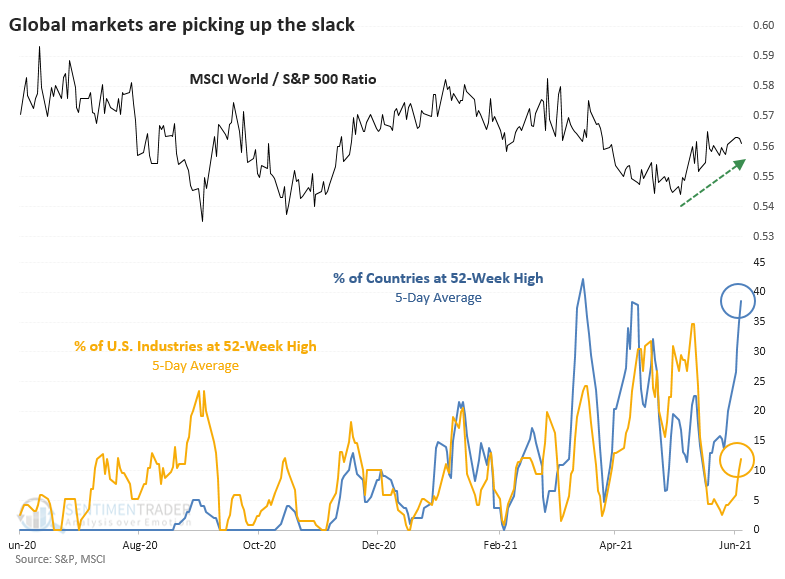
Recently, there has been a pickup in absolute and relative trends in many global markets, and several developing markets have been triggering internal breadth thrusts. The momentum has been enough to push 30% or more of global indexes to fresh highs in recent weeks.

This is interesting because the percentage of developed countries at a 52-week high has greatly exceeded the percentage of U.S. industries at a new high, as pointed out by Willie Delwiche. This is a stark change from last summer.

It's not like scenarios like this were a bad sign for the S&P 500 going forward. On the contrary, it usually rose, or if it lost ground, those losses were minor. 

This was a better sign for world markets over the medium-term. The MSCI World Index (excluding the United States) showed some short-term weakness but consistently rose over the next 2-6 months.  

What else we're looking at

  • Full returns following times when countries far outpaced industries
  • How the MSCI World Index did versus the S&P 500 after these signals
  • Looking at a ratio of equal-weight Discretionary versus Staples stocks as a risk-off signal
  • What happens when stocks break out from a 10-day range close to a high


Stat box

The S&P 500 was stuck within 1% of its record high for 10 days without closing at one. That changed on Thursday. But markets are not logical - when the S&P broke out to the upside from similar ranges, it underperformed over the next month compared to when it broke down out of the range. When markets coil, often the first move is a fake move.

Etcetera

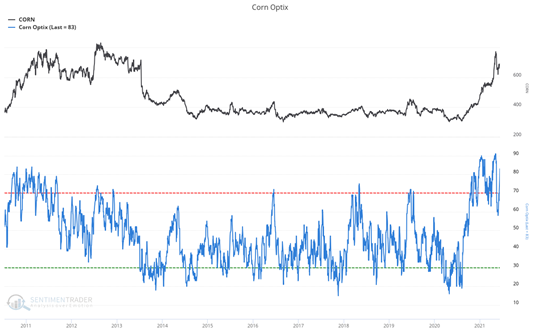
Kernel storm. Our corn optix has hit its 3rd highest point in the last decade, with the other two highs peaking early this year.

corn optimism index sentiment

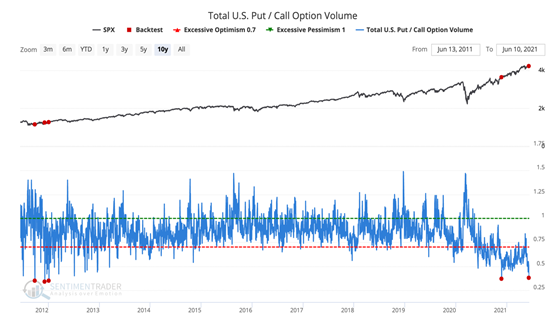
Called it. According to our Backtest Engine, total U.S. put call option volume has dropped below 0.4 for the fifth time in ten years. The few others might have shown some quick weakness in stocks, but all recovered.

total put call ratio

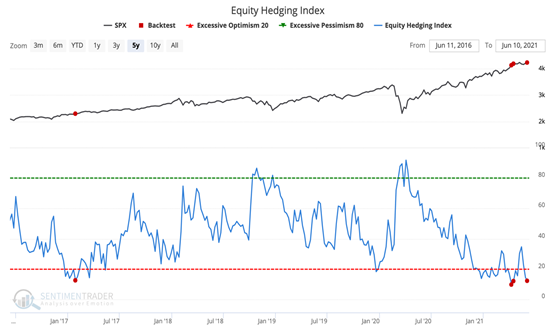
Rally cry. The equity hedging index has fallen below 13 for the fourth time in the past five years, three of them in the last two months. The low put/call ratios we've seen in recent days with help to push this index of hedging activity even lower this week.

equity hedging index

PRODUCTS
SentimenTrader
Trading Tools
Indicators & Data API
‍
Strategies & Scanner
‍
Research Reports
FREE
RESOUrCES
Simple Backtest
Calculator
Simple Seasonality
Calculator
The Kelly Criterion
Calculator
Sentiment Geo Map
‍
Public Research Reports
‍
Pricing
Bundle pricing
‍
Announcements
‍
FAQ
COMPANY
‍
About
‍
In the News
‍
Testimonials
‍
Client Success Stories
CONTACT
‍
General Inquiries
‍
Media Inquiries
‍
Financial Professionals Inquiries
‍
© 2025 Sundial Capital Research Inc. All rights reserved.
Setsail Marketing
TermsPrivacyAffiliate Program
Risk Disclosure: Futures and forex trading contains substantial risk and is not for every investor. An investor could potentially lose all or more than the initial investment. Risk capital is money that can be lost without jeopardizing ones’ financial security or life style. Only risk capital should be used for trading and only those with sufficient risk capital should consider trading. Past performance is not necessarily indicative of future results.

Hypothetical Performance Disclosure: Hypothetical performance results have many inherent limitations, some of which are described below. No representation is being made that any account will or is likely to achieve profits or losses similar to those shown; in fact, there are frequently sharp differences between hypothetical performance results and the actual results subsequently achieved by any particular trading program. One of the limitations of hypothetical performance results is that they are generally prepared with the benefit of hindsight. In addition, hypothetical trading does not involve financial risk, and no hypothetical trading record can completely account for the impact of financial risk of actual trading. for example, the ability to withstand losses or to adhere to a particular trading program in spite of trading losses are material points which can also adversely affect actual trading results. There are numerous other factors related to the markets in general or to the implementation of any specific trading program which cannot be fully accounted for in the preparation of hypothetical performance results and all which can adversely affect trading results.

Testimonial Disclosure: Testimonials appearing on this website may not be representative of other clients or customers and is not a guarantee of future performance or success.