Products
SentimenTrader Trading Tools
‍
Backtest Engine
My Trading Toolkit
Correlation Analysis
Seasonality
Indicators & Data API
‍
Proprietary Indicators & Charts
Market Data API
Strategies & Scanner
‍
50+ Trading Strategies
Smart Stock Scanner
Research Reports
‍
Research Solutions
Reports Library
Free Resources
Simple Backtest Calculator
Simple Seasonality Calculator
The Kelly Criterion Calculator
Sentiment Geo Map
Public Research Reports
Pricing
Company
About
In the News
Testimonials
Client Success Stories
Contact
Log inLoginSign up
< BACK TO ALL REPORTS

A High HiLo As Investors Rush Into Cash

Jason Goepfert
2019-08-13
null

High HiLo

A breadth indicator popularized several decades ago is highlighting a historically split market. To one of the largest degrees in years, there are a lot of winning and a lot of losing stocks at the same time.

Per Investopedia, the HiLo Logic Index:

The high-low index compares stocks that are reaching their 52-week highs with stocks that are hitting their 52-week lows. The high-low index is used by investors and traders to confirm the prevailing market trend of a broad market index, such as the Standard and Poor’s 500 index (S&P 500).

Popularized decades ago by Norman Fosback, and highlighted recently by Jay Kaeppel, a high level in the indicator shows a market that contains a lot of winners and losers at the same time. That's usually unsustainable and shows internal conflict.

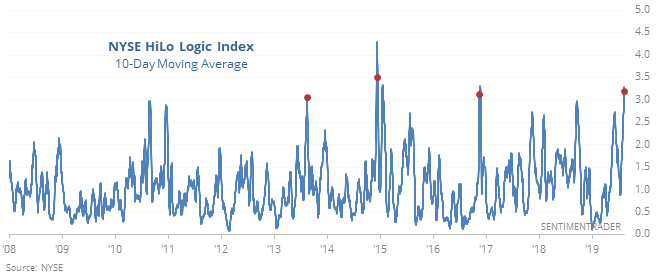
In the context of a long-term uptrend, this is a warning sign. It hasn’t been very reliable on the NYSE, but it has on the Nasdaq in recent years.

For more information, two excellent resources are Fosback's Stock Market Logic and Greg Morris's Complete Guide To Market Breadth Indicators.

Cash stampede

Investors have been shoving money into cash instruments lately. The last week showed another large influx, adding to swiftly rising assets over the past four months. This is happening even though stocks are about flat over that time frame.

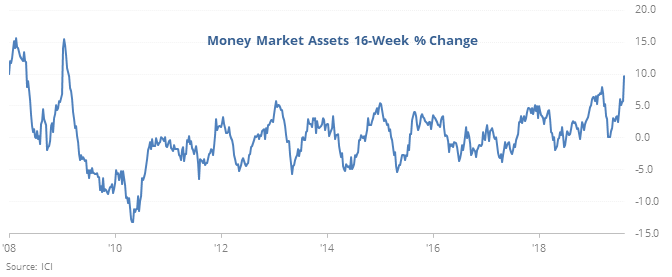
Both bulls and bears would want to make an argument for their side, but empirically since 1984 it has not consistently favored either side.

Moving days

The Financial Times noted that stocks have moved more than 1% intraday for 8 straight days. Make that 9 days now. Coming after a 52-week high, it’s happened only 3 times since 1982. It’s happened 5 times in August regardless of market environment. All of these instances led to higher prices for the S&P 500 over the next three months, averaging 5.7%.

Extreme(s)

On July 24, 40% more of our indicators were showing optimism than pessimism. Now 10% more are showing pessimism than optimism, the most since early January. This isn’t quite extreme, but over the past decade the S&P has shown a 3-month return of 5.2% and 80% win rate when the spread was this wide.

This post was an abridged version of our previous day's Daily Report. For full access, sign up for a 30-day free trial now.

PRODUCTS
SentimenTrader
Trading Tools
Indicators & Data API
‍
Strategies & Scanner
‍
Research Reports
FREE
RESOUrCES
Simple Backtest
Calculator
Simple Seasonality
Calculator
The Kelly Criterion
Calculator
Sentiment Geo Map
‍
Public Research Reports
‍
Pricing
Bundle pricing
‍
Announcements
‍
FAQ
COMPANY
‍
About
‍
In the News
‍
Testimonials
‍
Client Success Stories
CONTACT
‍
General Inquiries
‍
Media Inquiries
‍
Financial Professionals Inquiries
‍
© 2025 Sundial Capital Research Inc. All rights reserved.
Setsail Marketing
TermsPrivacyAffiliate Program
Risk Disclosure: Futures and forex trading contains substantial risk and is not for every investor. An investor could potentially lose all or more than the initial investment. Risk capital is money that can be lost without jeopardizing ones’ financial security or life style. Only risk capital should be used for trading and only those with sufficient risk capital should consider trading. Past performance is not necessarily indicative of future results.

Hypothetical Performance Disclosure: Hypothetical performance results have many inherent limitations, some of which are described below. No representation is being made that any account will or is likely to achieve profits or losses similar to those shown; in fact, there are frequently sharp differences between hypothetical performance results and the actual results subsequently achieved by any particular trading program. One of the limitations of hypothetical performance results is that they are generally prepared with the benefit of hindsight. In addition, hypothetical trading does not involve financial risk, and no hypothetical trading record can completely account for the impact of financial risk of actual trading. for example, the ability to withstand losses or to adhere to a particular trading program in spite of trading losses are material points which can also adversely affect actual trading results. There are numerous other factors related to the markets in general or to the implementation of any specific trading program which cannot be fully accounted for in the preparation of hypothetical performance results and all which can adversely affect trading results.

Testimonial Disclosure: Testimonials appearing on this website may not be representative of other clients or customers and is not a guarantee of future performance or success.