
A hedge fund clue for gold - and commodities

Key Points
- Hedge fund exposure to gold has declined sharply in recent months
- Often, a sharp decline has pointed to higher gold prices moving forward
- Somewhat surprisingly, the effect seems to be just the opposite for commodities as an asset class
Hedge fund exposure for gold plunges
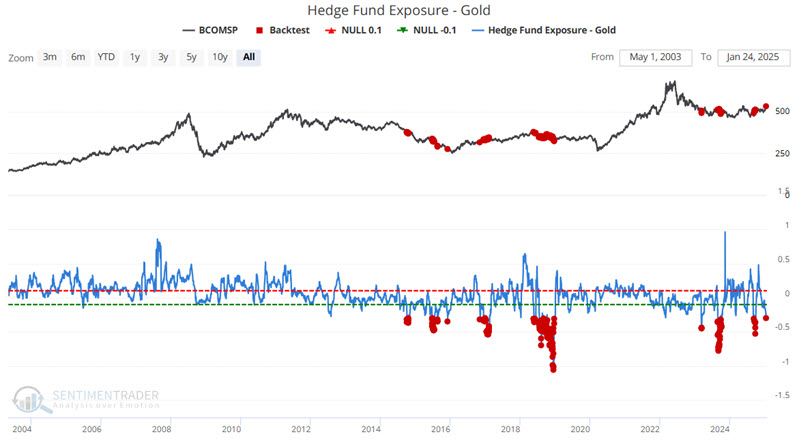
The chart below displays our Hedge Fund Exposure-Gold indicator. To the naked eye, there doesn't appear to be much rhyme or reason to the relationship between indicator action and gold price movement.
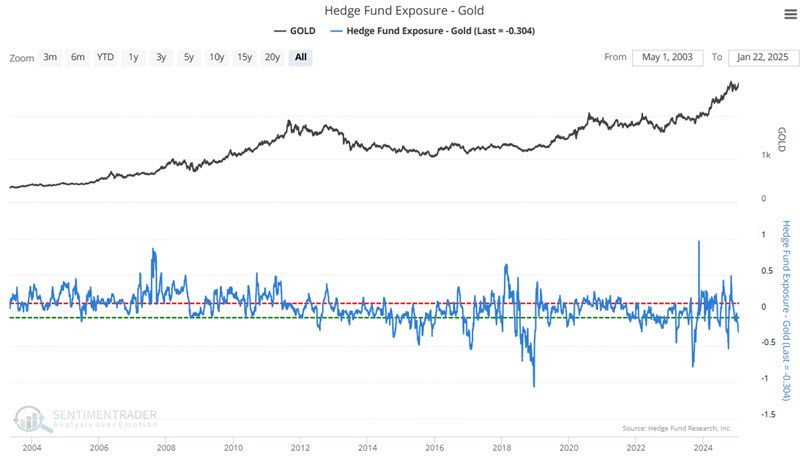
This indicator is based on a composite of hedge fund tracking indexes. It compares this index of hedge fund exposure against returns in gold futures to see how much exposure hedge funds appear to have to the gold market. The index will rise more than gold and vice-versa if they are highly exposed. We generally see that when funds are heavily exposed to gold, the market is in danger of stalling out or falling as these funds retrench. When under-exposed, gold may see buying pressure come in as funds add exposure.
Let's look at gold performance following previous readings that are similar to now.
Looking at a moving average of hedge fund gold exposure
For our primary test, the chart below highlights with a red dot those dates when the 100-day moving average of our Hedge Fund Exposure - Gold indicator crossed below -0.05. The most recent signal occurred on 2025-01-22.
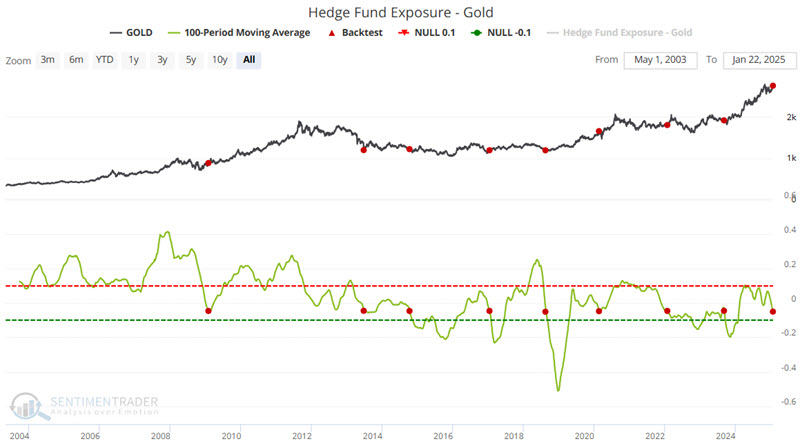
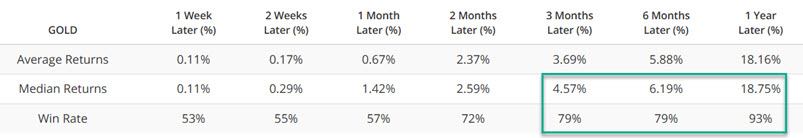
The table below summarizes subsequent gold futures performance and signal-by-signal results.
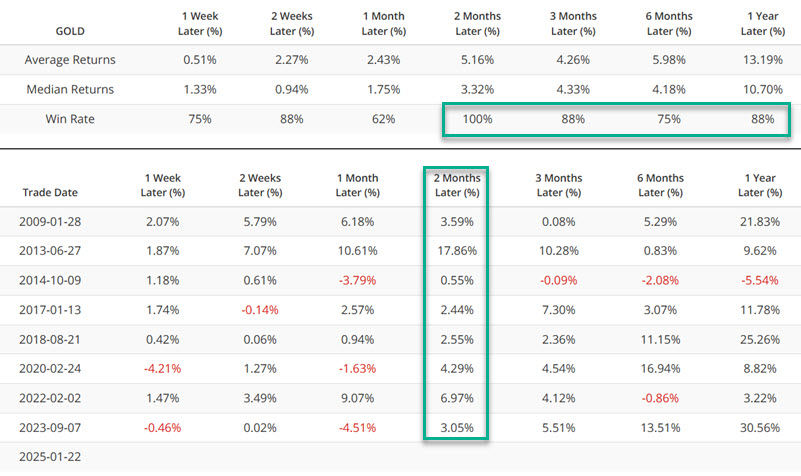
The biggest concern is the relatively small sample size. However, if one is willing to look past that concern, the key thing to note is the high Win Rates for two-month to one-year time periods. It should be emphasized that the two-month Win Rate of 100% does not guarantee that all future signals will see gold futures higher two months after a signal.
Looking at raw data
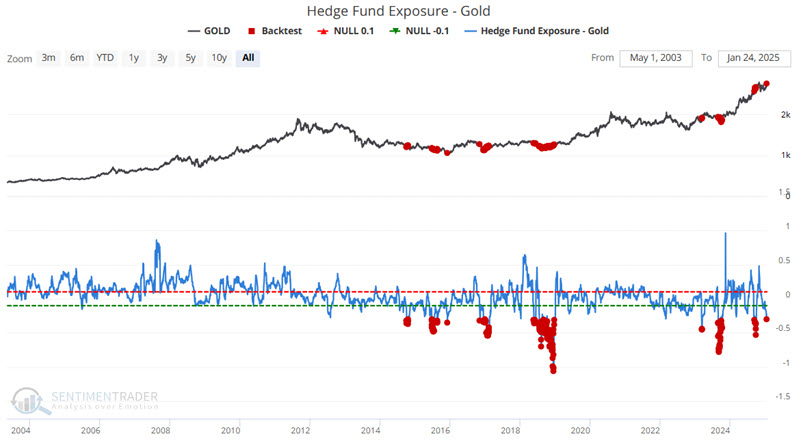
The chart below takes a broader approach and highlights all dates when the Hedge Fund Exposure - Gold indicator (no moving average) was below -0.3, including overlaps.
The table below summarizes performance.
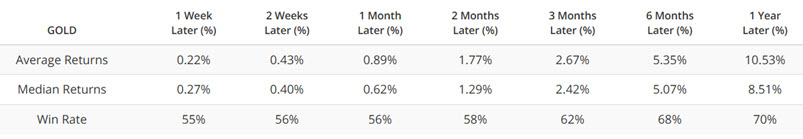
Again, the key thing to note is the above-average Win Rates, particularly for two months and beyond. For comparison, the table below displays Average Returns, Median Returns, and Win Rates for ALL dates in the test.
A look at commodities as an asset class
In this case, what's good for gold is not necessarily good for all commodities. The chart below takes a broader approach and highlights all dates when the Hedge Fund Exposure - Gold indicator (no moving average) was below -0.3, including overlaps, but uses the Bloomberg Commodity Spot Price Index (BCOMSP) as the measuring stick instead of gold.
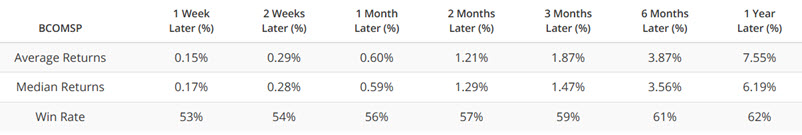
The table below summarizes BCOMSP's performance.
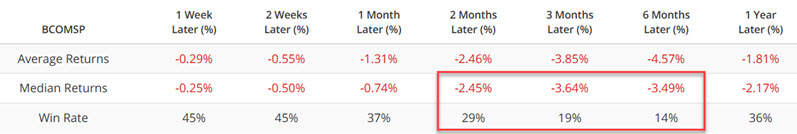
Note that these results are far different from those for gold highlighted above. Each time frame shows negative Average and Median Returns and Win Rates below 50%. Win Rates for three-and six-month periods are abysmally low. These results are well below average for BCOMSP. For comparison, the table below displays Average Returns, Median Returns, and Win Rates for the Bloomberg Commodity Spot Price Index for ALL dates in the test.
What the research tells us...
So, is gold destined to rise in the year ahead while most other commodities lag and/or decline? Well, that is the implication gleaned from the data above. However, it is essential to remember that indicators like the one covered here do not make predictions; they report on past behavior. As such, the recent signal should not be taken as an outright "Buy" signal for gold or an outright "Sell" signal for commodities as an asset class. The primary takeaway is to give the bullish case for gold the benefit of the doubt, particularly if gold maintains its current price uptrend.